
記住我


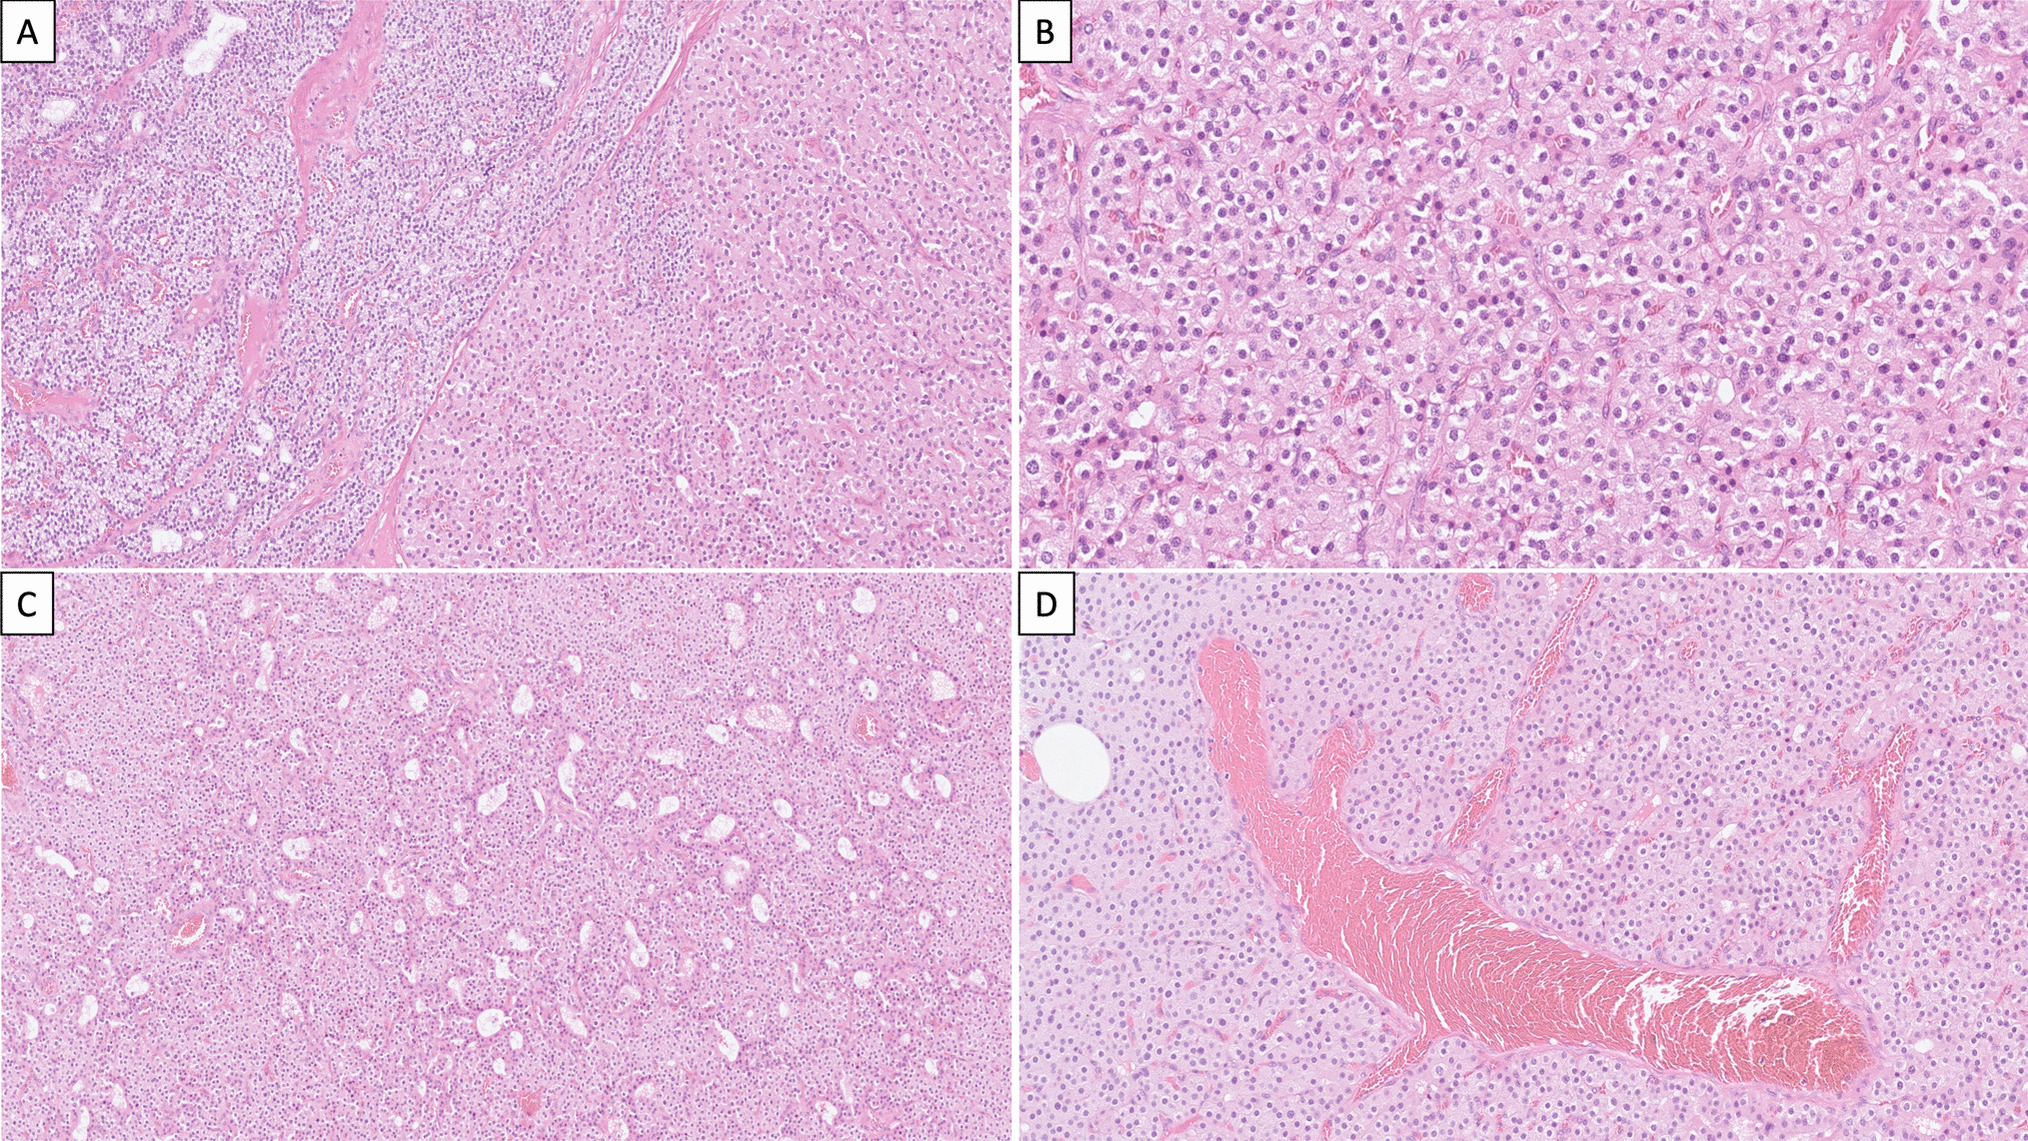
Thyroid glands from the four PDS patients were diagnosed as nodular and diffuse hyperplasia, regardless of their functional thyroid status. Multiple follicular adenomas, as well as even a subcentimeter papillary thyroid carcinoma, were observed in two of the patients (Table 1, Fig. 1A–C). The hyperplastic thyroid tissue showed areas with different follicular patterns, such as normal sized thyroid follicles (Fig. 1D), microfollicles (Fig. 1E), follicles with papillary infoldings within the lumen or “papillary follicles,” some exhibiting tall columnar cells and empty colloid in the lumen (Fig. 1F). In those areas, scattered cells with nuclear atypia and hyperchromasia were observed. Oncocytic changes of follicular cells were also seen in different follicular patterns, either as solitary or grouped cells.
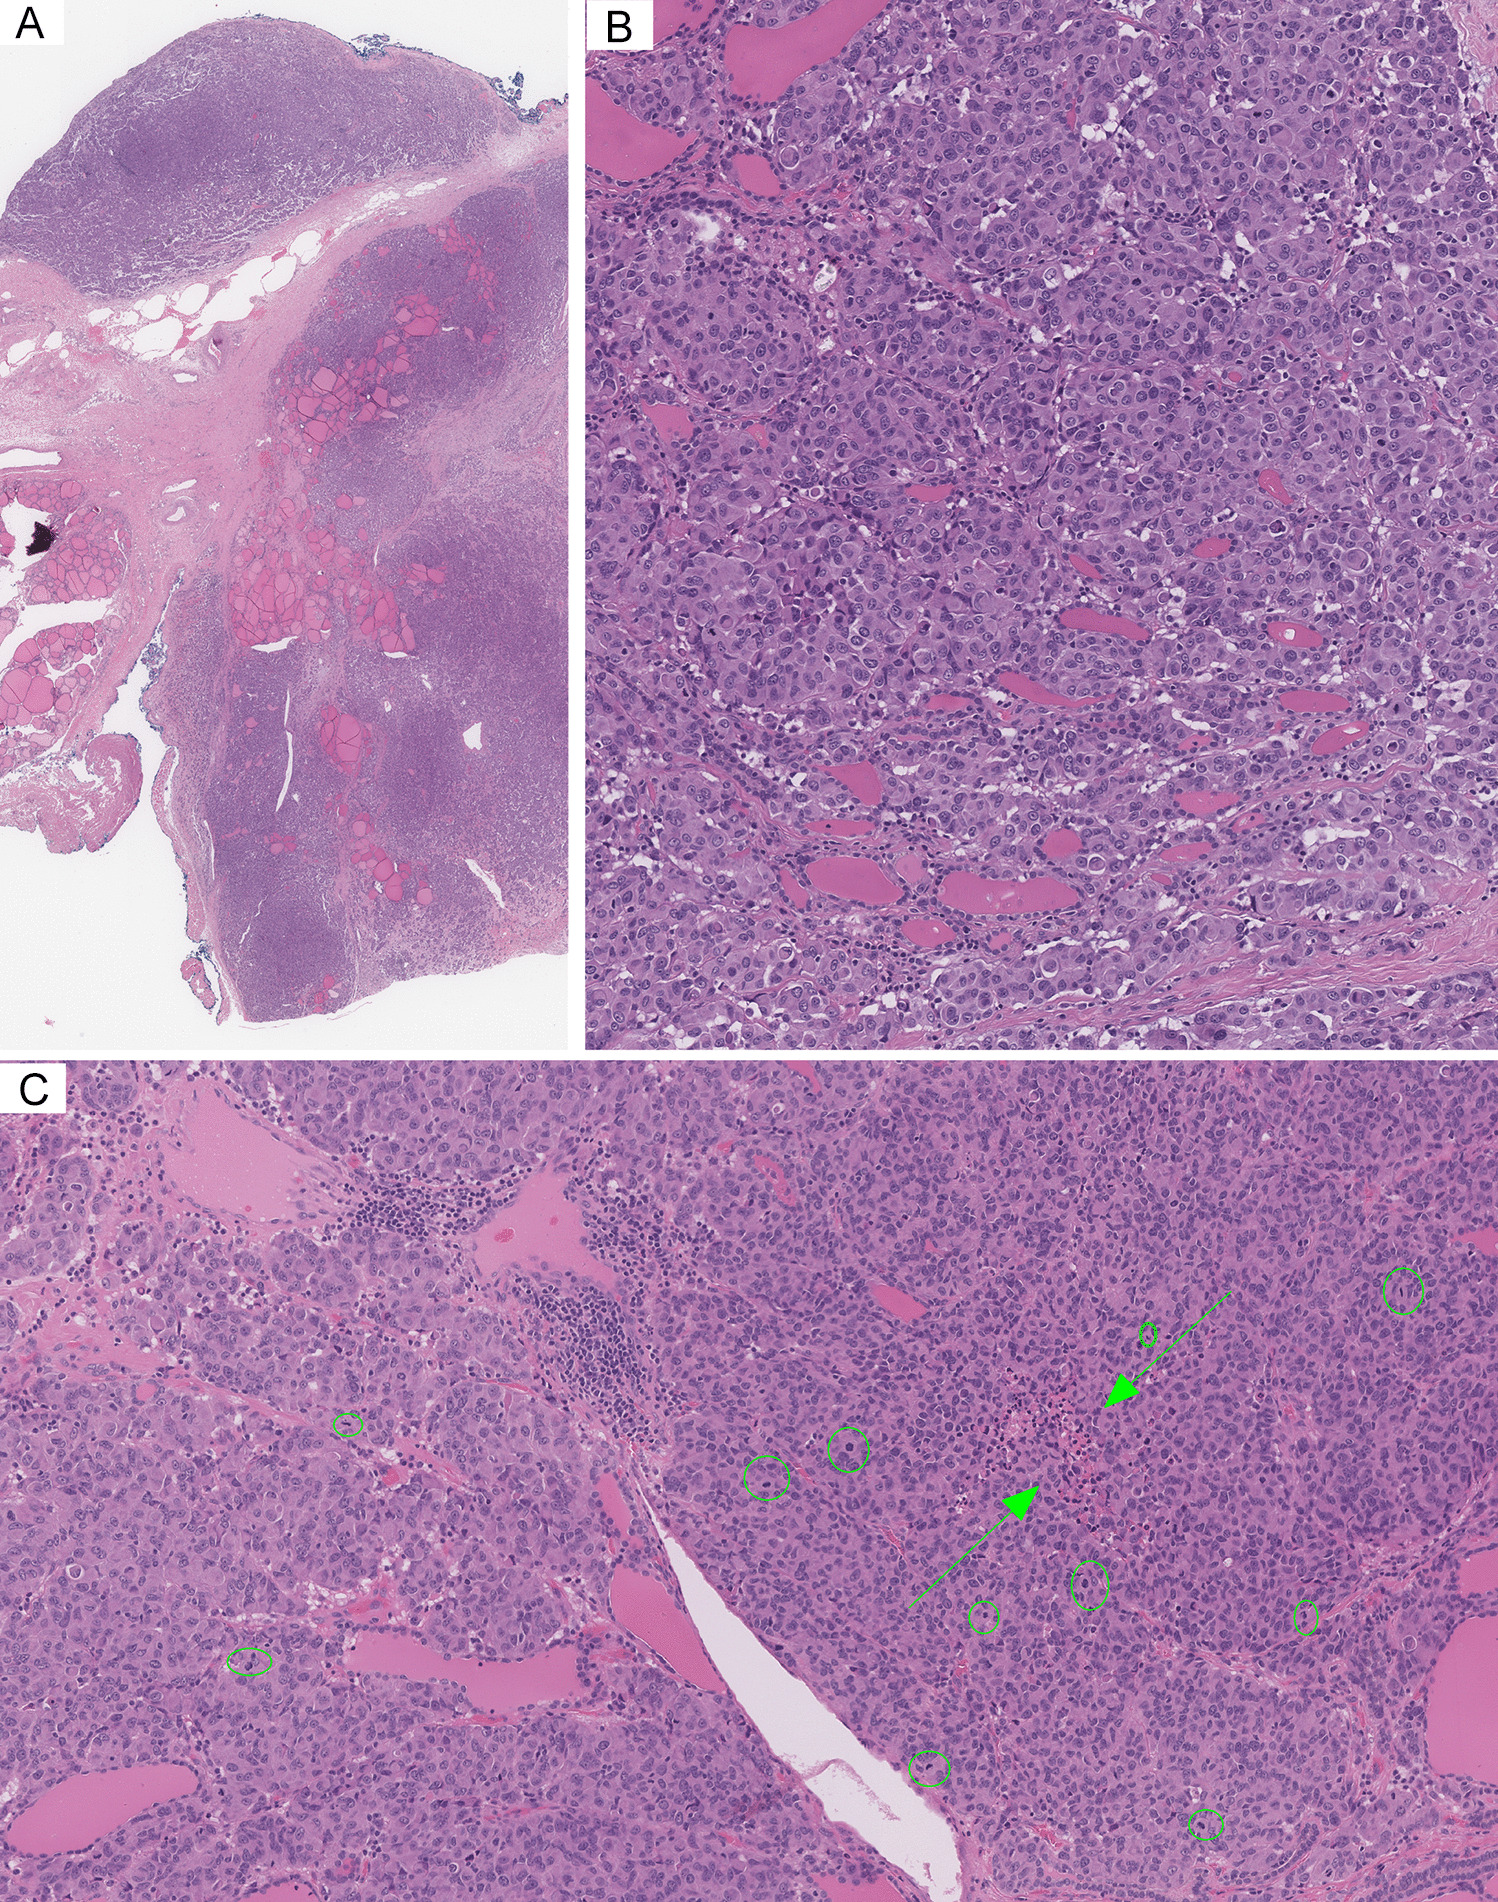
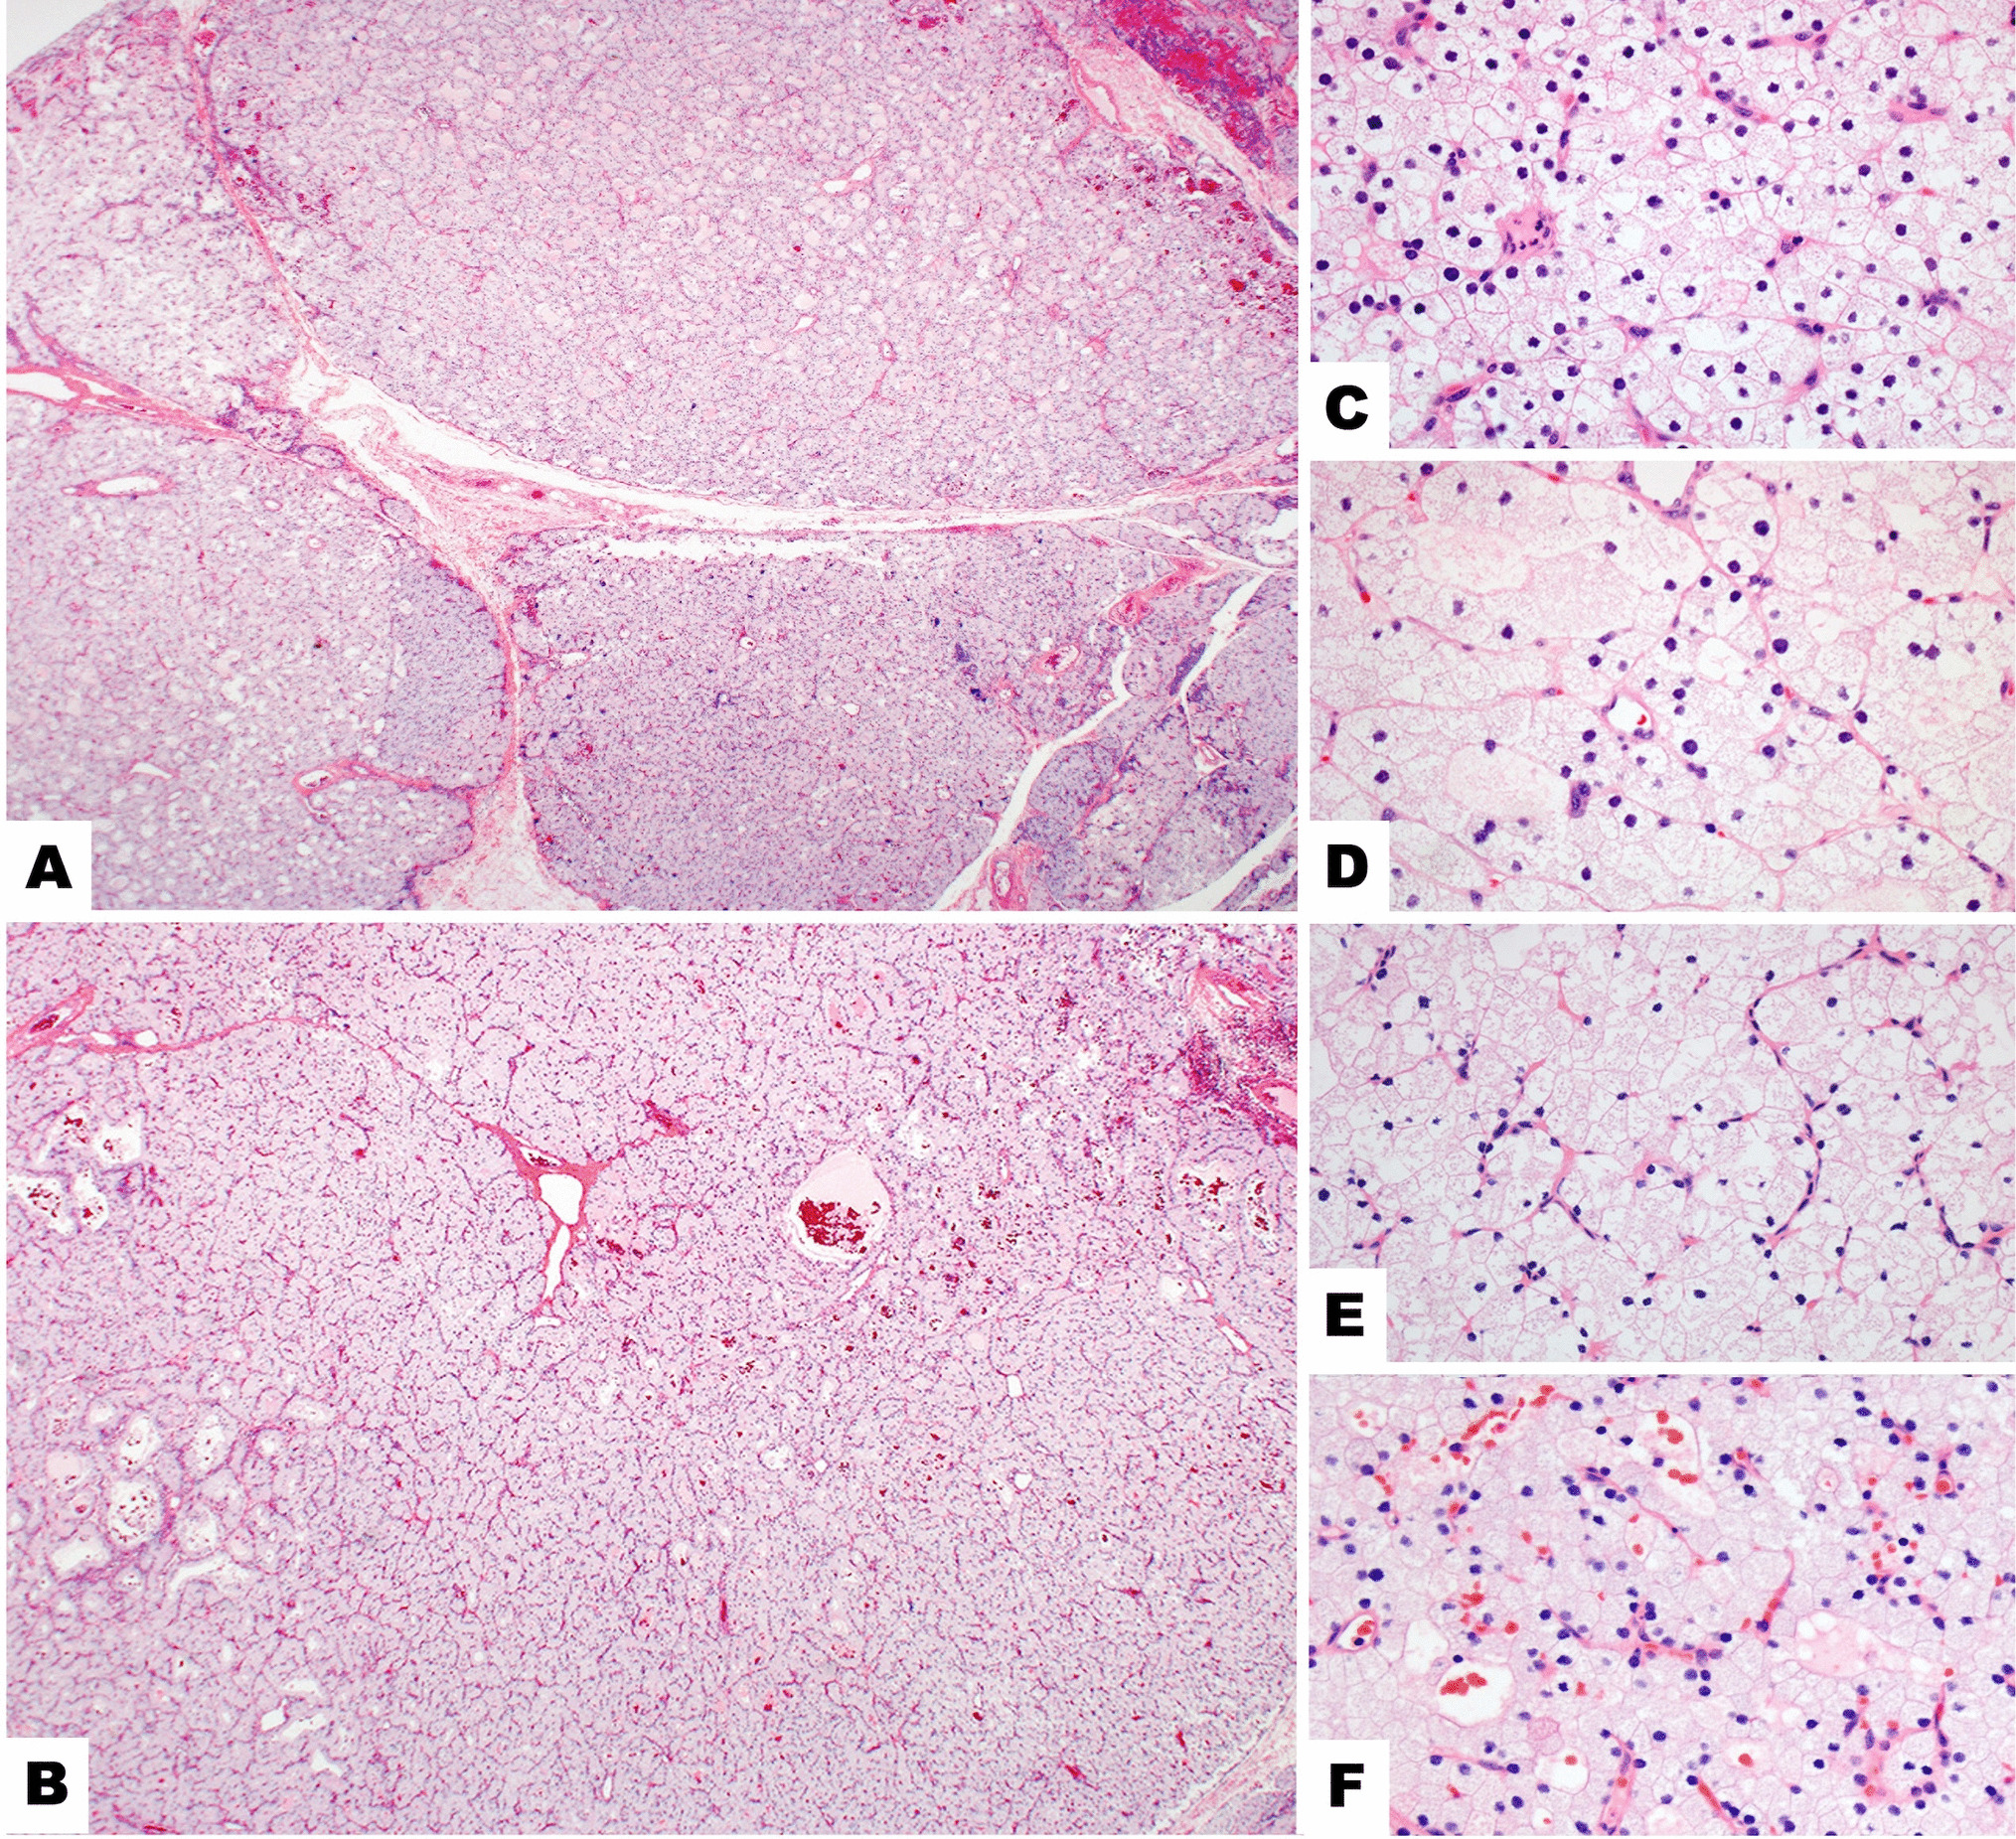
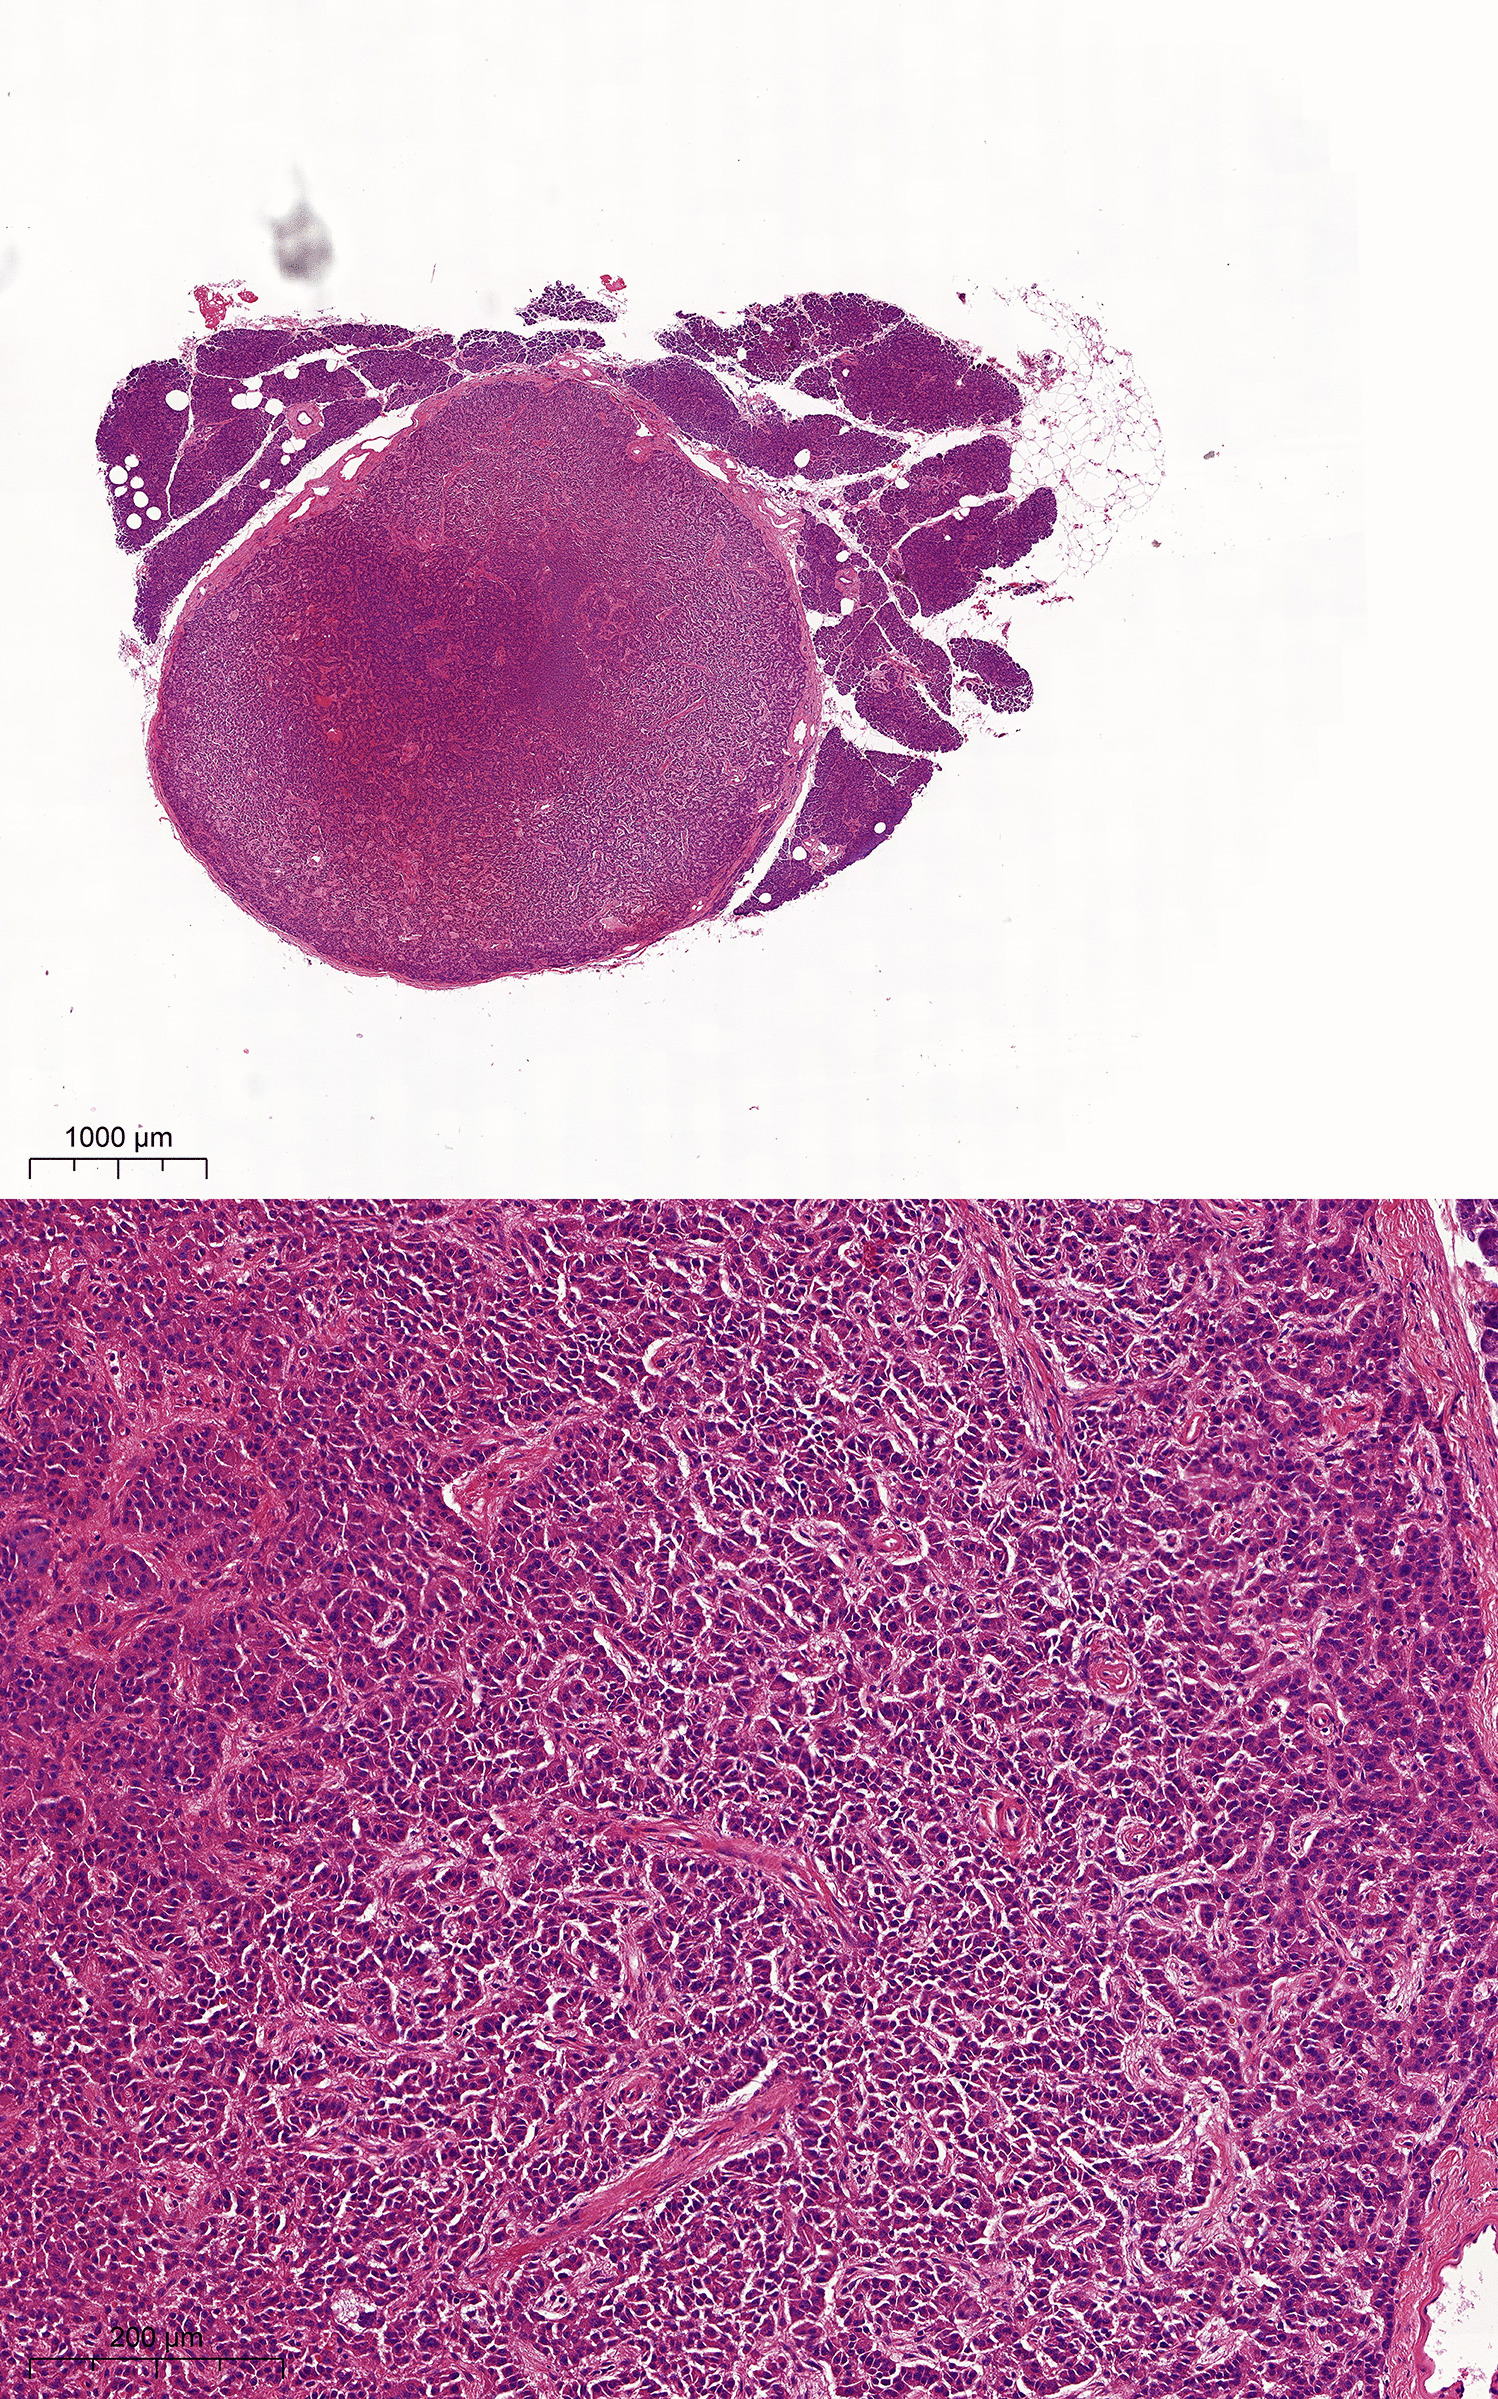
Fig. 1
Histopathological characteristics of thyroid tissue in PDS patients stained with hematoxylin–eosin. Panoramic visions of thyroid samples in which diagnosis of nodular and diffuse thyroid hyperplasia (PDS1; A); diffuse thyroid hyperplasia with a highly cellular follicular nodule (HCFN) (black asterisk) (PDS2; B); and follicular adenoma (blue asterisk) (PDS3; C) were made. In amplifications of those thyroid tissues, different histologic patterns can be distinguished: D normal thyroid follicles; E microfollicles; F papillary follicles; G HCFN with microfollicular pattern and interstitial fibrosis; H HCFN with spindle cell features, and finally, I follicular adenoma exhibiting a trabecular pattern. Scale bars: 70 µm (A–C), 25 µm (G–L)
Moreover, another common alteration consisted of markedly well-defined nodules with a dense cellular growth pattern (HCFNs). HCFN areas exhibited a variety of architectural appearances, which were frequently surrounded by diffuse hyperplastic thyroid tissue (Fig. 1B, black asterisk). In some cases, HCFNs presented a microfollicular pattern with abundant fibrosis and hyalinization of the stroma (Fig. 1G); in other cases, HCFNs exhibited spindle cell features (Fig. 1H). Multiple follicular adenomas were also diagnosed (Fig. 1C, blue asterisk), according to either a solid, microfollicular, or trabecular growth pattern (Fig. 1I). Although in some areas follicles with papillary infoldings were found, no true follicular thyroid adenomas with papillary architecture were observed. Additionally, extensive zones with hemorrhage and destroyed follicles were identified along different thyroid sections, altogether with abundant fibrosis. Finally, no C-cell hyperplasia was detected in our series, either in routine examination of the surgical specimens or by immunostaining of calcitonin.
PDS Tissue Showed Slight Changes in the Expression of Thyroid-Specific Markers and Pendrin-Alternative Iodide TransportersImmunohistochemical findings for thyroid-specific markers were rather similar in the four thyroid PDS samples (Fig. 2). In hyperplastic areas, follicular cells were immunostained for Tg, TPO, and TTF-1, independent of their histopathologic pattern although with slight differences. Specifically, in those areas of normal thyroid follicles and microfollicles, follicular epithelium was fairly stained for Tg, although with less intensity than the colloid; however, in HCFNs and trabecular adenomas, where the colloid was clearly diminished or absent, an apparent decrease of the cytoplasmic staining was observed (Fig. 2). In general, there was a direct correlation between the colloid immunopositivity for Tg and the grade of PAS intensity (Fig. 2). Moreover, no evident changes occurred for either TPO or TTF-1 expression, except when a HCFN was observed, in which immunoreactivity for both antigens was slightly diminished (Fig. 2).
Fig. 2
Immunohistochemical staining for thyroid-specific markers in different histological patterns of PDS thyroid tissue. Tg, thyroglobulin; TPO, thyroperoxidase; TTF1-PAS, TTF1 plus periodic acid-Schiff staining; NF, normal follicles; MF, microfollicles; PF, papillary follicles; HCFN-SC, HCFN with spindle cells; FA, follicular adenoma. No evidence of different immunostainings was observed among the histopathological patterns except for certain decrease of the positivity in HCFN with spindle cells and follicular adenoma. Scale bars, 15 µm
Immunostaining for pendrin was completely negative in PDS thyroid tissue of the four studied patients, as expected, in contrast to normal thyroid and Graves’ disease samples that were clearly immunostained at the apical border of the follicular epithelium (Fig. 3). In relation to the expression for the alternative-iodide exchangers ANO-1, CLC-5, and CFTR, we observed immunopositivity for all of them but mainly according to a cytoplasmic pattern, although with varying intensities (Fig. 3). Specifically, in Graves’ disease thyroid tissue the staining was slightly stronger than in normal thyroids, but rather similar to that displayed by hyperplastic areas of PDS thyroid tissue. Nevertheless, in HCFNs and follicular adenomas, the expression for the three antigens was clearly decreased or even negative (Fig. 3). Positive controls for ANO-1 (gallbladder and small intestine), CLC-5 (epididymis and kidney), and CFTR (larynx and gallbladder) were clearly immunostained.
Fig. 3
Immunohistochemical staining for several iodide transporters (pendrin, ANO-1, CLC-5, and CFTR) in controls and PDS thyroid tissues. Normal thyroid (NT), Graves’ disease (GD), diffuse hyperplastic areas (DH) and follicular adenomas (FA) of PDS patients. In contrast to NT and GD, where immunostaining for pendrin is clearly located at the apical surface of follicular epithelium, no positivity for pendrin in PDS thyroid tissue is seen. Nevertheless, immunostainings for ANO-1, CLC-5, and CFTR are positive in hyperplastic areas of PDS thyroids, as it also occurs in GD tissue, although at cytoplasmic level. Conversely, follicular adenomas are negative. Scale bars, 25 µm
The Frequency of Ciliated Cells and Primary Cilia Lengths Varied Among Different Areas in Accordance with Their Follicular ArchitectureIn general, PC emerged from the center of the apical surface of follicular cells and entered into the follicular lumen at variable angles. The frequency of ciliated cells and PC lengths varied among different areas of the samples, in accordance with their histological pattern (Fig. 4). Specifically, in the hyperplastic thyroid tissue, the highest frequency of ciliated follicular cells was found in normal follicles (79.30 ± 10.08%), followed by microfollicles (61.56 ± 34.59%) and papillary follicles (61.55 ± 14.93%), with non-significant differences. A similar number of ciliated cells was found in HCFN with microfollicular pattern (58.94 ± 28.66%), but drastically decreased either in nodules with spindle cell features (14.09 ± 1%), or in follicular adenomas (29.59 ± 1%), with statistically significant differences in the last two cases (Fig. 5).
Fig. 4
Distribution of PC in PDS thyroid tissue using double immunofluorescence (E-cadherin, green; acetylated α-tubulin, red; nuclear counterstaining with DAPI, blue). Numerous ciliated follicular cells are clearly identifiable in normal thyroid follicles (A), microfollicles (B), and papillary follicles (C) and much less evident in highly cellular follicular nodules (HCFNs) with microfollicular pattern (D). In contrast, only scarce follicular cells of HCFNs with spindle cells features (E) or trabecular follicular adenoma (F) show PC. Scale bars, 10 µm
Fig. 5
Percentage of ciliated follicular cells in the different histologic patterns observed in PDS thyroid tissue. NF, normal follicles; MF, microfollicles; PF, papillary follicles; HCFN-MF, HCFN with microfollicles; HCFN-SC, HCFN with spindle cells; FA, follicular adenoma. Results are expressed as mean ± SD. Data were compared using one-way ANOVA multiple comparisons procedures (Dunn’s method). ***P < 0.001
In relation to the length of PC along the different histological areas, the longest ones were observed in normal follicles (2.4 ± 0.79), followed by HCFNs (1.89 ± 0.75), papillary follicles (1.8 ± 0.48), and microfollicles (1.65 ± 0.44), with slight statistical differences. The shortest PC was also found in both HCFNs with spindle cells (1.16 ± 0.40) and follicular adenomas (1.1 ± 0.39) (Fig. 6).
Fig. 6
Quantitative changes in PC length among different histologic patterns observed in PDS thyroid tissue. NF, normal follicles; MF, microfollicles; PF, papillary follicles; HCFN-MF, HCFN with microfollicles; HCFN-SC, HCFN with spindle cells; FA, follicular adenoma. The differences among groups were statistically significant. The results are expressed as mean ± SD. *P < 0.05; **P < 0.01
留言 (0)