
記住我
To determine the genome-wide occupancy patterns of PDS5A and PDS5B, chromatin immunoprecipitation followed by high-throughput sequencing (ChIP-seq) was performed in mouse embryonic stem cells (mESCs), utilizing a spike-in for normalization (Additional file 1: Table S1). PDS5A and PDS5B displayed similar binding profiles across the genome and had a similar number of peaks, with 22,389 PDS5A peaks and 27,163 PDS5B peaks identified (Fig. 1A, B, Additional file 2: Fig. S1A, B). PDS5A and PDS5B signal showed strong overlap with signal for the core cohesin subunit, RAD21, and CTCF. PDS5A and PDS5B peaks showed strong overlap with CTCF sites and relatively little overlap with enhancers or promoters (Fig. 1C). A union peak list of all PDS5A peaks and all PDS5B peaks (33,063) was subjected to k-means clustering and showed that sites of strong PDS5A signal also display strong signal for PDS5B, RAD21, and CTCF (Fig. 1D). Though PDS5A and PDS5B localized to a shared set of genomic sites in a population of cells, it was not clear whether they co-occupied a single site at the same time. Co-immunoprecipitation (coIP) experiments revealed that immunoprecipitation of PDS5A was able to co-purify RAD21 and PDS5B under low stringency, uncrosslinked conditions (Fig. 1E). However, immunoprecipitation of PDS5B only co-purified the core cohesin subunit RAD21 and not PDS5A. When these coIPs were performed under high stringency (high salt and detergent), uncrosslinked conditions, the interaction between PDS5A and PDS5B was no longer detectable, yet the interaction between PDS5A and the core cohesin subunit RAD21 remained intact. Interestingly, under high stringency conditions PDS5B showed decreased interaction with the core cohesin complex, suggesting that it is more weakly associated with the cohesin ring than PDS5A. These results indicate that individual cohesin complex molecules contain one of the two mutually exclusive PDS5 subunits. While under low stringency conditions it is possible to detect weak interactions between PDS5A and PDS5B, this likely reflects the weak interactions that can occur between two individual variant cohesin complexes (a cohesin–PDS5A complex interacting with a cohesin–PDS5B complex). Together, these results suggest that while PDS5A and PDS5B occupy many shared sites across the genome, they participate in distinct cohesin complex molecules and are not part of a stable higher order structure of multiple cohesin molecules.
Fig. 1
PDS5A and PDS5B localize to shared sites across the mESC genome. A Genome browser tracks of PDS5A, PDS5B, RAD21, and CTCF ChIP-seq signal near the promoter of Sox2 in WT mESCs (Z-score normalized). B Average signal plots of PDS5A and PDS5B ChIP-seq signal at all PDS5A peaks and all PDS5B peaks (Z-score normalized). C Number of PDS5A and PDS5B peaks overlapping relevant functional elements across the genome: CTCF sites, enhancers, promoters, or other (none of the above). D Clustered heatmaps of PDS5A, PDS5B, RAD21, and CTCF ChIP-seq signal at a union list of PDS5A and PDS5B peaks, ordered by RAD21 signal (k-means = 3) (Z-score normalized). E Western blot analysis following co-immunoprecipitation of IgG (negative control), PDS5A, PDS5B, and RAD21 in WT nuclear lysates, under low and high stringency conditions
Loss of one PDS5 subunit does not impact localization of cohesin, nor the other PDS5 subunitTo investigate the individual roles of PDS5A and PDS5B in cohesin biology, CRISPR/Cas9 genome editing was used to generate two independent knockout mESC lines for each gene: Pds5a−/− rep 1, Pds5a−/− rep 2, Pds5b−/− rep 1, and Pds5b−/− rep 2 mESCs (Additional file 2: Fig. S2A). Notably, PDS5A protein was undetectable in Pds5a−/− mESCs and PDS5B protein was undetectable in Pds5b −/− mESCs, and, the levels of other cohesin subunits were not altered (Fig. 2A). To determine if one PDS5 subunit compensates for the loss of the other PDS5 subunit, ChIP-seq was performed, with a spike-in for normalization, for PDS5A in wildtype (WT) and Pds5b−/− mESCs, and for PDS5B in WT and Pds5a −/− mESCs. Importantly, PDS5A and PDS5B immunoprecipitation efficiencies in WT and knockout mESCs were similar for all replicates (Additional file 2: Fig. S2B, C). The PDS5A binding profile was similar in WT and Pds5b−/− mESCs (with 22,389 and 22,022 peaks identified, respectively), and the binding profile of PDS5B was very similar in WT and Pds5a−/− mESCs (with 27,163 and 27,088 peaks identified, respectively) (Fig. 2B, Additional file 2: Fig. S2D). Analysis of relative signal was performed with DiffBind (which measures quantitative changes at binding sites shared by two conditions) [44], and revealed a small percentage of sites with differential ChIP-seq signal for PDS5A in Pds5b−/− mESCs relative to WT (2.0%), and PDS5B in Pds5a−/− mESCs relative to WT (11.9%) (Fig. 2C). At CTCF sites, enhancers, and promoters, PDS5A levels were largely unaltered by loss of PDS5B, and PDS5B levels were largely unaltered by loss of PDS5A (Fig. 2D). This result, along with the small percentages of differential binding across the genome, indicates that the PDS5 proteins do not compensate for one another. Following the chronic loss of one PDS5 subunit, there is not a major redistribution of the remaining PDS5 subunit to new genomic sites, nor altered levels of the remaining PDS5 subunit at conserved binding sites.
Fig. 2
Loss of a PDS5 protein does not cause mislocalization of the other PDS5 protein or the cohesin complex. A Western blot analysis of cohesin complex subunits in WT, Pds5a−/−, and Pds5b−/− mESC nuclear lysates. B Genome browser tracks of PDS5A ChIP-seq signal in WT and Pds5b−/− mESCs and PDS5B signal in WT and Pds5a−/− mESCs at the Sox17 gene locus. C MA plots showing differential enrichment of PDS5A signal between WT and Pds5b−/− mESCs at conserved binding sites, as well as differential enrichment of PDS5B signal between WT and Pds5a−/− mESCs at conserved binding sites. D Average signal plots of PDS5A ChIP-seq signal in WT and Pds5b−/− mESCs, as well as PDS5B signal in WT and Pds5a−/− mESCs, at CTCF sites, enhancers, and promoters. E Genome browser tracks of RAD21 ChIP-seq signal in WT, Pds5a−/−, and Pds5b−/− mESCs at the Klf4 gene locus. F MA plots showing differential enrichment of RAD21 signal between WT and Pds5a−/− mESCs at conserved binding sites, as well between WT and Pds5b−/− mESCs at conserved binding sites. G Average signal plots of RAD21 ChIP-seq signal in WT, Pds5a−/−, and Pds5b−/− mESCs at CTCF sites, enhancers, and promoters. H Genome browser tracks of RAD21 ChIP-seq signal in Pds5a−/− siGLO and Pds5a−/− siPds5b mESCs at the Sox2 gene locus. I Heatmaps of RAD21 ChIP-seq signal in Pds5a−/− siGLO and Pds5a−/− siPds5b mESCs at a union peak list of all RAD21 peaks in both conditions. J Average signal plots of RAD21 ChIP-seq signal in Pds5a−/− siGLO and Pds5a−/− siPds5b mESCs at CTCF sites, enhancers, and promoters. K MA plot showing differential RAD21 ChIP-seq signal between Pds5a−/− siPds5b and Pds5a−/− siGLO mESCs at conserved binding sites
While the localization patterns of PDS5A and PDS5B were largely insensitive to loss of one another, it remained unclear if localization of the core cohesin complex was also insensitive to loss of either PDS5 subunit. To address this, ChIP-seq for RAD21 in WT, Pds5a−/−, and Pds5b−/− mESCs was performed, and notably, similar ChIP efficiencies were observed for all replicates (Additional file 2: Fig. S2E). The results revealed similar binding profiles and peak numbers for RAD21 in WT, Pds5a−/−, and Pds5b−/− mESCs (33,665, 35,981, and 31,595 peaks, respectively) (Fig. 2E, Additional file 2: Fig. S2F). Consistent with this result, DiffBind analysis detected relatively few sites of differential RAD21 signal in Pds5a−/− or Pds5b−/− mESCs relative to WT (13.4% and 3.8%, respectively), indicating that levels of the core cohesin complex across the genome display minor changes following loss of either PDS5A or PDS5B (Fig. 2F). RAD21 signal at CTCF sites, enhancers, and promoters was also strikingly similar across all three cell lines (Fig. 2G). These results indicate that PDS5A and PDS5B subunits are not specificity factors that dictate where cohesin localizes on the genome and that cohesin complexes lacking PDS5 subunits are still distributed to their normal genomic sites. Furthermore, there were no ectopic PDS5 binding sites nor ectopic RAD21 binding sites observed in cells lacking a single PDS5 protein, consistent with the model that PDS5 subunits are mostly in complex with the core cohesin members and do not operate independently of the core complex.
Dual loss of PDS5A and PDS5B does not alter cohesin localization or levels on the genomeTo investigate whether simultaneous loss of both PDS5A and PDS5B impacts cohesin localization on chromatin, siRNA knockdown of PDS5B was performed in Pds5a−/− mESCs. As controls, siPds5b and siGLO transfections were also performed in WT mESCs. Upon siRNA treatment in Pds5a−/− mESCs, PDS5B protein levels were depleted by 95%, relative to levels in siGLO control treated Pds5a−/− mESCs (Additional file 2: Fig. S2G). RAD21 ChIP-seq was performed in the four siRNA conditions, employing a spike-in for normalization (Fig. 2H, Additional file 2: Fig. S2H, I). Knockdown of PDS5B in either WT or Pds5a−/− mESCs did not alter cohesin localization at a union list of RAD21 peaks identified in either condition (Fig. 2I, Additional file 2: Fig. S2J). The levels of cohesin at CTCF sites, enhancers, and promoters in the siPds5b treated cells were unchanged, compared to controls (Fig. 2J, Additional file 2: Fig. S2K). Depletion of PDS5B caused a significant change in RAD21 levels at 21% of cohesin binding sites in Pds5a−/− mESCs, which was similar to the effect of depletion of PDS5B in WT mESCs (20.4% of sites displayed differential signal), suggesting that acute loss of PDS5B in WT cells or dual loss of both PDS5B and PDS5A caused similar, minor changes in cohesin levels at conserved binding sites (Fig. 2K, Additional file 2: Fig. S2L). These results show that cohesin localizes normally in the absence of PDS5 proteins, suggesting that PDS5A and PDS5B are not specificity factors that dictate the sites of cohesin binding on the genome.
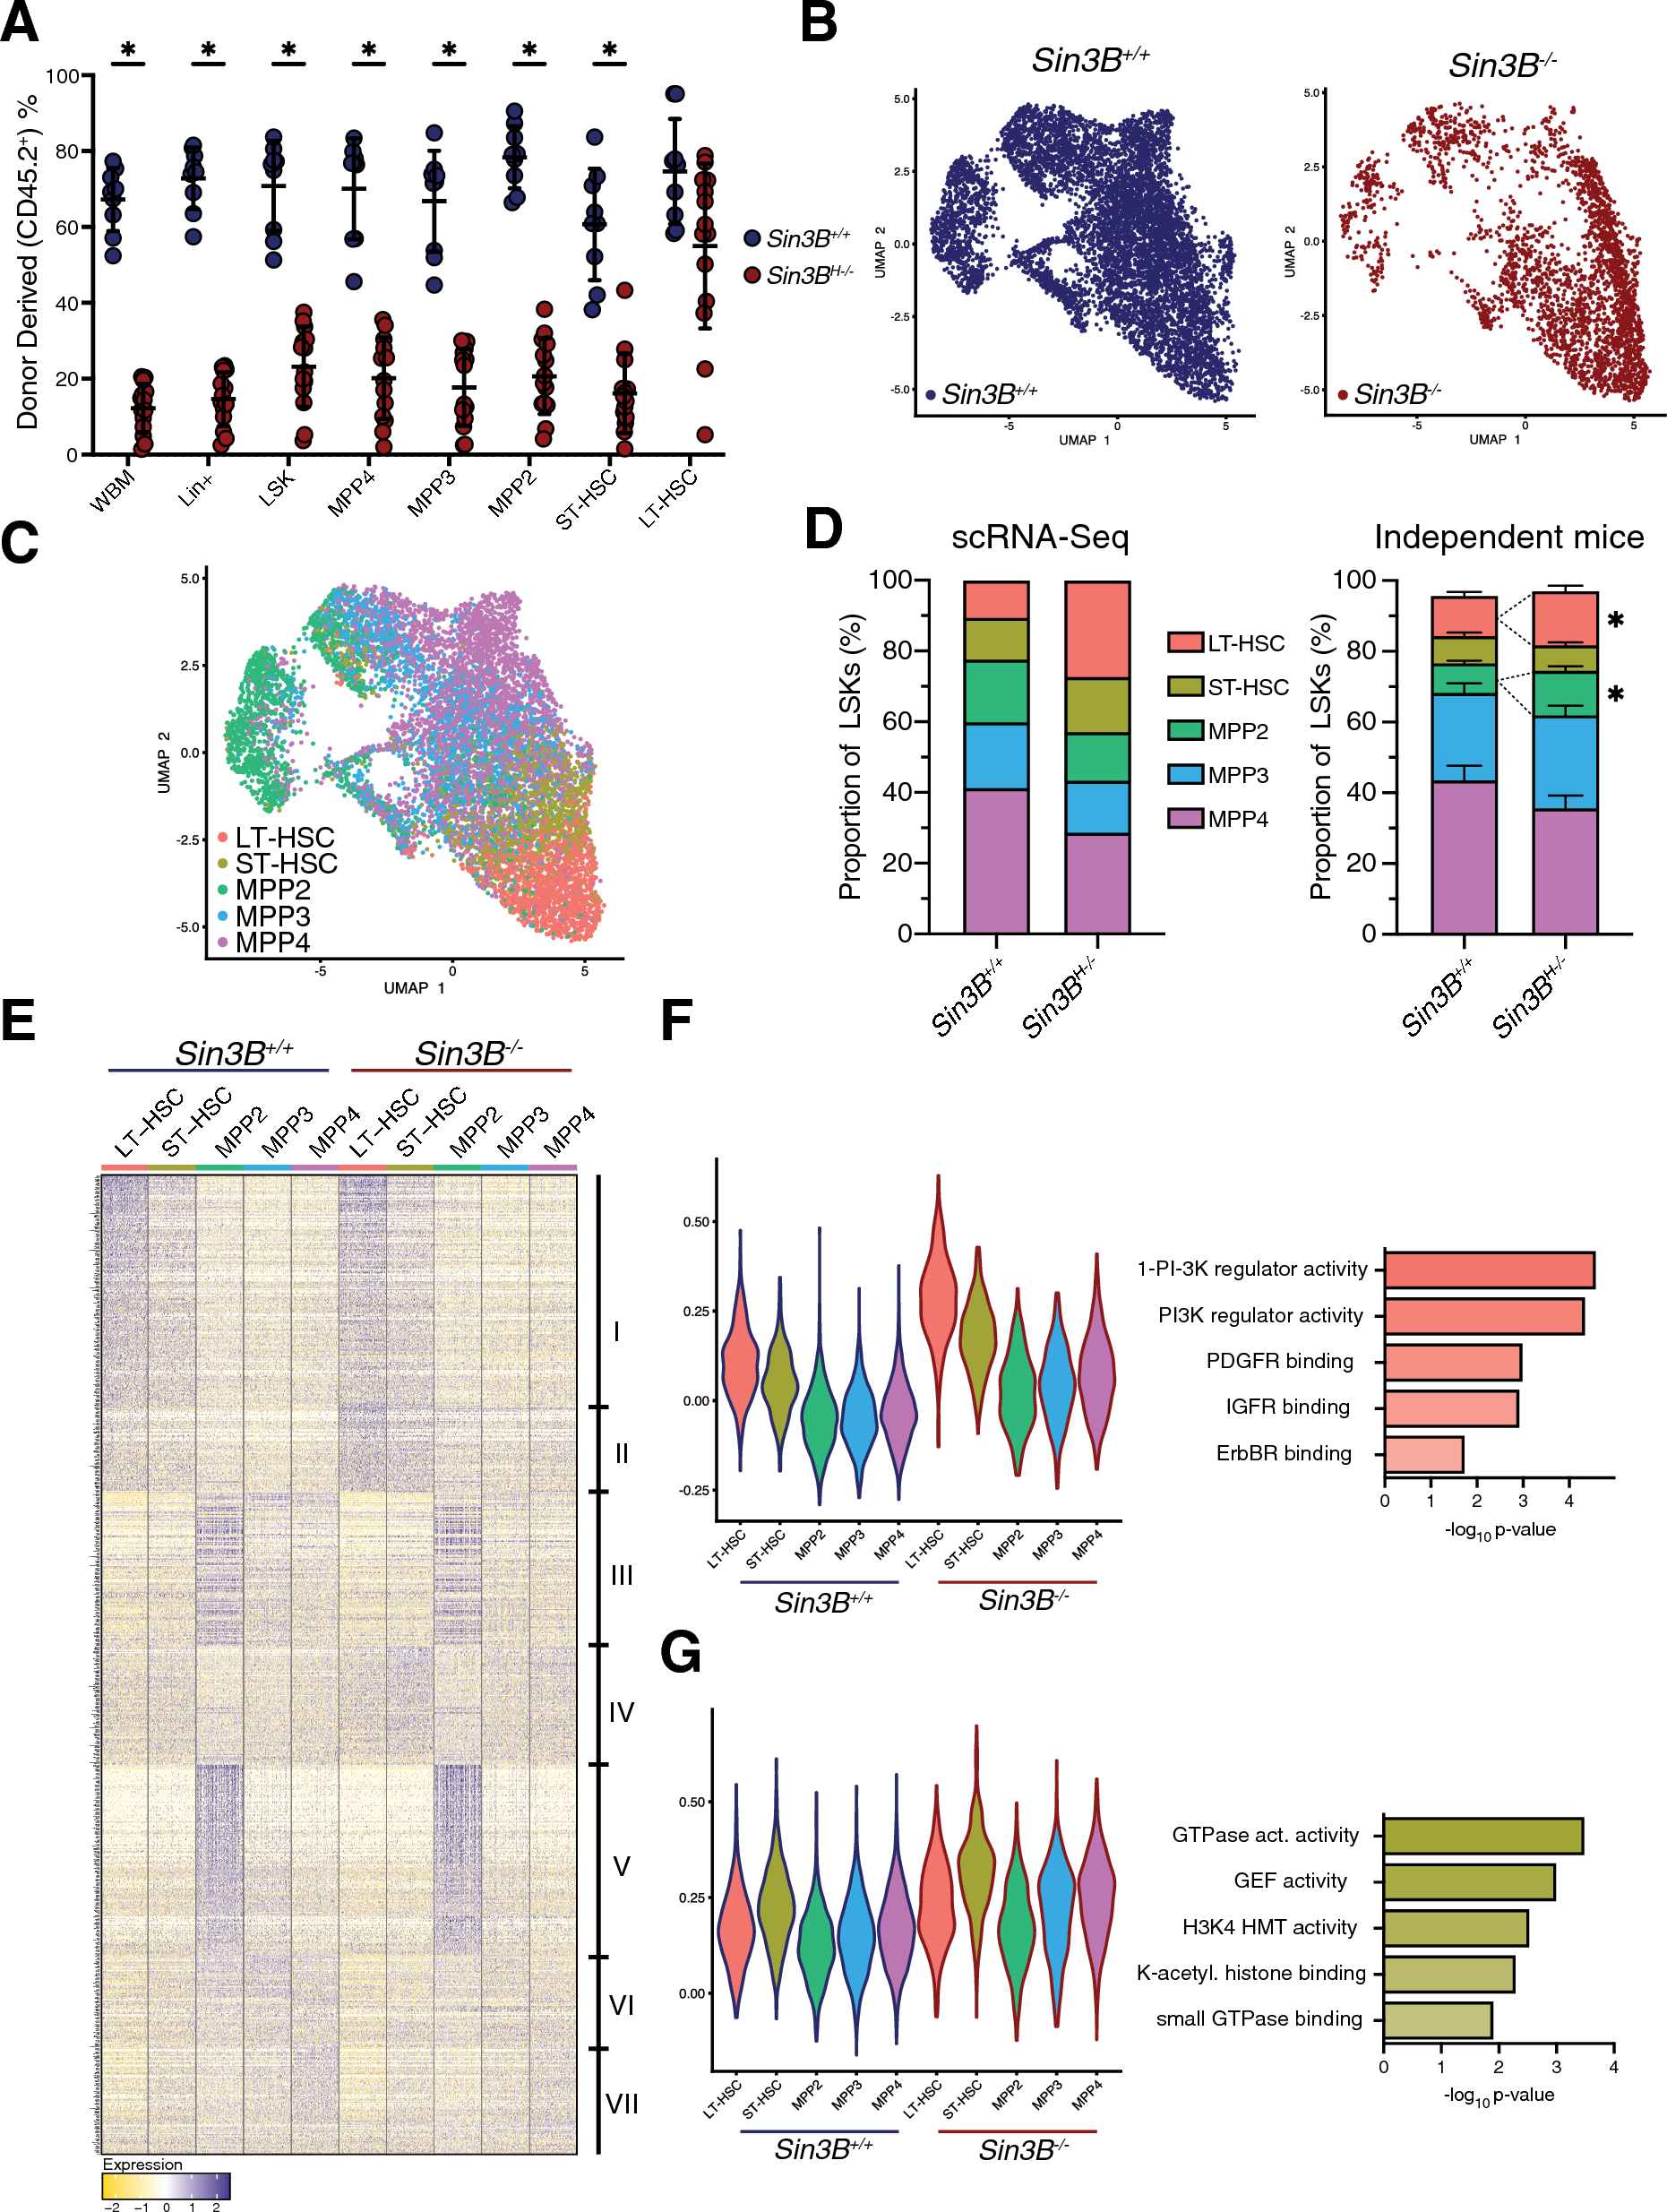
PDS5A and PDS5B have both overlapping and distinct effects on gene expressionWhether PDS5 subunits play a role in regulating gene expression is unclear. To investigate this, RNA-seq was performed in WT, Pds5a−/−, and Pds5b−/− mESCs and differential gene expression analysis was performed using DESeq2 (padj < 0.01) [45]. Pds5a−/− mESCs had 5,503 differentially expressed genes (DEGs) compared to WT mESCs, and Pds5b−/− mESCs had 6,237 DEGs compared to WT mESCs (Additional file 1: Table S1, Additional file 2: Fig. S3A, Additional file 3: Table S2). An overlap of these DEG lists revealed 2,866 genes that were misexpressed upon loss of either PDS5A or PDS5B (Common), while 2,637 genes were misexpressed only in Pds5a−/− mESCs and 3,371 genes were misexpressed only in Pds5b−/− mESCs (Fig. 3A). Changes in gene expression of all DEGs in either Pds5a−/− mESCs or Pds5b−/− mESCs were weakly positively correlated (R2 = 0.359); however, there was a strong correlation at the 2,866 Common DEGs (R2 = 0.620) (Fig. 3B, Additional file 2: Fig. S3B). A combined list of all DEGs in Pds5a−/− and Pds5b−/− mESCs (8,874 genes) revealed similar patterns of log2 fold change in expression for both genotypes (Fig. 3C). Importantly, both PDS5A and PDS5B occupied the promoters of these genes and the relative ChIP-seq signal for PDS5A and PDS5B did not change at these promoters in the reciprocal knockout cell lines compared to WT (Fig. 3C). Gene expression within Super-enhancer Domains (SDs) and Polycomb Domains (PDs) was examined, since DNA loop structures at these domains are known to contain cell identity genes regulated by super-enhancers or repressed by Polycomb, and as such these genes are often sensitive to loss of transcriptional insulation [46]. Expression of genes within PDs significantly increased in both Pds5a−/− and Pds5b−/− mESCs (p < 0.01), while expression of genes within SDs did not change (Fig. 3D). To examine whether loss of PDS5A or PDS5B impacted cellular identity, the expression of pluripotency, ectoderm, and endoderm genes was examined. Pds5a−/− and Pds5b−/− mESCs displayed significant decreases in expression of the pluripotency genes Pou5f1 (OCT4) and Nanog, as well as increased expression of the ectodermal gene Pax6, consistent with altered stem cell state (Fig. 3E). PDS5A and PDS5B protein abundance is highly similar across a wide variety of cell lines and tissues [47], and while PDS5A transcript levels are higher than PDS5B in WT mESCs, loss of one of the PDS5 subunits did not significantly change the transcript level of the remaining PDS5 subunit (Fig. 2A, Additional file 2: Figure S3C–E).
Fig. 3
PDS5A and PDS5B display partially overlapping and distinct effects on gene expression. A Overlap of differentially expressed genes (DEGs) in Pds5a−/− and Pds5b−/− mESCs relative to WT mESCs. All cells treated with siGLO as a transfection control. B Correlation plot of log2 fold change in expression of Common DEGs (2866) in Pds5a−/− and Pds5b−/− mESCs. Axes cropped, removing one outlier. C Heatmap of log2 fold change in expression for all DEGs in both Pds5a−/− and Pds5b−/− mESCs. ChIP-seq signal of PDS5A in WT and Pds5b−/− mESCs and PDS5B signal in WT and Pds5a−/− mESCs is shown at the promoters of these DEGs. D Violin plot of log2 fold change in expression for all DEGs, those within Super-enhancer Domains, and those within Polycomb Domains in Pds5a−/− and Pds5b−/− mESCs. Significance was determined using a Kruskal–Wallis test followed by Dunn’s multiple comparisons test. Asterisks indicate significant differences between groups (** p < 0.01, **** p < 0.0001). E Bar graphs of log2 fold change in expression of pluripotency genes (Pou5f1, Sox2, Nanog), ectodermal lineage genes (Pax6 and Nestin), and endodermal lineage genes (Gata6 and Sox17) in Pds5a−/− and Pds5b−/− mESCs, relative to WT mESCs. Asterisks indicate significant differences from WT determined using DESeq2 (padj < 0.01). F Overlap of differentially expressed genes in Pds5a−/− siGLO, Pds5b−/− siGLO, and Pds5a−/− siPds5b mESCs. Common and Redundant gene classes are highlighted. G Clustered heatmap of log2 fold change in expression for a combined list of DEGs in WT siPds5b, Pds5a−/− siGLO, and Pds5a−/− siPds5b mESCs all relative to WT siGLO mESCs. H Gene Ontology (GO) analysis for biological processes correlated with DEGs that are Pds5a−/− specific, Pds5b−/− specific, Common, or Redundant upon loss of PDS5 proteins. I Average signal plots of PDS5A, PDS5B, and RAD21 ChIP-seq signal in WT (solid line) and knockout (dotted) mESCs at Pds5a−/− specific, Pds5b−/− specific, Common, or Redundant DEG promoters (Z-score normalized). J Percentages of promoters in Pds5a−/− specific, Pds5b−/− specific, Common, Redundant, or Non-DEG gene classes that overlap with WT cohesin ChIA–PET high-confidence interaction anchors [46]
Redundant roles for PDS5A and PDS5B in expression of a set of genesTo further investigate potential overlapping roles of PDS5A and PDS5B in regulating gene expression, RNA-seq was performed in Pds5a−/− siPds5b mESCs and three control conditions. Knockdown of PDS5B in Pds5a−/− mESCs resulted in a large number of DEGs relative to WT siGLO treated mESCs, while PDS5B knockdown in WT mESCs caused virtually no genes to change in expression (8,069 versus 16, respectively) (Additional file 2: Figure S3F). An overlap of DEGs in Pds5a−/− siPds5b mESCs with those in Pds5a−/− siGLO and Pds5b−/− siGLO mESCs revealed a class of genes, where PDS5A and PDS5B act redundantly (2,165 genes) (Fig. 3F). In addition, this analysis showed that dual depletion of both PDS5 subunits created more DEGs than either single perturbation condition. Genes that were considered differentially expressed in any condition compared to the WT siGLO condition were further analyzed. The log2 fold change in gene expression was stronger overall in the dual depletion condition than either single condition (Fig. 3G). Similar to both single knockout lines, dual depletion of both PDS5 subunits caused significant upregulation of genes within PDs (p < 0.0001); however, dual depletion also led to a significant decrease in expression of genes within SDs, which was not observed in Pds5a−/− or Pds5b−/− mESCs (p < 0.0001) (Additional file 2: Figure S3G). Changes to pluripotency and ectodermal genes were detected in the Pds5a−/− siPds5b mESCs, with a similar direction of change but a greater fold change than in Pds5a−/− and Pds5b−/− mESCs (Additional file 2: Figure S3H). Gene ontology (GO) analysis revealed strong differences in the biological processes linked to Pds5a−/− specific and Pds5b−/− specific DEGs (Fig. 3H, Additional file 4: Table S3). In general, the biological processes altered in the Common, Redundant, and Pds5a−/− specific classes were similar to one another, while the Pds5b−/− specific class of genes showed a more distinct pattern (Fig. 3H). Overall, the genes at which PDS5A and PDS5B act redundantly are implicated in neuronal differentiation, neuronal generation, and RNA processing. Although some genes were commonly, redundantly, or specifically affected by loss of either PDS5A or PDS5B subunits, there was no specific enrichment for either PDS5A or PDS5B occupancy at the promoters of these four gene classes (Fig. 3I). Furthermore, there were no changes in PDS5A or PDS5B enrichment in Pds5b−/− or Pds5a−/− cells, respectively, compared to WT mESCs, indicating that these gene expression changes may be an indirect effect (Fig. 3I). Notably, promoters of genes differentially expressed in these four gene classes were more likely to be engaged in a long-range interaction (26–42%) than promoters of genes not differentially expressed following PDS5 perturbations (18%) (Fig. 3J) [46]. Taken together, these results reveal that PDS5A and PDS5B act redundantly to preserve proper expression of a subset of genes while also displaying distinct effects on other subsets of genes.
PDS5 subunits and STAG subunits localize to the same sites but have partially distinct effects on gene expressionThe discovery that PDS5A and PDS5B have both distinct and overlapping effects on gene expression despite their shared genome-wide occupancy is similar to previous results reported for the other set of mutually exclusive cohesin subunits, STAG1 and STAG2 [12]. However, the relationship between PDS5 proteins and STAG proteins has not yet been directly explored. Therefore, the genome-wide distribution of PDS5A, PDS5B, STAG1, and STAG2 was examined in WT mESCs and revealed a striking overlap of ChIP-seq signal for all four subunits at a union list including all peaks identified in any of the individual data sets (54,213) (Fig. 4A) [12]. Notably, the strongest PDS5 peaks are also the strongest STAG peaks, indicating that the chromatin-bound levels of all four subunits are positively correlated. Co-immunoprecipitation of PDS5A, PDS5B, and RAD21 was performed under both low and high stringency, uncrosslinked conditions, to investigate potential specificity in subunit composition of cohesin complexes; western blotting for STAG1 and STAG2 subunits demonstrated that STAG1 and STAG2 both co-purify with PDS5A and PDS5B subunits (Fig. 4B). This, together with our previous report demonstrating that STAG1 and STAG2 localize to shared genomic locations in distinct complexes, indicates that there is not a selective incorporation of either PDS5A or PDS5B with cohesin–STAG1 or cohesin–STAG2 variant complexes [12]. Rather, cohesin complexes of all possible compositions of STAG1 or STAG2 and PDS5A or PDS5B can exist in the cell. While it remained unclear whether the overlapping distribution of PDS5A/B and STAG1/2 on the genome was dependent on the presence of one another, ChIP–qPCR was performed for PDS5A and PDS5B in mESCs nearly devoid of STAG proteins, as well as ChIP–qPCR for STAG1 and STAG2 in mESCs nearly devoid of PDS5 proteins. ChIP enrichment for PDS5A and PDS5B was determined at individual CTCF binding sites in WT siGLO and Stag2−/− siStag1 mESCs, and revealed no significant changes in PDS5 protein occupancy (Additional file 2: Figure S4A). ChIP enrichment for STAG1 and STAG2 was determined at the same CTCF binding sites in WT siGLO and Pds5a−/− siPds5b mESCs, and revealed modestly decreased levels of STAG1 (p < 0.01), while STAG2 levels showed no change (Additional file 2: Figure S4B). Therefore, PDS5 and STAG protein localization appears to be largely independent of one another.
Fig. 4
PDS5 proteins localize to the same genomic sites as STAG proteins. A Clustered heatmaps of PDS5A, PDS5B, STAG1, STAG2, and RAD21 ChIP-seq signal at a union list of PDS5A, PDS5B, STAG1, and STAG2 peaks, ordered by RAD21 signal (k-means = 2) (Z-score normalized). B Western blot analysis following co-immunoprecipitation of IgG (negative control), PDS5A, PDS5B, and RAD21 in WT nuclear lysates, under low and high stringency conditions. Control blots for this experiment are in Fig. 1E. C Clustered heatmap of log2 fold change in expression for a combined list of DEGs in Pds5a−/− siGLO, Pds5a−/− siStag1, Pds5a−/− siStag2, and Pds5a−/− siPds5b mESCs relative to WT siGLO mESCs. D Violin plot of log2 fold change in expression for all DEGs, those within Super-enhancer Domains, and those within Polycomb Domains for Pds5a−/− siGLO, Pds5a−/− siStag1, Pds5a−/− siStag2, and Pds5a−/− siPds5b mESCs relative to WT siGLO mESCs. Significance was determined using a Kruskal–Wallis test followed by Dunn’s multiple comparisons test. Asterisks indicate significant differences between groups (* p < 0.05, **** p < 0.0001). E Bar graphs of log2 fold change in expression of pluripotency genes (Pou5f1, Sox2, Nanog), ectodermal lineage genes (Pax6 and Nestin), and endodermal lineage genes (Gata6 and Sox17) in Pds5a−/− siGLO, Pds5a−/− siStag1, Pds5a−/− siStag2, and Pds5a−/− siPds5b mESCs. Asterisks indicate significant differences from WT siGLO mESCs determined using DESeq2 (padj < 0.01)
Whereas cohesin binding to the genome is greatly reduced in Stag2−/− siStag1 mESCs [12], PDS5A and PDS5B showed no significant decreases at CTCF binding sites, suggesting that PDS5 proteins can interact with CTCF independent of the core cohesin complex [19, 20]. To directly test this hypothesis, ChIP–qPCR was performed for PDS5A and PDS5B at CTCF binding sites in WT siGLO and WT siSMC3 mESCs. While no significant differences in enrichment were observed for PDS5A, PDS5B was significantly decreased at all four CTCF sites following cohesin depletion (Additional file 2: Figure S4C). This supports a model, where PDS5A, but not PDS5B, is able to interact with CTCF independent of the core cohesin complex.
Though no preferential physical interactions were detected for PDS5A/B and STAG1/2 subunits by co-immunoprecipitation, suggesting that cohesin complexes of all possible subunit compositions can exist in the cell, it is not known if the PDS5 subunits and STAG subunits display overlapping effects on gene expression. To explore this possibility, RNA-seq was performed following knockdown of STAG1 or STAG2 in Pds5a−/− mESCs (Additional file 3: Table S2). Differential gene expression analysis revealed a similar number of DEGs in Pds5a−/− siStag1 and Pds5a−/− siStag2 mESCs to that seen in Pds5a−/− siPds5b mESCs (6,024, 7,856, and 8,069, respectively) (Additional file 2: Figure S4D–E). Notably, the number of DEGs in Pds5a−/− siStag2 and Pds5a−/− siPds5b mESCs was similar and increased relative to Pds5a−/− mESCs (5,503) and Pds5b−/− mESCs (6,237). Genes that were differentially expressed in any of the four conditions relative to WT siGLO (Pds5a−/− siGLO, Pds5a−/− siStag1, Pds5a−/− siStag2, and Pds5a−/− siPds5b) were identified and merged into a union list (11,031 genes). Examination of the log2 fold change values of DEGs in this list revealed minimal differences in cells, where STAG1, STAG2, or PDS5B were knocked down in the Pds5a−/− background relative to the WT siGLO control treated cells (Fig. 4C). Furthermore, there was a strong overlap between the DEGs identified in Pds5a−/− siPds5b, with the DEGs identified in Pds5a−/− siStag1 and Pds5a−/− siStag2 mESCs (Additional file 2: Figure S4E). The expression of genes within SDs was not affected in Pds5a−/− siStag1 mESCs, but was significantly decreased in Pds5a−/− siStag2 mESCs, consistent with previous findings that loss of STAG2, but not STAG1, affects expression of SD genes in the WT background (Fig. 4D) [12]. Depletion of STAG1 or STAG2 also caused changes in expression of pluripotency and ectodermal genes similarly, in both direction and magnitude, to depletion of PDS5B in Pds5a−/− mESCs (Fig. 4E). To better examine the effect of individual knockdowns on gene expression in the Pds5a−/− siGLO background, differentially expressed genes relative to Pds5a−/− siGLO mESCs were identified (rather than relative to WT siGLO mESCs). This analysis revealed relatively fewer differentially expressed genes (380 in Pds5a−/− siStag1, 2,698 in Pds5a−/− siStag2, and 3,485 in Pds5a−/− siPds5b mESCs) than when compared to the WT siGLO background, demonstrating that depletion of STAG1 or STAG2 in a Pds5a−/− background caused transcriptional changes similar to depletion of PDS5B (Additional file 2: Figure S4F, G).
Though knockdown of a single STAG subunit in a PDS5 knockout background resembled dual loss of both PDS5A and PDS5B, about half of all DEGs identified in Pds5a−/− siPds5b overlapped with those in Stag2−/− siStag1 mESCs (Additional file 2: Figure S4H) [12]. Furthermore, there was even less overlap of commonly or redundantly regulated genes following dual loss of both PDS5 subunits versus following loss of both STAG subunits (Additional file 2: Figure S4I) [12]. There was also little overlap of the biological processes affected specifically by dual loss of PDS5 subunits or dual loss of STAG subunits (Additional file 2: Figure S4J, Additional file 4: Table S3). Interestingly, the genes commonly regulated by both dual depletion conditions that change expression in opposite directions do not produce any enrichment for a particular biological process. In conclusion, the PDS5A/B and STAG1/2 subunits show remarkable overlap in their localization pattern on the genome, yet dual loss of PDS5A and PDS5B, or dual loss of STAG1 and STAG2, impacted the expression of genes involved in distinct biological processes.
PDS5 subunits and STAG subunits have differential effects on SMC3 acetylation and levels of cohesin on chromatinGiven the many changes in gene expression following loss of PDS5A, PDS5B, STAG1, or STAG2 subunits, we next investigated various properties of the cohesin complex and its interactions with regulatory proteins. Initially, we sought to measure the post-translational acetylation of SMC3, at residues K105 and K106, associated with sister chromatid cohesion and stable cohesin binding during interphase [32,33,34,35,36,37]. Utilizing combinations of siRNA and knockout cell lines, 7 conditions were generated representing both acute (WT siPds5a + siPds5b and WT siStag1 + siStag2) and chronic (Pds5a−/− siPds5b and Stag2−/− siStag1) depletion of cohesin subunits (Additional file 2: Figure S5A). An SMC3 antibody and an SMC3ac-specific antibody (targeting SMC3 K105ac and K106ac) were used to detect levels of the post-translationally modified SMC3 and total SMC3 in nuclear extracts from the 7 cellular conditions. The results revealed decreased SMC3ac levels in all conditions compared to WT siGLO, with the strongest decreases observed in the dual depletion conditions: Pds5a−/− siPds5b and Stag2−/− siStag1 (Fig. 5A, Additional file 2: Figure S5B). Importantly, total SMC3 levels were unchanged across the 7 conditions and both antibodies were shown to be specific (Fig. 5A, Additional file 2: Figure S5C, D). The specific reduction in SMC3ac levels in Pds5a−/− siPds5b mESCs compared to control mESCs was also observed following an IP of SMC3 in nuclear extracts (Additional file 2: Figure S5E). To address whether this loss of SMC3ac was due to a change in cell cycle distribution, the percentage of cells in G1, S, and G2/M was measured in dual depletion conditions as well as single knockdown controls. There were no significant differences in cell cycle distribution detected for any mutant condition relative to WT siGLO mESCs (Fig. 5B, Additional file 2: Figure S5F). Notably, Pds5a−/− siPds5b mESCs showed a decrease in proliferation rate and Stag2−/− siStag1 mESCs showed a strong proliferation defect and increased length of time in each cell cycle phase (Additional file 2: Figure S5G, H). These results indicate that reduced SMC3ac levels upon loss of PDS5 or STAG proteins are not due to a change in the proportion of cells in S phase or G2/M.
Fig. 5
PDS5 proteins and STAG proteins have differential effects on SMC3ac levels and chromatin bound cohesin. A Western blot analysis of nuclear lysates from seven siRNA conditions in mESCs. Abbreviations included for PDS5A (P5A), PDS5B (P5B), STAG1 (SA1), and STAG2 (SA2). B Percentage of cells in each cell cycle phase, n = 3. A 2-tailed unpaired t test was used to determine significance. No significance was found between any mutant and WT condition
留言 (0)