
記住我
Osteopenia and osteoporosis are common in patients with ankylosing spondylitis (AS).1 The prevalence of osteoporosis was about 25% in AS patients with longer disease duration (>10 years)2 and 13% in femoral neck and 16% in lumbar vertebra in AS patients with shorter disease duration (<10 years).3
AS patients are prone to lumbar fractures and kyphosis caused by fractures. In addition, pathologic new bone formation, such as ligament osteophyte, ligament ossification, and joint fusion, can cause measurement error of bone mineral density (BMD) in lumbar. After 2-year follow-up of AS patients not treated with specific medications, BMD of femoral neck and total femur was found to be decreased significantly, while BMD of lumbar spine (AP) was increased by 3.4%.4
Dual-energy X-ray absorptiometry (DEXA) of anteroposterior lumbar spine is not suitable for BMD measurement in AS patients.5 As the pathologic osteogenesis interferes with the assessment of BMD at lumbar spine and femoral neck (i.e., the most commonly involved sites of AS), local DXA measurement may fail to detect real changes in BMD.
By comparing whole-body BMD measured by whole-body DXA with local BMD (lumbar spine and femoral neck), this study aims to investigate the correlation between BMD and clinical parameters, including disease duration, age of onset, disease activity, and joint activity, and to explore the risk factors of osteoporosis that would be crucial for early detection of secondary osteoporosis due to AS.
The mechanism of BMD abnormalities caused by AS is not clear. Loss of bone mass was reported to be associated with RANKL-RANK-OPG system consisting of receptor activator of NF-κB ligand (RANKL), receptor activator of NF-κB (RANK), and osteoprotegerin (OPG).6 In addition, a variety of cytokines are known to regulate bone metabolism, such as transforming growth factor-β (TGF-β), bone morphogenetic protein (BMP), Dickkopf-1 (DKK-1), matrix metallopeptidase-3 (MMP-3), Osteopontin (OPN), and platelet-derived growth factor-BB (PDGF-BB). These signaling pathways can be regulated by microRNA. MicroRNA-218 has also been indicated to promote the differentiation and maturation of osteoblasts associated with bone formation.
This study will focus on bone metabolism-related factors and lymphocyte membrane-bound RANKL in AS patients, as well as their correlation with BMD. In addition, the expression of microRNA-218 in PBMCs and its correlation with bone mass and clinical characteristics of AS patients have also been investigated.
At present, the treatment for secondary osteoporosis due to AS is still controversial. Inflammation in AS can cause bone metabolism disorders and bone loss. It remains still unclear whether secondary osteoporosis due to AS should be treated with anti-osteoporosis drugs, such as bisphosphates, calcitonin, and parathyroid hormone analogues in addition to the treatment of primary disease.
In our study, 19 AS patients receiving TNF-α inhibitors were followed up for 6 months. The post-treatment change in BMD at different sites was observed, and the effect of TNF-α inhibitor treatment on BMD and bone metabolism-related factors were investigated.
2 MATERIALS AND METHODS 2.1 Patient enrollment and clinical data collectionA total of 89 AS patients (18–65 years old for male; 18–50 years old for premenopausal female) who met the modified New York criteria for AS (1984) were enrolled in the study conducted in Department of Rheumatology and Immunology of Huashan hospital, Fudan University. Informed consent was obtained from all the participants and this study was approved by the Ethics Committee of Huashan hospital, Fudan University (KY2018-469).
Patient information was collected, including gender, birth date, height, weight, time of symptom onset, time of diagnosis, previous drug use, current drug use, smoking history, alcohol consumption history, surgery history, trauma history, etc.
The laboratory results were collected for each patient, including erythrocyte sedimentation rate (ESR) and C-reactive protein (CRP).
Disease activity score was evaluated for each patient, including overall pain visual analogue scale (VAS) score, night pain VAS score, overall disease activity VAS score, Bath ankylosing spondylitis disease activity index (BASDAI), Bath ankylosing spondylitis functional index (BASFI), and health evaluation questionnaire (HAQ).
Physical examinations were performed for each patient, including swelling joint count, tenderness joint count, thoracic dilatation score, Bath ankylosing spondylitis metrology index (BASMI), and Maastricht ankylosing spondylitis entheses score (MASES).
BMDs of the anteroposterior lumbar spine (L2-L4), left femoral neck, and whole body were measured for each patient on the same day by DXA (NORLAND). T-scores = (measured score - peak BMD of normal Chinese youths of the same sex)/standard deviation of peak BMD of normal Chinese youths of the same sex. T-score ≤ −2.5 was defined as osteoporosis, −2.5<T-score <−1.0 was defined as osteopenia, −1.0 ≤ T-score ≤1.0 was defined as normal, and T-score >1 was defined as high BMD.
Hip involvement is a poor prognostic factor for AS. In this study, the difference in BMD between patients with abnormal and normal intermalleolar distance was analyzed according to the presence of hip involvement (namely, intermalleolar distance less than 100 cm).
2.2 Flow cytometryFour milliliters of whole blood was collected from 23 AS patients and 15 healthy subjects. PBMCs were extracted according to the protocol. Anti-RANKL monoclonal antibody solution was added, followed by the detection via flow cytometer. Statistical analysis was conducted using Flow Jo Ⅹ software.
Bone metabolism-related factors were detected using protein chips.
Fifty plasma samples were separated and extracted the whole blood samples. Protein chip (QAH-BMA-2–4, Human Bone Metabolism Array Q2-50 samples, Raybiotech) was used to detect bone metabolism-related factors, including BMP-2, BMP-6, BMP-7, DKK-1, MMP-3, OPG, OPN, PDGF-BB, TGF-β3, and RANKL. RANKL/OPG was calculated.
2.3 Detection of microRNA-218The extraction of miRNA from PBMCs was conducted according to the instruction of miRcute serum/plasma miRNA isolation kit (TIANGEN BIOTECH (BEIJING) CO., LTD). The first chain of cDNA was synthesized by poly A tailing method according to the instruction of miRcute plus miRNA first-strand cDNA kit (TIANGEN BIOTECH (BEIJING) CO., LTD). Each sample was detected by applying microRNA-218-5p and U6 as primers, and three secondary pores were taken. First-strand cDNA of miRNA was diluted with ddH2O for 10 times and then loaded in 96-well plate filled with 2x miRcute Plus miRNA Premix (with SYBR & ROX), primers, and ddH2O. The plate was placed on ice and then detected in the qPCR amplification apparatus. 2−ΔΔCt was calculated. U6 was used as a reference gene.
2.4 Statistical analysisStatistical analysis was performed using SPSS 19.0 and GraphPad Prism 6.0. Continuous variables were expressed as mean and standard deviation (SD) depending on the normality of distribution. Student's t test, Pearson's correlation analysis, and one-way ANOVA were used to analyze the differences within groups for normal distribution data. Wilcoxon rank sum test and Spearman correlation analysis were used for non-normal distribution data. Differences were considered statistically significant with a two-tailed p value of < 0.05.
3 RESULTS 3.1 Clinical characteristicsA total of 89 AS patients admitted to the department of rheumatology between 2016 and 2017 were included, including 72 men and 17 women (premenopausal) with the mean age of 32.44 ± 8.00 years and disease duration of 7.16 ± 5.045 years (Table 1).
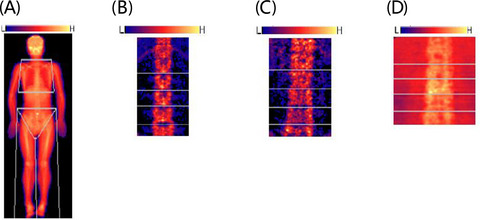
TABLE 1. General information of AS patients NO. Age Disease course Onset age Height Weight Men 72 32.32 ± 8.31 7.11 ± 5.17 24.81 ± 9.14 171.38 ± 6.20 67.73 ± 10.10 Women 17 32.94 ± 6.71 7.32 ± 4.66 24.62 ± 5.93 158.54 ± 6.92 55.48 ± 9.02 Total 89 32.44 ± 8.00 7.16 ± 5.05 24.77 ± 8.57 168.93 ± 8.09 65.39 ± 10.98 3.2 Osteoporosis and osteopenia in AS patientsOut of 86 patients undergoing whole-body BMD measurement, 14 had osteopenia and 72 had normal BMD without osteoporosis or high BMD. Femoral neck BMD was measured in a total of 89 patients, of whom 14 had osteoporosis, 39 had osteopenia, 34 had normal BMD, and 2 had high BMD. Orthotopic lumbar (L2-L4) BMD was measured in a total of 89 patients, of whom 5 had osteoporosis, 26 had osteopenia, 50 had normal BMD, and 8 had high BMD. Fifty-nine patients had osteopenia or osteoporosis in the lumbar vertebrae and femoral neck, while only 23 patients showed normal BMD at both sites (Figure 1A–D, Table 2).

(A) One patient of osteopenia detected by whole-body DXA. (B) One patient of osteoporosis in lumbar vertebrae by DXA showing visible joint space and osteoporosis. (C) one patient of high BMD at lumbar vertebrae by DXA showing visible articular surface fusion.(D) One patient of normal BMD at lumbar vertebrae with clear joint space
TABLE 2. The percentages of osteopenia and osteoporosis in AS patients Gender Lumbar vertebrae BMD Femoral neck BMD Whole-body BMD T ≤ −2.5 −2.5 < T < −1.0 T ≤ −2.5 −2.5 < T < −1.0 T ≤ −2.5 −2.5 < T < −1.0 Men 5 (6.9%) 23 (31.9%) 14 (19.4%) 38 (52.8%) 0 (0%) 10 (14.5%) Women 0 (0%) 3 (17.6%) 0 (0%) 1 (5.9%) 0 (0%) 4 (23.5%) Total 5 (5.6%) 26 (29.2%) 14 (15.7%) 39 (43.8%) 0 (0%) 14 (16.3%) 3.3 Correlation of BMD and disease courseThe patients were divided into short-term group (≤3 years), medium-term group (3–10 years), and long-term group (≥10 years) based on the duration of disease. The inter-group comparison of BMD at three measured regions (femoral neck, lumbar spine, and whole body) showed that medium-term group had lower BMD than short-term group, and long-term group had higher BMD than medium-term group but not higher than short-term group (Figure 2A). There was significant difference (p < 0.05) in femoral neck BMD among the three groups (Figure 2B).

(A) BMD changes in different sites of patients with different disease course. (B) Comparison of BMD of left femoral neck in different disease course groups. (C) Comparison of BMD of anteroposterior lumbar spine (L2–L4) in different disease course groups. (D) Comparison of BMD of whole body in different disease course groups. (E) Correlation between BMD of left femoral neck and BASMI. (F) Correlation between BMD of whole body and BASMI. (G) Comparison of whole-body BMD between patients with or without hip involvement. (H) Comparison of BMD of left femoral neck between patients with or without hip involvement
3.4 Correlation of BMD and onset ageThe patients were divided into two groups according to the onset age: group ≤20 years and group >20 years. The correlation between BMD and age of onset was statistically analyzed. By comparing BMD at three measured regions between the two groups, it was found that patients with onset age ≤20 years old had significantly lower BMD than the other group (p < 0.05) (Table 3).
TABLE 3. BMD of each site in different groups of onset age Onset Age Whole-Body BMD Femoral Neck BMD Lumbar Vertebra BMD ≤20 years old 0.93 ± 0.086 0.82 ± 0.125 0.94 ± 0.163 >20 years old 0.97 ± 0.078 0.88 ± 0.126 1.01 ± 0.147 3.5 Correlation of BMD and disease activityErythrocyte sedimentation rate, CRP, and BASDAI were used to evaluate AS disease activity. Pearson's correlation analysis showed a negative correlation between BMD and BASDAI (p < 0.05) but no significant correlation between BMD and ESR and CRP. The femoral neck BMD had negative correlation with CRP (p < 0.05) but no correlation with BASDAI and ESR. There was no significant correlation between lumbar BMD and ESR, CRP, and BASDAI (Table S1).
3.6 Correlation of BMD and joint range of motion (ROM)Bath ankylosing spondylitis metrology index was used to evaluate joint ROM in AS. Linear regression analysis revealed that the BMDs of whole body and femoral neck were negatively correlated with BASMI (p < 0.05) (Table S2, Figure 2E, F).
3.7 Correlation of BMD and Hip InvolvementHip involvement was defined as intermalleolar distance less than 100 cm. Patients were divided into two groups according to the presence or not of hip involvement. Comparison of BMD of the whole body and femoral neck between the two groups revealed significantly higher femoral neck BMD in patients with hip involvement (p < 0.05), but no statistically significant difference in the whole-body BMD was found between the two groups (Figure 2G, H).
3.8 Protein concentration of bone metabolism-related factorsDickkopf-1, PDGF-BB, and RANKL/OPG were significantly increased, while OPN was significantly decreased in AS patients (n = 23) compared with normal controls (n = 15) (p < 0.05). Furthermore, BMP-2, BMP-6, BMP-7, MMP-3, TGFβ3, and RANKL were increased and OPG was decreased in AS patients compared with healthy subjects, without statistical significance (Figure 3A, Table 4).

(A) Protein microarray results of No.10 AS Patient. (B) Flow pattern of lymphocytes. (C) Flow pattern of blank tube in normal bone mass group. (D) Flow pattern of anti-RANKL monoclonal antibody in normal bone mass group. (E) Flow pattern of blank tube in low bone mass group. (F) Flow pattern of anti-RANKL monoclonal antibody in low bone mass group
TABLE 4. Levels of bone metabolism-related factors in AS patients and normal subjects (pg/ml) AS Patients Normal subjects BMP-2 206.87 ± 187.2 121 ± 130.38 BMP-6 364.67 ± 321.78 208.74 ± 237.7 BMP-7 1986.38 ± 2033.82 1093.44 ± 1383.17 DKK-1 1417.1 ± 1016.55 723.89 ± 706.45 MMP-3 17815.96 ± 9321.77 12452.5 ± 5606.57 OPG 2412.33 ± 1451.91 2503.46 ± 1823.06 OPN 19801.56 ± 9786.66 31634.96 ± 13859.63 PDGF-BB 846.55 ± 144.54 629.58 ± 163.7 TGF-β3 49.51 ± 48.33 31.86 ± 45.26 RANKL 21650.88 ± 20942.99 12883.15 ± 16832.66 RANKL/OPG 8.75 ± 4.47 4.39 ± 4.07 3.9 Correlation of bone metabolism-related factors and BMDMatrix metallopeptidase-3 was negatively correlated with whole-body BMD, whole-body T-scores, femoral neck BMD, and femoral neck T-scores. OPG was negatively correlated with T-scores of femoral neck (p < 0.05). However, no significant correlation with BMP-2, BMP-6, BMP-7, DKK-1, OPN, PDGF-BB, TGF-β3, and RANKL was found (Table S3).
3.10 Expression of RANKL in PBMCs of AS patients with or without osteopeniaThe expression of RANKL in lymphocytes of AS patients with osteopenia (n = 4) was higher than that of AS patients with normal bone mass (n = 11) (30.9% vs. 21.0%) (Figure 3B–F).
3.11 Expression of microRNA-218 in AS patients and healthy subjectsThe expression of microRNA-218 in PBMCs of AS patients (n = 40) was lower than that of healthy subjects (n = 13) (Table 5). There was no significant correlation between BMD and microRNA-218 expression in 40 AS patients (Table S4).
TABLE 5. Expression of microRNA-218 in PBMC of AS patients and normal subjects ΔCT ΔΔCT 2^(-ΔΔCT) AS 20.52 ± 2.44 1.86 0.27 Normal subjects 18.65 ± 2.78MicroRNA-218 expression had positive correlation with BASMI (p < 0.05) but no correlation with the duration of disease, age of onset, BASDAI, and ESR (Table S5).
3.12 Effect of anti-inflammatory therapy on BMD and bone metabolism-related factors in ASA total of 20 patients were followed up, including 14 males and 6 females, aged 33.60 ± 9.33 years old, with a disease duration of 8.93 ± 4.72 years. Nineteen patients were treated with TNF-α inhibitors, and one received only non-steroidal anti-inflammatory drugs (NSAIDS).
For 19 patients treated with TNF-α inhibitors, the post-treatment BMD of femoral neck, lumbar spine, and whole body was increased (p < 0.05) (Figure 4A–C).

(A) BMD of left femoral neck before and after treatment with TNF-α inhibitors. (B) BMD of L2-L4 before and after treatment with TNF-α inhibitors. (C) BMD of whole body before and after treatment with TNF-α inhibitors
Only one patient did not receive TNF-α inhibitors, and his BMD of whole body, femoral neck, and lumbar vertebrae was decreased after 6-month follow-up, which was of no statistical significance (Table 6).
TABLE 6. BMD of different sites before and after treatment of NSAIDS Whole body BMD Total T-score Femoral neck BMD Femoral neckT-score Lumbar spine BMD Lumbar spine T-score Baseline 0.9159 −0.82 0.739 −2.62 1.004 −0.62 After 6 months 0.9046 −0.89 0.709 −2.88 0.9633 −0.92Following 6 months of TNF-α inhibitor treatment, 12 patients showed significantly decreased (p < 0.05) BMP-6, DKK-1, RANKL, and RANKL/OPG. In addition, BMP-2, BMP-7, MMP-3, OPN, PDGF-BB, and TGF-β3 were decreased and OPG was increased without statistical significance (Table S6).
4 DISCUSSIONSeveral studies have reported the prevalence of osteoporosis and osteopenia in AS patients. However, they mainly focused on local BMD rather than whole body, especially lumbar vertebra and femoral neck BMD. Our study found that BMD at lumbar vertebra and femoral neck was significantly abnormal in many AS patients. Only 25.8% of the patients had normal BMD at these two regions, while 83.7% showed normal whole-body BMD at baseline, suggesting that the loss of bone mass in AS occurred mainly in inflammation sites. Our study demonstrated an obvious tendency that the BMD of lumbar vertebra, femoral neck, and whole body declined first and then increased slightly with the course of disease, which was consistent with the pathological progression of AS.
Erythrocyte sedimentation rate, CRP, and BASDAI were used to evaluate disease activity in our study. There was a negative correlation between the whole-body BMD and BASDAI (r = 0.263, p = 0.013). The BMD of femoral neck was negatively correlated with CRP (p < 0.05). Previous studies have reported negative correlation between lumbar spine BMD and ESR in AS patients.5 These results suggested that low BMD may be associated with high disease activity and severe inflammation. Correlation analysis between BMD and BASMI index revealed that patients with high BASMI, that is, low ROM, had lower whole-body BMD and femoral neck BMD. A linear correlation was found between BASMI and ESR and CRP (Table S7). Low ROM can be caused by pathologic osteogenesis, joint fusion, or pain due to inflammation.
Younger age of onset is one of the poor prognostic factors for AS. Low BMD is also associated with younger onset age, which may be related with more severe inflammation and bone destruction in younger patients.
Some bone metabolism-related factors of AS patients have been tested in previous studies. M-C. Park et al.7 found significant elevation of BMP-2, −4, and −7 levels in AS patients. One meta-analysis revealed that DKK-1 serum levels were significantly higher in AS patients than in normal controls.8 Yi-Kun Mou et al.9 found that serum MMP-3 and sRANKL were significantly higher and OPG in AS was slightly higher than those in controls. Serum levels of MMP-3 positively correlated with BASDAI and BASFI. Serum level of sRANKL negatively correlated with disease course. Genre F et al.10 showed similar OPN serum levels in a group of 30 AS patients who were undergoing TNF-α antagonist therapy to healthy controls. Choi S. T. et al.11 concluded that AS patients had higher plasma OPN level, depending on whether patients received anti-inflammatory treatment. Compared with the normal control, the plasma DKK-1 and RANKL/OPG in AS patients were significantly increased in our study, which was consistent with the previous research results. The level of OPN is controversial in previous studies. We found that OPN in AS patients was lower than that in the normal control group. No study has ever reported PDGF-BB in AS patients. In our study, it was found that the level of PDGF-BB in AS patients was higher than that in normal controls. The levels of BMP-2, BMP-6, BMP-7, MMP-3, and RANKL in AS patients showed an increasing trend, consistent with previous studies; but there was no statistically significant difference compared with those in healthy subjects. TGF-β3 has not been reported in AS, but it is significantly increased in RA. Our study also showed a slight increase in TGF-ß3 among AS patients. The results indicate the presence of metabolic bone disorder in AS patients.
We also analyzed the correlation between bone metabolism-related factors and BMD. It was found that MMP-3 negatively correlated with whole-body BMD, whole-body T-scores, femoral neck BMD, and femoral neck T-scores, while OPG negatively correlated with femoral neck T-scores (p < 0.05). The other bone metabolism-related factors had no statistical correlation with BMD possibly due to the small sample size. Overall, the decrease in bone mass in AS patients may be associated with metabolic bone disorders.
Osteoimmunology connects immune system and bone metabolism. Many studies have demonstrated abnormalities in RANKL-RANK-OPG system among AS patients. RANKL is divided into membrane-bound RANKL and soluble RANKL, while the latter has been mostly investigated so far. Our study investigated both soluble RANKL and the membrane-bound RANKL on lymphocyte surface. We found that the expression of RANKL in lymphocytes was higher in AS patients with osteopenia than that with normal bone mass. Many T lymphocytes are abnormally activated in AS to express RANKL, thus activating RANKL-RANK-OPG pathway to promote the maturation and differentiation of osteoclasts. Our study explained the active osteoclast process in AS patients by confirming that high expression of membrane-bound RANKL on lymphocyte surface was associated with AS-induced osteopenia.
The expression of bone metabolism-related factors is regulated by a variety of miRNAs. The lowly expressed miRNA218 may interact with RANKL-RANK-OPG pathway and is mainly involved in pathologic osteogenesis in AS. Our study also demonstrated that microRNA-218 expression in PBMC of AS patients was lower than healthy subjects. Several in vitro experiments also suggested that microRNA-218 expression was downregulated during RANKL-dependent osteoclastogenesis. The causal relationship between microRNA-218 and RANKL in AS and how it leads to bone destruction remain unclear. In this study, we found that microRNA-218 was positively correlated with BASMI, suggesting that the low expression of microRNA-218 was correlated with better joint activity in AS patients. The study on microRNA-218 can help to understand the bone destruction in AS.
Our study found that not only BMD at lumbar spine, femoral neck, and whole body, but also bone metabolism-related factors changed after 6 months of TNF-α inhibitor treatment. It indicated that anti-osteoporosis drugs were not necessary in treatment of secondary osteoporosis due to AS. Large sample size of clinical studies is warranted to confirm these conclusions.
5 CONCLUSIONLoss of bone mass mainly occurred at the inflammatory sites in AS patients, depending on the severity of inflammation. The alleviation of inflammation can improve loss of bone mass and bone metabolism disorders. Anti-inflammatory treatment is critical for the treatment of secondary osteoporosis due to AS.
CONFLICT OF INTERESTThe authors declare that they have no competing interests.
AUTHOR CONTRIBUTIONSYX and WW carried out the study concepts and design. JL, YX, and WW carried out the studies, participated in collecting data. LZ, CL, and DX performed the statistical analysis and participated in its design. XY, NK, and YY helped to draft the manuscript and performed the data analysis. All authors read and approved the final manuscript.
CODE AVAILABILITYNot applicable.
CONSENT TO PARTICIPATEInformed consent was obtained from all the participants.
The datasets used and/or analyzed during the current study available from the corresponding author on reasonable request.
Filename Description jcla24223-sup-0001-TableS1-S7.docxWord 2007 document , 22.1 KB Table S1-S7Please note: The publisher is not responsible for the content or functionality of any supporting information supplied by the authors. Any queries (other than missing content) should be directed to the corresponding author for the article.
REFERENCES
1Moltó A, Etcheto A, van der Heijde D, et al. Prevalence of comorbidities and evaluation of their screening in spondyloarthritis: results of the international cross-sectional ASAS-COMOSPA study. Ann Rheum Dis. 2016; 75(6): 1016- 1023. 2Davey-Ranasinghe N, Deodhar A. Osteoporosis and vertebral fractures in ankylosing spondylitis. Curr Opin Rheumatol. 2013; 25(4): 509- 516. 3Arends S, Spoorenberg A, Efde M, et al. Higher bone turnover is related to spinal radiographic damage and low bone mineral density in ankylosing spondylitis patients with active disease: a cross-sectional analysis. PLoS One. 2014; 9(6):e99685. 4Kaya A, Ozgocmen S, Kamanli A, Ardicoglu O. Bone loss in ankylosing spondylitis: does syndesmophyte formation have an influence on bone density changes? Med Princ Pract. 2009; 18(6): 470- 476. 5Klingberg E, Lorentzon M, Mellstrom D, et al. Osteoporosis in ankylosing spondylitis - prevalence, risk factors and methods of assessment. Arthritis Res Ther. 2012; 14(3): R108. 6Di Munno O, Ferro F. The effect of biologic agents on bone homeostasis in chronic inflammatory rheumatic diseases. Clin Exp Rheumatol. 2019; 37(3): 502- 507. 7Park MC, Park YB, Lee SK. Relationship of bone morphogenetic proteins to disease activity and radiographic damage in patients with ankylosing spondylitis. Scand J Rheumatol. 2008; 37(3): 200- 204. 8Zhang L, Ouyang H, Xie Z, Liang ZH, Wu XW. Serum DKK-1 level in the development of ankylosing spondylitis and rheumatic arthritis: a meta-analysis. Exp Mol Med. 2016; 48(4): e228. 9Mou YK, Zhang PP, Li QX, et al. Changes of serum levels of MMP-3, sRANKL, and OPG in juvenile-onset ankylosing spondylitis patients carrying different HLA-B27 subtypes. Clin Rheumatol. 2015; 34(6): 1085- 1089. 10Genre F, López-Mejías R, Miranda-Filloy JA, et al. Correlation between two biomarkers of atherosclerosis, osteopontin and angiopoietin-2, in non-diabetic ankylosing spondylitis patients undergoing TNF-α antagonist therapy. Clin Exp Rheumatol. 2014; 32(2): 231- 236. 11Choi ST, Kim JH, Kang EJ, et al. Osteopontin might be involved in bone remodelling rather than in inflammation in ankylosing spondylitis. Rheumatology (Oxford). 2008; 47(12): 1775- 1779.
留言 (0)