
記住我
Atrial fibrillation (AF) is the most common sustained and supraventricular arrhythmia, characterized by uncoordinated atrial electrical activation and consequently ineffective atrial contraction.1 AF is associated with substantial morbidity and mortality, thus posing a significant burden to patients, physicians, and healthcare systems globally.2 Preventing AF recurrence (via rhythm control) and detrimental complications (via rate control and antithrombotic therapies) are current therapeutic strategies for AF patients.3 The pathophysiology of AF is complex and incompletely understood. Emerging evidence suggests that the roles of activated inflammatory cells and mediators in cardiac tissue and circulatory system have been implicated in various AF-related pathological mechanisms.4, 5
The lymphocyte-to-monocyte ratio (LMR), comprised of the ratio of white blood cell (WBC) subgroups, has been proved to be a novel inflammatory marker for lots of cardiovascular diseases, such as acute type A aortic dissection (AAAD),6 ST-elevated myocardial infarction (STEMI),7 heart failure,8 acute pulmonary embolism,9 and carotid artery stenosis.10 Several histological studies of AF found that increased infiltration of inflammatory cells, such as lymphocytes and monocytes, in the atrial myocardium or appendage tissues.11-13 Another study demonstrated that a higher percentage of activated T lymphocytes was observed in the peripheral blood of patients with paroxysmal or persistent AF.14 Furthermore, monocyte infiltration in the left atria was reported to be associated with AF-related thromboembolic events.15, 16 Nevertheless, to the best of our knowledge, there is almost no study investigating the association between LMR in the peripheral blood and the survival of AF patients.
In the present study, we intended to investigate whether there was a relationship between LMR and prognosis in critically ill patients with AF by utilizing the Medical Information Mart for Intensive Care-III (MIMIC-III) database. This research was conducted consistent with the requirements of the STrengthening the Reporting of OBservational studies in Epidemiology (STROBE) statement.17
2 MATERIALS AND METHODS 2.1 Study design and data resourceWe conducted a longitudinal, single-center retrospective cohort study with all the relevant data collected from the MIMIC-III database based on the methods used in our previous studies.18-20 The MIMIC-III database is an open and freely accessible database collecting data from over 50,000 critically ill patients at the Beth Israel Deaconess Medical Center (BIDMC) in Boston from 2001 to 2012.21 The MIMIC-III database documents contained comprehensive and high-quality data from hospital monitoring systems and bedside monitoring systems. International Classification of Diseases, Ninth Revision (ICD-9) code was documented for specific diseases by hospital staff on patient discharge. We obtained permission to access the dataset after passing the “Protecting Human Research Participants” exam (authorization code: 33281932). The establishment of the MIMIC-III database was approved by the Institutional Review Boards of the Massachusetts Institute of Technology (Cambridge, MA, USA) and BIDMC, and consent was obtained for the original data collection. Therefore, the ethics approval statement and the requirement for informed consent were waived. In summary, this study conformed to the provisions of the Declaration of Helsinki (as revised in Edinburgh 2000).
2.2 Patient selectionWe included all intensive care unit (ICU) patients (aged ≥ 18 years) in the database with the primary diagnosis of AF using the ICD-9 diagnosis code (ICD-9 code of AF = 42731). Only the data of each patient's first ICU admission were used in this study. Patients were excluded if they had (1) a secondary diagnosis of inflammatory, hematological or autoimmune diseases, sepsis, or malignant tumors; (2) incomplete follow-up information; (3) a length of stay in the ICU less than 24 hours; (4) incomplete or unobtainable data of measured lymphocyte or monocyte count during the first 24-hour admission; or (5) more than 10% of individual data missing.
2.3 Data extraction and study outcomesStructured query language with PostgreSQL (version 9.4.6, www.postgresql.org) was used to extract data on demographics, vital signs, laboratory tests, scoring systems, and treatment information from the database. Baseline demographic variables included age, sex, and current smoking status. We extracted data on the following comorbidities: coronary artery disease (CAD), congestive heart failure, hypertension, chronic obstructive pulmonary disease (COPD), stroke, transient ischemic attack (TIA), diabetes mellitus (DM), dyslipidemia, anemia, chronic kidney disease, chronic liver disease, and sleep apnea. Vital signs on admission included heart rate, respiratory rate, systolic blood pressure (SBP), diastolic blood pressure (DBP), and mean blood pressure (MBP). Laboratory-based data included WBC, neutrophil, lymphocyte, platelet, monocyte, hematocrit, hemoglobin, red blood cell distribution width (RDW), albumin, blood urea nitrogen (BUN), creatinine, glucose, total calcium (tCa), potassium, sodium, chloride, magnesium, prothrombin time (PT), partial thromboplastin time (PTT), and international normalized ratio (INR). If participants underwent more than one laboratory test during their hospitalization, only the initial test results were included for further analysis. In terms of scoring systems, the Simplified Acute Physiology Score II (SAPS II) and the Sequential Organ Failure Assessment (SOFA) were extracted from the database. Additionally, treatment information data included mechanical ventilation, renal replacement treatment, appendage closure, coronary artery bypass grafting (CABG), valvular surgery, and in-hospital medication administration (antiarrhythmic agents, antiplatelet agents, warfarin, and beta-blocker).
Our primary study outcome was 1-year all-cause mortality. The secondary outcomes included 28-day and 90-day all-cause mortality.
2.4 Definition, calculation, and identification of cutoff values for LMRLymphocyte-to-monocyte ratio was calculated in the formulate: lymphocyte counts divided by monocyte counts on admission. LMR, as a continuous variable, was dichotomized via the X-tile software (version 3.6.1; Yale University, New Haven, CT, USA) based on the maximal log-rank chi-square value, which represented the greatest group difference in outcome probability.22 In addition, normal ranges of lymphocyte and monocyte counts in the peripheral blood were defined as between 0.8 × 10⁹/L and 4.0 × 10⁹/L, and between 0.12 × 10⁹/L and 0.8 × 10⁹/L, respectively.
2.5 Management of missing dataTo reduce bias due to missing data, variables with more than 20% missing values were excluded from the study. Correspondingly, variables with less than 20% missing values were handled using multivariable imputation.23 Variables for which multivariable imputation was adopted included RDW, BUN, tCa, chloride, PT, PTT, and INR.
2.6 Propensity score matchingPropensity score matching (PSM) analysis was used to minimize the effect of potential confounders. Baseline characteristics (age, sex, current smoking status, admission type, CAD, congestive heart failure, hypertension, COPD, stroke, TIA, DM, dyslipidemia, anemia, chronic kidney disease, chronic liver disease, sleep apnea, SBP, DBP, MBP, heart rate, respiratory rate, WBC, neutrophil, platelet, hematocrit, hemoglobin, RDW, albumin, BUN, creatinine, tCa, potassium, sodium, chloride, magnesium, PT, PTT, INR, SOFA, SAPS II, mechanical ventilation, renal replacement treatment, appendage closure, CABG, valvular surgery, and in-hospital medication administration) were incorporated in the propensity score analysis. We did not include lymphocyte and monocyte counts in the PSM analysis to avoid influence on the value of LMR. A logistic regression model was constructed to calculate and assign each patient a propensity score, which was defined as the likelihood of being exposed to an intervention given that the status of a particular patient's measured prognostic factors.24, 25 Next, 1:1 matching (LMR ≤ 2.67 vs. LMR > 2.67) without replacement was performed using a nearest neighbor matching algorithm, with a fixed caliper width of 0.05.26
2.7 Statistical analysisThe data distribution was examined using the Kolmogorov-Smirnov test. Categorical variables are presented as total number and percentage, and continuous variables as mean (standardized differences [SD]) or median (interquartile range [IQR]). Baseline characteristics of enrolled participants were presented by using either Pearson's chi-square test, Fisher's exact test, Student t test, or Mann–Whitney U test as appropriate.
The unadjusted survival curves were plotted by the Kaplan–Meier method and compared using the log-rank test. Moreover, Cox proportional-hazards analysis was performed to examine the relationship between LMR and each study endpoint. Multivariable Cox regression Model 1 was adjusted for age and sex. Multivariable Cox regression Model 2 was adjusted for variables with p < 0.100 in the univariable Cox analysis. The results of Cox regression models are presented as hazard ratios (HRs) and 95% confidence intervals (CIs). The LMR > 2.67 group was taken as the reference group. We also did the subgroup analysis based on lymphocyte and monocyte counts, age, sex, CAD, congestive heart failure, hypertension, COPD, stroke, TIA, DM, dyslipidemia, anemia, chronic kidney disease, chronic liver disease, sleep apnea, mechanical ventilation, CABG, renal replacement treatment, and in-hospital medication administration. Furthermore, to identify a non-linear relationship, a smooth curve was then drawn to estimate the relationship between LMR and its HR using restricted cubic spline regression analysis. Two piece-wise Cox proportional-hazards models were further performed to demonstrate the saturation effect of LMR on mortality. The inflection point was determined using the recursive method, where the model gave the maximum likelihood. Furthermore, a log-likelihood ratio test comparing the one-line linear model with two piece-wise models was conducted to determine whether the saturation effect existed.
A two-tailed p < 0.050 was considered to be statistically significant. All statistical analyses were conducted using R software (version.3.6.1; The R Project for Statistical Computing, TX, USA; http://www.r-project.org) and SPSS software (version 22.0; IBM Corporation, St. Louis, Missouri, USA).
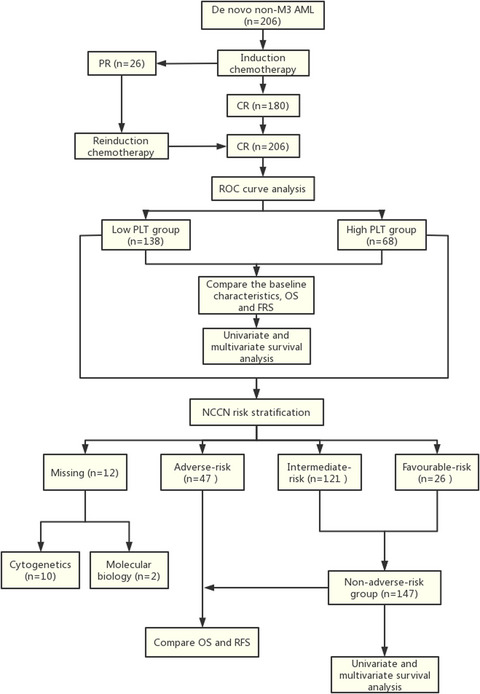
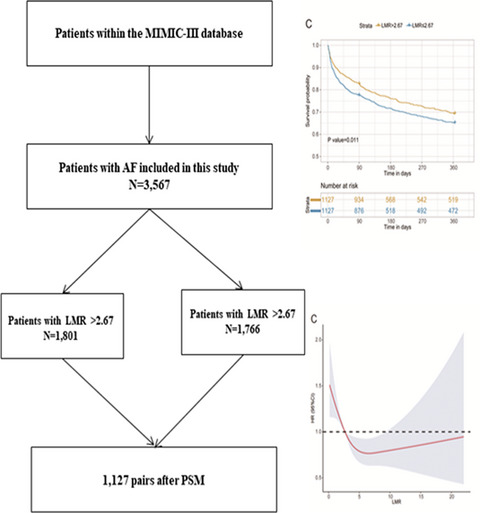
3 RESULTS 3.1 Characteristics of patientsIn total, 3567 patients fulfilled the selection criteria and comprised the final study cohort (Figure 1). X-tile software identified the optimal cutoff value of LMR for 1-year mortality as 2.67. Therefore, patients were divided into the low LMR group (n = 1766) and the high LMR group (n = 1801). The baseline characteristics of enrolled patients are briefly summarized in Table 1. Patients with the higher LMR (>2.67) tended to be younger (p < 0.001). Regarding comorbidity, patients with the higher LMR (>2.67) were more likely to suffer from CAD (p = 0.002), hypertension (p < 0.001), stroke (p = 0.028), and dyslipidemia (p < 0.001). However, patients with the lower LMR (≤2.67) displayed higher WBC (p < 0.001), neutrophil (p < 0.001), platelet (p < 0.001), monocyte (p < 0.001), hematocrit (p = 0.007), RDW (p < 0.001), BUN (p < 0.001), creatinine (p < 0.001), glucose (p < 0.001), PT (p = 0.030), INR (p = 0.004), SOFA (p < 0.001), and SAPS II (p < 0.001); they were also more likely to receive renal replacement treatment (p < 0.001).

Flow diagram of patient inclusion. MIMIC-III, Medical Information Mart for Intensive Care-III; ICU, intensive care unit; ICD-9, International Classification of Diseases, Ninth Revision
TABLE 1. Characteristics of the study patients according to the LMR groups before and after PSM Characteristics Before PSM After PSM LMR > 2.67 (n = 1801) LMR ≤ 2.67 (n = 1766) p value LMR > 2.67 (n = 1127) LMR ≤ 2.67 (n = 1127) p value Demographics Age, years 75 (66–83) 77 (68–84) <0.001 77 (67–84) 77 (68–84) 0.975 Sex, male, n (%) 982 (54.5) 1,008 (57.1) 0.125 637 (56.5) 614 (54.5) 0.330 Current smoker, n (%) 843 (46.8) 847 (48) 0.490 520 (46.1) 519 (46.1) 0.966 Admission type, n (%) Elective 429 (23.8) 272 (15.4) <0.001 208 (18.5) 213 (18.9) 0.938 Emergency 1,325 (73.6) 1,433 (81.1) 887 (78.7) 884 (78.4) Urgent 47 (2.6) 61 (3.5) 32 (2.8) 30 (2.7) Comorbidities, n (%) CAD 877 (48.7) 770 (43.6) 0.002 509 (45.2) 513 (45.5) 0.866 Congestive heart failure 759 (42.1) 911 (51.6) <0.001 552 (49.0) 544 (48.3) 0.736 Hypertension 989 (54.9) 834 (47.2) <0.001 579 (51.4) 584 (51.8) 0.833 COPD 223 (12.4) 307 (17.4) <0.001 166 (14.7) 170 (15.1) 0.813 Stroke 249 (13.8) 201 (11.4) 0.028 145 (12.9) 146 (13.0) 0.950 TIA 50 (2.8) 33 (1.9) 0.072 29 (2.6) 27 (2.4) 0.787 DM 519 (28.8) 504 (28.5) 0.854 326 (28.9) 309 (27.4) 0.426 Dyslipidemia 420 (23.3) 278 (15.7) <0.001 202 (17.9) 216 (19.2) 0.448 Anemia 451 (25) 480 (27.2) 0.146 297 (26.4) 297 (26.4) 1.000 Chronic kidney disease 248 (13.8) 323 (18.3) <0.001 183 (16.2) 167 (14.8) 0.352 Chronic liver disease 31 (1.7) 49 (2.8) 0.034 24 (2.1) 25 (2.2) 0.885 Sleep apnea 90 (5.0) 79 (4.5) 0.462 61 (5.4) 49 (4.3) 0.241 Vital signs SBP, mmHg 113.2 (104.5–125) 114.3 (105–125.5) 0.380 113.2 (104.2–125.2) 114.1 (104.7–125.4) 0.604 DBP, mmHg 56.7 (51.2–63.1) 57.0 (51.4–63.4) 0.124 56.8 (51.5–63.1) 56.6 (51.3–63.2) 0.539 MBP, mmHg 73.6 (68.3–80.6) 74.3 (68.8–81.2) 0.149 74.0 (68.6–80.5) 74.0 (68.4–80.7) 0.729 HR, beats/min 83.6 (73.3–93.8) 82.7 (73.2–93.5) 0.518 83.1 (73.0–93.5) 82.8 (72.9–93.3) 0.577 RR, beats/min 18.5 (16.4–21.3) 18.5 (16.2–21.4) 0.846 18.5 (16.3–21.3) 18.4 (16.1–21.2) 0.796 Laboratory-based data WBC, 109/L 10.5 (8.0–14.0) 11.6 (8.7–15.6) <0.001 10.4 (7.8–13.8) 10.6 (8.1–14.2) 0.122 Neutrophil, 109/L 7.6 (5.6–10.6) 9.5 (6.9–13.0) <0.001 8.0 (5.8–11.1) 8.4 (6.3–11.4) 0.065 Lymphocyte, 109/L 1.8 (1.2–2.7) 0.9 (0.6–1.4) <0.001 1.5 (1.1–2.1) 1.0 (0.6–1.5) <0.001 Platelet, 109/L 187.0 (143.0–242.0) 196.0 (144.0–264.0) <0.001 191.0 (144.0–247.5) 190.0 (141.0–249.0) 0.514 Monocyte, 109/L 0.4 (0.3–0.6) 0.6 (0.4–0.9) <0.001 0.4 (0.2–0.5) 0.6 (0.4–0.9) <0.001 Hematocrit, % 30.6 (27.1–34.9) 31.4 (27.5–35.0) 0.007 30.9 (27.5–35.1) 31.1 (27.3–34.8) 0.805 Hemoglobin, g/dL 10.4 (9.2–11.8) 10.5 (9.3–11.8) 0.182 10.5 (9.3–11.9) 10.5 (9.2–11.7) 0.716 RDW, % 14.4 (13.6–15.5) 14.7 (13.8–16.1) <0.001 14.6 (13.7–15.9) 14.6 (13.7–15.8) 0.576 Albumin, mg/dL 3.4 (2.9–3.9) 3.2 (2.7–3.7) <0.001 3.3 (2.8–3.7) 3.3 (2.8–3.8) 0.270 BUN, mg/dL 21.0 (15.0–31.0) 25.0 (17.0–40.0) <0.001 23.0 (17.0–36.0) 23.0 (16.0–35.0) 0.539 Creatinine, mg/dL 1.0 (0.7–1.3) 1.1 (0.8–1.7) <0.001 1.0 (0.8–1.5) 1.0 (0.8–1.4) 0.654 Glucose, mg/dL 124.0 (103.0–150.0) 129.0 (107.0–161.0) <0.001 126.0 (105.0–155.0) 127.0 (107.0–157.0) 0.807 tCa, mg/dL 8.4 (8.0–8.8) 8.4 (7.9–8.8) 0.532 8.4 (7.9–8.8) 8.4 (7.9–8.8) 0.933 Potassium, mmol/L 4.2 (3.8–4.6) 4.2 (3.8–4.6) 0.179 4.2 (3.8–4.6) 4.2 (3.8–4.6) 0.774 Sodium, mmol/L 139.0 (137.0–142.0) 139.0 (136.0–141.0) <0.001 139.0 (137.0–141.0) 139.0 (137.0–141.0) 0.893 Chloride, mmol/L 108.0 (104.0–111.0) 107.0 (103.0–110.0) <0.001 107.0 (103.0–111.0) 107.0 (103.3–111.0) 0.323 Magnesium, mmol/L 2.0 (1.8–2.3) 2.0 (1.8–2.3) 0.520 2.0 (1.8–2.3) 2.0 (1.8–2.3) 0.764 PT, s 15.7 (14–18.5) 15.8 (14.1–19.2) 0.030 15.8 (14–19.1) 15.6 (14.0–18.6) 0.311 PTT, s 37.4 (30.1–53.1) 37.2 (30.1–55.4) 0.282 37.3 (30.1–54) 37 (30.2–55.0) 0.564 INR, s 1.5 (1.2–1.9) 1.5 (1.3–2.0) 0.004 1.5 (1.2–2.0) 1.5 (1.3–1.9) 0.253 Scoring system SOFA 4.0 (2.0–6.0) 4.0 (2.0–6.0) <0.001 4.0 (2.0–6.0) 4.0 (2.0–6.0) 0.399 SAPS II 35.0 (29.0–43.0) 38.0 (31.0–46.0) <0.001 36.0 (30.0–45.0) 37.0 (30.0–44.0) 0.619 Treatment information, n (%) Mechanical ventilation 1,074 (59.6) 1,000 (56.6) 0.069 625 (55.5) 627 (55.6) 0.932 Renal replacement therapy 23 (1.3) 50 (2.8) 0.001 22 (2.0) 18 (1.6) 0.523 Appendage closure 22 (1.2) 10 (0.6) 0.038 6 (0.5) 8 (0.7) 0.592 CABG 508 (28.2) 349 (19.8) <0.001 251 (22.3) 257 (22.8) 0.762 Valvular surgery 57 (3.2) 39 (2.2) 0.078 25 (2.2) 25 (2.2) 1.000 In-hospital medication, n (%) Antiarrhythmic agents 1,653 (91.8) 1,570 (88.9) 0.004 1018 (90.3) 1030 (91.4) 0.380 Antiplatelet agents 1,529 (84.9) 1,402 (79.4) <0.001 915 (81.2) 912 (80.9) 0.872 Warfarin 843 (46.8) 721 (40.8) <0.001 480 (42.6) 497 (44.1) 0.470 Beta-blocker 1,401 (77.8) 1,266 (71.7) <0.001 833 (73.9) 847 (75.2) 0.498 Note BUN, blood urea nitrogen; CABG, coronary artery bypass grafting; CAD, coronary artery disease; COPD, chronic obstructive pulmonary disease; DBP, diastolic blood pressure; DM, diabetes mellitus; INR, international normalized ratio; LMR, lymphocyte-to-monocyte ratio; LMR, lymphocyte-to-monocyte ratio; MBP, mean blood pressure; PSM, propensity score matching; PT, prothrombin time; PTT, partial thromboplastin time; RDW, red cell distribution width; RR, respiratory rate; SAPS II, Simplified Acute Physiology Score II; SBP, systolic blood pressure; SOFA, Sequential Organ Failure Assessment; tCA, total calcium; TIA, transient ischemic attacks; WBC, white blood cell. 3.2 Prognostic significance of LMR before PSMAmong the 3567 AF patients included, 13.9% (495/3567) died during the first 28 days, 20.1% (717/3567) died during the first 90 days, and 28.1% (1004/3567) died during the 1-year follow-up period. Kaplan–Meier curves for all-cause death according to the LMR groups are shown in Figure 2A. The curves of the LMR groups differed significantly, and patients in the low LMR group had a higher cumulative incidence of mortality (log-rank test: p < 0.001).

Kaplan–Meier survival analysis plot for 1-year survival. A significantly lower 1-year survival rate can be observed in the lower LMR group in patients before PSM (A), patients with normal lymphocyte and monocyte counts (B), and patients after PSM (C). LMR, lymphocyte-to-monocyte ratio; PSM, propensity score matching
The results of the univariable and multivariable Cox regression analyses are summarized in Table 2 and Tables S1–3. A univariable Cox regression analysis was conducted to select the variables with p < 0.100, and age, gender, CAD, congestive heart failure, hypertension, COPD, stroke, dyslipidemia, chronic kidney disease, chronic liver disease, sleep apnea, mechanical ventilation, renal replacement treatment, appendage closure, CABG, valvular surgery, antiarrhythmic, antiplatelet agents, warfarin, and beta-blocker were selected and incorporated into the multivariable Cox regression model. Multivariable Cox regression analysis showed that patients with the LMR ≤ 2.67 had significantly higher 1-year mortality compared to patients with the LMR > 2.67 (Model 1: HR = 1.950, 95% CI: 1.713–2.220, p < 0.001; Model 2: HR = 1.640, 95% CI: 1.437–1.872, p < 0.001). The multivariable analysis for 28-day and 90-day mortality yielded similar results.
TABLE 2. Outcomes of patients before and after PSM and patients with normal lymphocyte and monocyte counts Unadjusted model Adjusted model 1 Adjusted model 2 HR (95% CI) p value HR (95% CI) p value HR (95% CI)
留言 (0)