
記住我
Acute myeloid leukaemia (AML) is a malignant bone marrow failure disease characterised by the clonal proliferation of bone marrow haematopoietic stem progenitor cells. In the USA, 4.3/100,000 individuals develop the disease every year, and the 5-year survival rate is only 24%.1 Currently, chemotherapy is the primary AML treatment modality, and the risk stratification of patients underlies chemotherapy and further treatment regimens.2-5 With the application and development of next-generation sequencing technology, the risk stratification of AML mainly relies on cytogenetic and molecular genetic characteristics.5 However, the easily available clinical indicators (such as age, white blood cell count [WBC] and platelet [PLT]) are also associated with the prognosis of patients with AML.6-13
Complete remission (CR) occurs when bone marrow blasts are <5%, circulating blasts and the blasts with Auer rods are absent, no extramedullary disease is detected, neutrophil (ANC) count is ≥1.0 × 10⁹/L, and platelet count is ≥100 × 109/L.14 When all conditions of CR are fulfilled but the PLT count is <100 × 109/L, the patient is considered to be in CR with incomplete platelet recovery (CRp). Since the concept of CRp was first proposed by the International Working Group in 2003,15 several studies have evaluated the correlation between PLT count and AML prognosis. In 2005, Larson et al. conducted a study on the recurrence rate of patients experiencing CRp, which was significantly higher than that of patients who experienced CR.16 CR with an ANC count <1.0×10/L and PLT count <100 × 109/L was defined as CR with incomplete haematologic recovery (CRi).14 In 2017, a retrospective study revealed that CRp or CRi decreased the overall survival (OS) and increased the risk of recurrence compared to CR in AML.8 At present, it has been recognised that the prognosis of CR is better than CRi in AML.
However, no consensus has been reached regarding the correlation between patients with complete PLT recovery and prognosis. In this retrospective study, we collected newly diagnosed non-M3 AML patients to explore the importance of complete PLT recovery after induction chemotherapy on prognosis.
2 MATERIALS AND METHODS 2.1 Data collectionThis retrospective single-centre study included de novo non-M3 AML patients treated at the Second Hospital of Shanxi Medical University from January 2014 to December 2020. The clinical data of the patients were collected from hospital medical records. All procedures involving the clinical characteristics, diagnosis and treatment of the patients followed the Declaration of Helsinki.
2.2 PatientsThis study included patients who were (1) de novo AML patients treated at the Second Hospital of Shanxi Medical University from January 2014 to December 2020, (2) achieved CR after chemotherapy and (3) administered at least one course of consolidation chemotherapy.
The exclusion criteria were as follows: (1) acute promyelocytic leukaemia (M3), (2) patients who had previously received chemotherapy and (3) patients who were refractory.
All patients with AML were diagnosed and classified based on morphology, immunology, cytogenetics and molecular biology according to the 2016 World Health Organization (WHO) criteria.17 Cytogenetic and molecular biology subgroups were classified according to the National Comprehensive Cancer Network (NCCN) guidelines version 1, 2017. Patients younger than 60 years old received the traditional ‘7+3’ chemotherapy regimen, and patients older than 60 years old received priming chemotherapy, all patients with or without demethylation therapy. Of the 26 patients who did not achieve CR after the first induction chemotherapy, 5 received the second ‘7+3’ induction chemotherapy, and 21 patients received second-line chemotherapy regimens. Finally, in 206 patients who achieved CR after induction or reinduction chemotherapy, the choice of consolidation chemotherapy regimens was based on the NCCN guidelines.5
Relapse-free survival (RFS) was defined as the time from the date of CR to the date of the first event (relapse or last follow-up) occurrence or death. OS was defined as the time from the date of diagnosis to the date of death or the last follow-up. Relapse was considered to have occurred when the bone marrow contained ≥5% blasts, reappearance of blasts in the blood or the emergence of extramedullary leukaemia.
The highest PLT count 28–42 days after chemotherapy was documented and defined as an early PLT count (D28 PLT). Follow-up was conducted through medical record review or telephone, and the follow-up time was up to 1 March 2021.
2.3 Statistical analysisReceiver operating characteristic (ROC) curve analysis was used to determine the optimal platelet cut-off value. The patients’ baseline characteristics were compared using the Mann-Whitney U test for continuous parameters and the chi-square test or Fisher's exact test for categorical parameters. OS and RFS were analysed using the Kaplan-Meier method, and differences between groups were assessed using the log-rank test. Univariate Cox regression analysis (p < 0.10) was included in the multivariate Cox regression analysis, in which p < 0.05 was considered statistically significant. All statistical analyses were performed using SPSS software (version 20.0; IBM, Armonk, NY, USA).
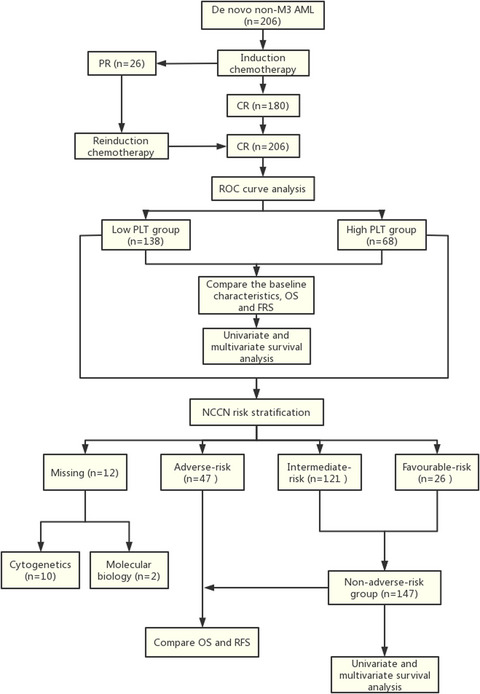
3 RESULTS 3.1 Patients’ characteristicsA total of 206 patients were enrolled in the current study (Figure 1), and the median follow-up time was 13 months (range, 3–87 months). The median age of the patients was 46 (range: 12–78) years at the time of diagnosis, and the cohort comprised 113 (54.85%) males and 93 (45.15%) females. The 2016 WHO subtype classification for AML patients was as follows: 114 (55.34%) patients were in the recurrent genetic abnormalities group, nine (4.37%) patients were in the myelodysplasia-related changes group, 76 (36.89%) patients were in the not-otherwise specified groups, and seven (3.40%) patients were in the other group. Based on cytogenetic and molecular genetic risk stratification, the favourable-risk group consisted of 26 (12.62%) patients; the intermediate-risk and adverse-risk groups consisted of 121 (58.74%) and 47 (22.81%) patients, respectively, and the remaining 12 (5.83%) patients failed to be classified from records. A total of 133 (64.56%) patients were infected at the time of diagnosis, 102 (49.51%) patients received demethylated drug induction chemotherapy, and 185 (89.81%) had minimal residual disease (MRD) <5% after induction chemotherapy. The initial median WBC count, haemoglobin (Hb) count, PLT, and mean red blood cell volume (MCV) were 11.49 (range: 0.51–274.58) × 109/L, 81.50 (range: 27.00–157.20) g/L, 33 (range: 1.00–437.00) × 109/L and 98.40 (range: 30.90–128.90) fl respectively. The median body mass index (BMI) was 23.47 (range: 16.41–42.86) kg/m2. Blood cell analysis was performed after chemotherapy, in which the median ANC count was 2.59 (range: 0.15–24.70) × 109/L, Hb count was 111.00 (range: 11.00–159.10) g/L, and PLT count was 255 (range: 100–695) × 109/L. There were 24 (11.65%) patients who received allogenic stem cell transplantation (SCT), the adverse-risk group, intermediate-risk group and favourable-risk group accounted for five, 16 and one respectively, while two patients were missing. This patient received allogeneic SCT in the favourable-risk group because of recurrence. A total of 83 deaths were recorded until 1 March 2021, and the estimated 3-year OS and RFS were 48.4% (95% confidence interval [CI]: 39.4–57.4%) and 59.6% (95% CI: 49.4–69.8%) respectively.

Study flow. M3, acute promyelocytic leukaemia; AML, acute myeloid leukaemia;PR, partial remission; CR, complete remission; ROC, receiver operating characteristic; PLT, platelet; OS, overall survival; RFS, relapse-free survival; NCCN, National Comprehensive Cancer Network
According to the ROC curve, 312 × 109/L was confined as the cut-off value for PLT; hence, we divided the patients into high (≥312 × 109/L) and low (100 ≤ PLT < 312 × 109/L). Subsequently, 138 patients had high D28 PLT counts, and 68 patients showed low D28 PLT counts. There were significant differences in the 2016 WHO subtypes and blood cell counts after chemotherapy between the two groups (p < 0.05). The clinical characteristics of the two groups of patients are summarised in Table 1.
TABLE 1. Baseline characteristics of 206 patients with AML All patients (n = 206) Low PLT group High PLT group p 100 ≤ PLT < 312 × 109/L PLT≥312 × 109/L (n = 138) (n=68) Characteristics Median age (range), years 46 (12–78) 48(12–78) 44.5(12–68) 0.094 Gender Male, No. (%) 113 (54.85) 73 (52.90) 40 (58.82) 0.422 Female, No. (%) 93 (45.15) 65 (47.10) 28 (41.18) 2016 WHO subtypes, No. (%) AML with recurrent genetic abnormalities 114 (55.34) 67 (48.55) 47 (69.12) 0.020 AML with myelodysplasia-related changes 9 (4.37) 7 (5.07) 2 (2.94) AML, not-otherwise specified 76 (36.89) 60 (43.48) 16 (23.53) Others 7 (3.40) 4 (2.90) 3 (4.41) Risk group, No. (%) Favourable 26 (12.62) 14 (10.15) 12 (17.65) 0.084 Intermediate 121 (58.74) 86 (62.32) 35 (51.47) Adverse 47 (22.81) 33 (23.91) 14 (20.59) Missing 12 (5.83) 5 (3.62) 7 (10.29) Initial infection, No. (%) Yes 133 (64.56) 87 (63.04) 46 (67.65) 0.516 NO 73 (35.44) 51 (36.96) 22 (32.35) Induction therapy with demethylation, No. (%) Yes 102 (49.51) 74 (53.62) 28 (41.18) 0.093 NO 104 (50.49) 64 (46.38) 40 (58.82) MRD < 5%, No. (%) Yes 185 (89.81) 124 (89.86) 61 (89.71) 0.973 NO 21 (10.19) 14 (10.14) 7 (10.29) Allogenic SCT, No. (%) Yes 24 (11.65) 15 (10.87) 9 (13.23) 0.619 NO 182 (88.35) 123 (89.13) 59 (86.76) Initial CBC Median WBC (range), 109/L 11.49 (0.51–274.58) 15.53 (0.80–274.58) 10.30 (0.51–185.30) 0.856 Median Hb (range), g/L 81.50 (27.00–157.20) 80.00 (27.00–157.20) 84.00 (40.00–148.00) 0.547 Median PLT (range), 109/L 33.00 (1.00–437.00) 32.50 (4.00–437.00) 34.00 (1.00–226.00) 0.761 Initial median MCV (range), fl 98.40 (30.90–128.90) 98.30 (30.90–121.90) 99.70 (77.10–128.90) 0.893 Initial median BMI (range), kg/m² 23.47 (16.41–42.86) 23.84 (16.41–42.86) 22.95 (16.80–28.25) 0.715 D28 CBC after chemotherapy ANC, 109/L 2.59 (0.15–24.70) 2.55 (0.15–8.74) 2.85 (0.66–24.70) 0.007 Hb, g/L 111.00 (11.00–159.10) 114.00(11.00–159.10) 108.50 (68.00–141.00) 0.018 PLT, 109/L 255.00(100–695) 204.95 (100–311) 420.70 (313–695) < 0.001 Abbreviations: 95%CI, 95% confidence interval; AML, acute myeloid leukaemia; ANC, neutrophil; BM, bone marrow; BMI, body mass index; CBC, cell blood count; Hb, haemoglobin; HR, hazard ratio; MCV, mean red blood cell volume; MRD, minimal residual disease; OS, overall survival; PLT, platelet; RFS, relapse-free survival; SCT, stem cell transplantation; WBC, white blood cell. 3.2 Prognostic value of D28 PLTPatients with a high PLT count had a significantly superior RFS (p = 0.020, Figure 2A) and OS (p < 0.001, Figure 2B) compared with those with low PLT count, as assessed by the Kaplan-Meier test. The estimated 3-year OS of patients with high PLT was higher than that of their counterparts (72.3% vs. 34.6%, p = 0.001). The estimated 3-year RFS for the high and low PLT groups was 75.1% and 45.7% respectively (p = 0.078).

Survival outcomes analysis of patients with de novo non-M3 AML after CR according to PLT count. (A) Relapse-free survival was compared between low PLT group and high PLT group. (B) Overall survival was compared between low PLT group and high PLT group
Next, we performed a univariate analysis for survival outcomes of 206 patients with AML with respect to age, sex, initial blood count, infection, BMI, induction chemotherapy with demethylation, risk group, MRD, allogeneic SCT and D28 blood count. The results are summarised in Table 2. We found that D28 PLT was significantly associated with RFS (p = 0.017) and OS (p = 0.001), and the MRD and allogenic SCT were also correlated with RFS and OS. In the multivariate analysis, the results showed that D28 high PLT count was an independent predictor of better RFS (HR = 0.436, p = 0.009) and OS (HR = 0.386, p < 0.001), MRD < 5%, and allogeneic SCT was a favourable predictor of RFS and OS (p < 0.05), and D28 Hb≥100 g/L was associated with superior RFS (p < 0.05).
TABLE 2. Univariate and multivariate analysis of 206 patients with AML for RFS and OS Characteristics RFS OS Univariate Multivariate Univariate Multivariate HR (95%CI) p HR (95%CI) p HR (95%CI) p HR (95%CI) p Age(years, ≥60 vs. < 60) 1.436 (0.726–2.841) 0.298 - - 1.320 (0.745–2.342) 0.342 - - Gender (male vs. female) 0.757 (0.419–1.366) 0.355 - - 1.072 (0.656–1.754) 0.781 - - Initial WBC (109/L, ≥100 vs. <100) 1.002 (0.349–2.875) 0.997 - - 1.199 (0.554–2.593) 0.645 - - Initial Hb (g/L, ≥100 vs. <100) 0.957 (0.499–1.838) 0.896 - - 0.728 (0.409–1.297) 0.281 - - Initial PLT (109/L, 100–300 vs. <100 or >300) 1.181 (0.508–2.745) 0.698 - - 1.046 (0.491–2.227) 0.907 - - Initial MCV (fl, 80–100 vs. >100 or <80) 1.414 (0.786–2.541) 0.247 - - 1.094 (0.688–1.740) 0.704 - - Initial BMI (kg/m2, 18.5–23.9 vs. <18.5 or >23.9) 0.625 (0.346–1.132) 0.121 - - 1.046 (0.659–1.661) 0.849 - - Initial infection (Yes vs. No) 0.907 (0.471–1.746) 0.770 - - 1.441 (0.804–2.581) 0.220 - - Induction chemotherapy with demethylation (Yes vs. No) 0.883 (0.469–1.661) 0.699 - - 0.898 (0.545–1.481) 0.675 - - Risk group (adverse vs. others) 1.146 (0.570–2.303) 0.702 - - 1.312 (0.772–2.230) 0.315 - - MRD < 5% (Yes vs. No) 0.245 (0.114–0.523) <0.001 0.281 (0.137–0.574) 0.001 0.486 (0.251–0.943) 0.033 0.456 (0.243–0.855) 0.014 Allogenic SCT (Yes vs. No) 0.231 (0.054–0.978) 0.047 0.225 (0.054–0.936) 0.040 0.380 (0.149–0.972) 0.043 0.378 (0.151–0.946) 0.038 D28 ANC (109/L, 2–7 vs. <2 or >7) 1.162 (0.639–2.113) 0.623 - - 1.273 (0.787–2.060) 0.326 - - D28 Hb (g/L, ≥100 vs. <100) 0.568 (0.307–1.052) 0.072 0.540 (0.304–0.960) 0.036 0.652 (0.392–1.083) 0.098 0.643 (0.402–1.027) 0.065 D28 PLT (109/L, ≥312 vs.100 ≤ PLT<312) 0.452 (0.235–0.870) 0.017 0.436 (0.234–0.811) 0.009 0.390 (0.225–0.675) 0.001 0.386 (0.227–0.657) <0.001 Abbreviations: 95%CI, 95% confidence interval; AML, acute myeloid leukaemia; ANC, neutrophil; BMI, body mass index; Hb, haemoglobin; HR, hazard ratio; MCV, mean red blood cell volume; MRD, minimal residual disease; OS, overall survival; PLT, platelet; RFS, relapse-free survival; SCT, stem cell transplantation; WBC, white blood cell.To further analyse the prognostic significance of D28 PLT count in various cytogenetic and molecular genetic risk subgroups, we divided the patients into adverse-risk and non-adverse-risk group (favourable- and intermediate-risk groups). In subgroup analysis, patients with high PLT had better OS in the non-adverse-risk group (p = 0.001), but not in the adverse-risk group (p = 0.695) (Figure 3B). Patients with high PLT also showed a better RFS trend (p = 0.076); however, this trend was not observed in patients in the adverse-risk group (p = 0.450) (Figure 3A). We also conducted univariate and multivariate survival analyses for non-adverse-risk patients, and the results are summarised in Table 3. Univariate analysis showed that age, induction chemotherapy with demethylation, MRD, D28 Hb and D28 PLT were significantly associated with RFS and OS, D28 ANC and allogeneic SCT were correlated with OS. Furthermore, D28 PLT≥312 × 109/L was a positive predictive marker of improved RFS (HR = 0.375, p = 0.011) and OS (HR = 0.264, p < 0.001) in multivariate analysis. Age, induction chemotherapy with demethylation, MRD < 5% and D28 Hb≥100 g/L were deemed predictive factors for FRS and OS (p < 0.05).

Survival outcomes analysis of patients with de novo non-M3 AML after CR according to PLT count. (A) Relapse-free survival was compared between non-adverse-risk group and adverse-risk group. (B) Overall survival was compared between non-adverse-risk group and adverse-risk group
TABLE 3. Univariate and multivariate analysis of non-adverse-risk patients with AML for RFS and OS Characteristics RFS OS Univariate Multivariate Univariate Multivariate HR (95%CI) p HR (95%CI) p HR (95%CI) p HR (95%CI) p Age(years, ≥60 vs. <60) 2.237 (1.003–4.989) 0.049 2.289 (1.066–4.915) 0.034 2.244 (1.128–4.465) 0.021 2.188 (1.137–4.209) 0.019 Gender (male vs. female) 0.792 (0.395–1.587) 0.510 - - 0.937 (0.520–1.685) 0.827 - - Initial WBC (109/L, ≥100 vs. <100) 1.213 (0.266–5.531) 0.803 - - 1.810 (0.582–5.630) 0.305 - - Initial Hb (g/L, ≥100 vs. <100) 1.167 (0.544–2.501) 0.692 - - 0.738 (0.349–1.560) 0.426 - - Initial PLT (109/L, 100–300 vs. <100 or >300) 0.836 (0.258–2.714) 0.766 - - 0.909 (0.320–2.579) 0.858 - - Initial MCV (fl, 80–100 vs. >100 or <80) 1.607 (0.814–3.175) 0.172 - - 1.228 (0.694–2.173) 0.481 - - Initial BMI (kg/m2, 18.5–23.9 vs. <18.5 or >23.9) 0.484 (0.225–1.044) 0.064 0.524 (0.253–1.083) 0.081 1.001 (0.554–1.809) 0.998 - - Initial infection (Yes vs. No) 0.856 (0.407–1.804) 0.683 - -
留言 (0)