
記住我


Imagine navigating through a crowded train terminal while you have to remember from which track your train departs. Depending on the coordinative motor load imposed by the navigational task, it might be difficult to successfully perform the cognitive task of finding the right track. Planning your movements might suddenly get harder when you have to evade people who behave unpredictably and get in your way out of nowhere. Such increases in movement complexity can have a negative impact on your ongoing thinking process, that is remembering the track your train departs. This competition of two tasks for limited and potentially insufficient attentional resources has been referred to as cognitive-motor interference(CMI; Al-Yahya et al., 2011). According to the “posture first” strategy there is a general tendency in humans to first ensure secure posture and then to carry out the cognitive task with the remaining resources (Bloem, Valkenburg, Slabbekoorn, & Willemsen, 2001).In the context of the introductory example this would mean that in the case of insufficient attentional resources you would rather avoid bumping into other people at the cost of confusing the track where your train departs than vice versa. CMI demonstrates, that even when the task load involves separate domains (cognitive and motor), it can tap into the same pool of resources. As of yet, the underlying cognitive processes that are involved in CMI are not fully understood (Leone et al., 2017).
The neurophysiological investigation of resource allocation in dual-task situations and its cognitive underpinnings dates back to the 1980s when Wickens, Kramer, Vanasse, and Donchin (1983) found an impairing effect of multi-sensory cognitive dual tasking on information processing which went along with a reduction of the P3 ERP component amplitude. In EEG research, the P3 component describes the third positive amplitude deflection approximately appearing 300 ms to 500 ms after a stimulus was presented (e.g., Verleger, 2020). It was often shown to vary with workload and to indicate updating and categorization processes (Allison & Polich, 2008; Kok, 1997, 2001). In the following years, many researchers conceptualized an inherent capacity limit of cognitive resources (Baddeley, 1992; Norman & Shallice, 1986; Wickens, Sandry, & Vidulich, 1983). This research suggests that the distribution of attentional resources is governed by a management system. In the case of the overall task demands exceeding the available resources, this management system may prioritize certain tasks over others when allocating resources. Going back to the introductory example and the posture first hypothesis, the resource management system would allocate attentional resources in a way that would guarantee your physical integrity even if this means that you might end up at the wrong side of the train station.
Effects of cognitive load and associated effects of task interference could not only be found on a behavioural level but also in electrophysiological measures. Studies found differences in cognitive load to be reflected in distinct ERP components, in particular in increased N2 and decreased P3 amplitudes. N2, the second negative deflection approximately 250 ms after a stimulus was presented, was found to be an indicator of stimulus-related conflict monitoring (Yeung, Botvinick, & Cohen, 2004) and to be tightly bound to cognitive control processes (Folstein & Van Petten, 2008). The P3 amplitude also varied with changes in workload, so a direct link between this component and limits of processing capacity could be established (Kok, 2001).
Alongside features in the time domain, spectral properties of the signal could also help to detect cognitive load and resource availability. Frontal Theta oscillations (4–7 Hz) were shown to be related to the execution of cognitive control functions and to be functionally related to ERP components like the N2 (Cavanagh & Shackman, 2015; Nigbur, Ivanova, & Stürmer, 2011; Onton, Delorme, & Makeig, 2005). Event-related Theta oscillations were found to reflect a large variety of attentional control processes like error detection, working memory and cognitive effort (for a review see Cavanagh & Frank, 2014). Consequently, Theta power has been used as a measure of cognitive effort invested to deal with certain levels of cognitive load (Brouwer et al., 2012; Klimesch, 1999). The studies demonstrated that the increased levels of task demands went along with an increased Theta power. In the context of the evaluation of resource availability and cognitive demands, another frequency range of interest is the Alpha band (8–12 Hz). It was found that the exertion of executive control may affect Alpha activity, especially when inhibitory processes are involved (Klimesch, 2012; Klimesch, Sauseng, & Hanslmayr, 2007).
This possibility to get insights into participants’ task load and resource allocation by deducting voltages from the scalp rendered the investigation of CMI by means of the EEG possible. In practice, however, the electrophysiological investigation of cognition in motion was extremely difficult until recently due to technological limitations. Recent technological advances, especially technological miniaturization, made long-term mobile EEG recordings possible. This enabled researchers to deploy a mobile approach of electrophysiological research (Ladouce, Donaldson, Dudchenko, & Ietswaart, 2017; Park, Dudchenko, & Donaldson, 2018), with the advantage of being able to investigate cognitive processes in naturalistic environments and during natural movements (Makeig, Gramann, Jung, Sejnowski, & Poizner, 2009). An important choice in this line of research is the degree of ecological validity. Accordingly, Parada (2018) conceptualized mobile research as being possible at any location on a continuum ranging from structured laboratory studies to less controlled studies in natural environments.
In an early mobile ERP study, Gramann, Gwin, Bigdely-Shamlo, Ferris, and Makeig (2010) investigated the ERPs of participants either standing (0 m/s) or walking on a treadmill (0.8 m/s, 1.25 m/s, 1.9 m/s) during a visual oddball paradigm. They found that the stimulus-locked, posterior, oddball-related ERP components N1and P3 were enhanced for target as compared to standard stimuli, but were not affected by movement. The authors interpreted the N1 component as reflecting an early attentional and discriminative processes, whereas the P3 oddball was found to resemble stimulus updating processes. De Sanctis, Butler, Malcolm, and Foxe (2014) found a reduced stimulus-locked N2 amplitude over midline electrodes for both walking slowly (0.67 m/s), and walking briskly (1.39 m/s) on a treadmill in a visual go/no-go task compared to a seated condition. They interpreted this observation as an impairment of early inhibitory processes. Furthermore, they found a diminished centro-parietal P3 amplitudes during higher motor load, whereas response times did not increase with these higher dual-task demands. In a recent study, Shaw et al. (2018) found detrimental effects of walking on response times and accuracy when comparing a sitting and a walking condition on a treadmill during an auditory no-go exercise. This was accompanied by diminished frontal and fronto-central N1 amplitudes and decreased P3 amplitudes at Cz and Pz. The overall result pattern of mobile ERP assessment with respect to CMI appears to be that an increase of motor task demands goes along with a reduction of ERP components that are time-locked to a cognitive task.
Oscillations can also help to understand the effects of concurrent bodily movement and cognitive load. Shaw et al. (2018)) observed an increased spectral power in the Theta band (4–7 Hz) and a decrease in the Alpha band (11–13 Hz) in the walking compared to the sitting condition in non-stimulus-locked, ongoing segments. Kline, Poggensee, and Ferris (2014) had young and healthy participants either standing still, or walking in different speeds (0.4,0.8, 1.2, 1.6 m/s) on a treadmill while performing no task at all or a spatial working memory task (Brooks-task; Brooks, 1967). They found an increase in step width when participants performed the cognitive task. Also, an increase in Alpha power (8–13 Hz) was evident before stimulus presentation, whereas an Alpha decrease was found during memory encoding. Also, Theta-range (4–7 Hz) power fluctuations were found in fronto-central and parietal areas as power decreased significantly irrespective of the movement condition. Movement speed, however, did not affect spectral power. Another lab-based study by Ehinger and colleagues (2014) showed Alpha activity (8–12 Hz) to play a crucial role in situations with high visuo-attentionally demands. They found that when participants had to turn on a walkway as opposed to walking straight, Alpha power was suppressed over parietal, occipital and temporal sites while turning. When taking into account that Alpha dynamics recorded over the visual cortex areas may reflect top-down modulation of attention (Foxe, Simpson, & Ahlfors, 1998; Klimesch, 2012; Klimesch et al., 2007), this finding indicates an important role of Alpha-range activity in mobile neurophysiological research, especially when moving outdoors with higher visual demands.
Despite the importance of such mobile, but highly controlled laboratory experiments, many argue that a step towards natural behaviour in ecologically valid environments is necessary to understand cognition in the real world (Ladouce et al., 2017; Schaefer, 2014). Of course, walking on a treadmill constitutes continuous walking, but is inherently different than overground locomotion (Song & Hidler, 2008), let alone locomotion in outdoor environments. Song and Hidler found that when walking on a treadmill, participants altered their muscle activation patterns and maintained quite “stiff” kinematics. In general, they reduced their range of motion to adjust to a constant speed on a treadmill. Also, laboratory audio-visual stimulation cannot quite reproduce real sensory experiences, since stimulation comes from static locations (speakers or headphones) and does mostly not reproduce the dynamic soundscape of natural environments.
The first step towards measuring CMI outside of the lab was to validate measures that have already been established in laboratory settings. Debener, Minow, Emkes, Gandras, and de Vos (2012) compared auditory stimulus-locked oddball P3 amplitudes between an indoor seated and outdoor walking condition. They found a diminished amplitude for the target P3 when participants were walking outside. Similarly, De Vos, Gandras, and Debener (2014) demonstrated similar results for target-tone stimulus-locked P3 amplitudes for participants sitting or walking on the university campus. In our recent study (Reiser, Wascher, & Arnau, 2019), we compared standing in a natural outdoors setting to walking with and without obstacle course elements while participants executed an auditory oddball task. A higher movement complexity was accompanied by higher subjective workload ratings and increased response times. Event-related Theta responses (4–7 Hz) and parietal target-tone P3 amplitudes were decreased for both locomotive conditions compared to standing. Similar observations were made for cycling, as stimulus-locked P3 amplitudes were found to be (marginally) diminished when cycling outdoors as compared to indoors (Scanlon, Townsend, Cormier, Kuziek, & Mathewson, 2017; Zink, Hunyadi, Huffel, & De Vos, 2016). All of these results indicate a decrease of available cognitive resources with an increase of motor and sensory load. Additionally, these studies showed that the parietal P3 (Debener et al., 2012; Reiser et al., 2019; Scanlon et al., 2017; De Vos et al., 2014; Zink et al., 2016) and event-related Theta (Reiser et al., 2019) may be used as measures for cognitive resource availability in natural environments.
Beside the choice of the degree of ecological validity of the experimental setting, the choice of the task to investigate cognitive processing is an important one. For the investigation of CMI outside of the lab, most recent studies utilized quite unchallenging paradigms, like the auditory oddball task (Debener et al., 2012; Reiser et al., 2019; Scanlon et al., 2017; De Vos et al., 2014; Zink et al., 2016). Despite the deployment of very basic tasks, variance related to different movement conditions could be observed in behavioural as well as in electrophysiological measures. To get a deeper insight into the distribution of cognitive resources across tasks, however, a more complex task might be more appropriate. Pizzamiglio, Naeem, Abdalla, and Turner (2017), for example, let participants do common everyday tasks (having a conversation with another person, writing text messages on a smartphone) while walking with a self-determined pace. The dual-task conditions impaired gait performance significantly. Furthermore, having a conversation significantly increased Theta (4–7 Hz) and Beta (15–30 Hz) activity in frontal and parietal areas, whereas writing a text message was accompanied by a decreased Beta power in frontal premotor and sensorimotor cortices. For us though, a cued task-switching paradigm seemed to offer many opportunities. In this paradigm, a trial consists of a cue tone (e.g., low or high sinus tones) followed by a stimulus tone (spoken numbers between 1–4 and 6–9). The cue tone gives information about how to respond to the upcoming stimulus—it encodes the task (is the number smaller than 5 or larger than 5 vs. is the number odd or even). Task-switching tasks offer the opportunity to disentangle cognitive processing into two separate processing stages—cue processing and stimulus processing (Grange & Houghton, 2014; Karayanidis & Jamadar, 2015; Kiesel et al., 2010; Li, Wang, Zhao, & Fogelson, 2012; Rushworth, Passingham, & Nobre, 2002). Mayr and Kliegl (2003) described these stages as a cue-driven retrieval of task rules and a following transformation of task rules into attentional configuration. Jost et al. (2008) demonstrated that both stages have different physiological signatures. They found different activation patterns for post-cue and post-stimulus processing stages in a task-switch study. P3 amplitudes were varying differently in repeat and switch trials. The highest activation after cue and stimulus were found in fronto-central and parietal areas.
Interestingly, this paradigm is also suited for investigation of long-range neuronal network behaviour due to its two consecutive processing stages. These networks were found to help understanding executive functioning in more detail (Mizuhara & Yamaguchi, 2007), as they involve the synchronization of cortical activity between functionally connected regions of the brain. It can be measured by examining mutual activation at different sensors in functionally relevant frequency ranges. Their results indicate that fronto-frontal and fronto-parietal networks in the Theta band play a crucial role when engaging in a challenging, mental arithmetic task. In an uncued task-switching paradigm, stimulus-related Theta network activity was more pronounced in switch compared to repeat trials between frontal and posterior areas (Sauseng et al., 2006). Despite being promising, connectivity measures have rarely been used in mobile brain/body imaging (MoBI) research. One exception is a study of Shaw and colleagues (2019), who investigated ongoing functional connectivity measured as the weighted phase lag index (WPLI) during concurrent cognitive task performance and walking or sitting. They observed a stronger fronto-parietal connectivity during walking compared to sitting and interpreted this finding as a greater need of sensorimotor information integration and attentional control processes.
In the present study, we investigated CMI by deploying an auditory cued task-switch paradigm while the participants performed a motor task. This motor task consisted of three levels of increasing movement complexity: standing still, walking in laps, walking in laps while traversing obstacle course elements (cf. Reiser et al., 2019). Beside behavioural measures, we assessed subjective workload using the NASA-TLX and recorded the EEG of our participants. With respect to the switching task, we expected longer response times and a decreased accuracy in switch compared to repeat trials. This is due to the inhibition of the previous task set and the activation of the new action plan (Kiesel et al., 2010).
The frontal N2 and the contingent negative variation (CNV) pose complementary ERP components to detect underlying inhibitory processes. With underlying structures being involved in the allocation of cognitive resources like the prefrontal cortex which is related to the executive functions of inhibition and task switching (Miyake et al., 2000). Cue-related N2 amplitudes should be more negative in switch trials due to an increased need for cognitive control (Nigbur et al., 2011; Patel & Azzam, 2005). CNV amplitudes prior to a cued target stimulus were demonstrated to be diminished with higher cognitive load and increasing task demand in laboratory task-switch paradigms (Brunia & van Box tel, 2001; Nicholson, Karayanidis, Poboka, Heathcote, & Michie, 2005; Swainson et al., 2003; Walter, Cooper, Aldridge, McCallum, & Winter, 1964). The cue-evoked parietal P3 amplitudes should be increased in switch compared to repeat trials as it was found in many paradigms with both auditory and visual cue stimuli (i.e., Gajewski & Falkenstein, 2011; Gajewski, Ferdinand, Kray, & Falkenstein, 2018; Kieffaber & Hetrick, 2005; Nicholson et al., 2005). This increase in P3 amplitude can be interpreted with respect to resource availability and stimulus or task-set updating processes (cf. Miyake et al., 2000). Concerning time-frequency measures, we expect a higher frontal Theta power in response to the cue tone in switch trials due to increased executive control demands (Cunillera et al., 2012). We also expect a stronger anticipatory Alpha suppression in switch trials before a cued target stimulus (Foxe, Murphy, & De Sanctis, 2014). Accordingly, Theta phase coherence should be stronger in switch compared to repeat trials (cf. Sauseng et al., 2006).
As the movement complexity manipulation of walking and traversing an obstacle course should increase the workload being imposed on the cognitive system, we expect a higher subjective workload, increased response times and reduced accuracy with higher movement complexity (Reiser et al., 2019). In the EEG, an increased movement complexity should be noticeable in decreased P3 amplitudes, but unchanged N2 amplitudes (Reiser et al., 2019). P2 and N2 components showed differences in amplitude between standing versus locomotion conditions in our previous study which included the same movement conditions but a simpler cognitive task (Reiser et al., 2019), so they will be part of an exploratory analysis. Since CNV negativity has not been examined in previous MoBI studies, we expected diminished negative amplitudes with higher movement complexity load in concordance with prior laboratory studies. In line with our previous findings, we expect fronto-central Theta power to be decreased with an increase of movement complexity (Reiser et al., 2019). Also, increasing movement complexity should lead to an increased Alpha power suppression before stimulus presentation and response execution. This mechanism should facilitate the subject's ability to focus on cognitive task execution. For Theta connectivity, we expect an increased phase-difference coherence as the need for sensorimotor integration elevates with higher movement-related load(c.f. Shaw et al., 2019).
2 METHODS 2.1 ParticipantsTwenty-three healthy participants without any prior or present neurologic or psychiatric condition were recruited by online announcements between 18 September and 23 November 2018. All participants had normal or corrected-to-normal vision, were free of hearing deficiencies, were right-handed and had no motor or gait impairment. Due to technical difficulties regarding online trigger generation, only 20 datasets (10 female) were used for further analysis. The sample's age ranged from 19 to 30 years (M = 23.55, SE = 0.69). Subjects received 10€ per hour as compensation and gave their informed written consent. The study was approved by the local ethics committee of the Leibniz Research Centre for Working Environment and Human Factors and was conducted in accordance with the Declaration of Helsinki.
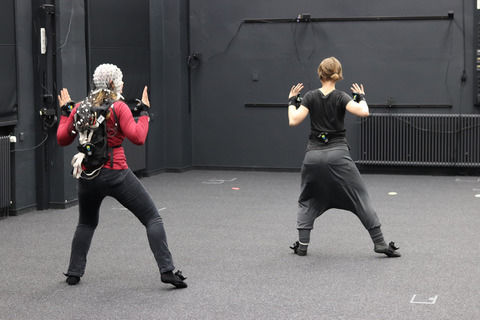
2.2 Apparatus, stimuli and taskAll data used for analysis were recorded on the outside premises of the institute. The obstacle course used for the movement complexity task was situated on the lawn of the institute, had a perimeter of 75 m and was composed of two small staircases, two balancing beams and two boards with foot-sized cut outs (see Figure 1); on the staircases, participants had to climb and descend the stairs; on the balancing beams, they had to balance safely on the beams and reach the other side without touching the surrounding grass; on the “coordination boards,” they had to step into the cut-outs without touching the surrounding wooden surface.

(a) Photographs of a participant traversing the obstacle course. The subject is wearing a 30-channel EEG cap and a backpack containing all relevant stimulus- and trigger-generation devices. In the upper picture, the participant traverses a coordination board by stepping into the cut-outs without touching the surrounding wooden surface. In the middle picture, the participant traverses a balancing beam by balancing on the beam to the other end without touching the surrounding grass. In the lower picture, the participant traverses a staircase by ascending and descending the stairs. (b) Blueprint of the obstacle course. The course had a perimeter of 75 m and each element (stairs, balancing beam, coordination board) had to passed twice each round
Experiments took place in nearly all weather conditions, only when it rained we did not invite participants due to the water-sensitive equipment. Outside temperatures ranged from 4°C to 20°C (M = 12.65; SE = 1.03) at the beginning of the experiment.
The mobile data collection setup consisted of three main components. First, for trigger and auditory stimulus generation, a Raspberry Pi 2 (Raspberry Foundation, UK) was used running on customOpenSesame scripts (Mathôt, Schreij, & Theeuwes, 2012). Second, triggers were forwarded to a LiveAmp Sensor and Trigger Extension (Brain Products GmbH, Gilching, GER) via a tethered connection. These devices were stored in a small backpack that was carried by the participant throughout the duration of the experiment. Auditory stimuli were presented to the subject via passive noise-cancelling in-ear headphones (Bose QC20, Framingham, USA). Third, the participant held a self-made response handle in each hand to enable behavioural responses. The handles were made from generic bicycle handlebar grips with a response button on top and had a wired connection to the Trigger Extension.
Regarding auditory stimulation, each trial comprised a cue tone and a stimulus. A cue tone was a pure sine wave tone either with a low (600 Hz, average sound level of 61 dB(A)) or a high pitch (900 Hz, average sound level of 70 dB(A)). A trial started with a fixed cue-tone interval of 500 ms which began with one of the sinus tones which had a total length of 82 ms (10 ms rise/fall time, 62 ms tone duration). After the cue interval the stimulus was presented. A stimulus consisted of a spoken number between 1 and 4 or 6 and 9 recorded from a single female speaker (average sound levels ranging from 59 to 66 dB(A)). Each stimulus had a fixed length of 500 ms. The response time window following stimulus onset had a length of 2000 ms ± 500 ms of jitter. A trial had a mean duration of 3,000 ms ± 500 ms of jitter.
For the cognitive task, participants had to perform in a task switching paradigm. A trial consisted of an auditory cue tone (low- or high-pitched sinus wave) followed by an auditory stimulus (numbers between 1-4/6-9). Depending on the cue tone, the participant had to indicate by a button press of the left or right response button whether the number was odd or even, or whether the number was less or greater than 5. The assignment which task had to be performed following the low or high cue tone was pseudo-randomized to prevent bias. Also, the assignment regarding which hand had to be used to respond to a number that was even/odd or less/greater than 5, respectively, was pseudo-randomized. A trial was regarded as a repeat trial when the prior and the current trial had the same cue tone (participants had to do the same task), whereas in a switch trial, the cue tone of the prior and the current trial differed. Both repeat and switch trials were presented pseudo-randomly with an equal probability, although only three repeat or three switch trials could follow in a row.
To execute the movement task, participants either had to stand in one specific place at the corner of the obstacle course, they had to walk around the obstacle course, or they had to walk while traversing the obstacle elements. The walking direction (clockwise vs. counterclockwise) as well as the order of movement complexity task difficulties was balanced and quasi-randomized for every participant. Each subject executed each movement complexity condition twice, once clockwise and once counterclockwise.
2.3 ProcedureAfter arriving between 8:45 a.m. and 9:45 a.m., the participants read the experiment information sheet and gave their informed consent. They were fitted with a mobile 30 electrode EEG setup (actiCap Slim electrodes, Brain Products GmbH; actiCap Snap cap, Brain Products GmbH) and put on the recording backpack. This procedure took approximately 1 hr per participant.
After preparation and in-depth explanation of the cognitive task, the participants were seated in a shielded EEG recording chamber for three practice blocks to get used to the cognitive task. In the chamber, they executed both cognitive task variants (even/odd, smaller/greater) in repeat-only blocks in a randomized order, followed by a block of task switching. Afterwards, the participant and the experimenter went outside to the obstacle course. Here, the subjects completed six blocks. Each block consisted of a 5-min repeat task (96 trials) and a 10-min switch task exercise (208 trials) while executing one of the three movement complexity conditions. After each block every participant answered the NASA-TLX questionnaire (Hart & Staveland, 1988) and took a short break.
2.4 Questionnaires and behavioural dataFor the assessment of the subjective workload, a German translation of the NASA-TLX was used. For analysis, the sum score of all six subscales was averaged for each of the six blocks. We calculated the response time as the latency between stimulus onset and correct button press. Accuracy was computed as the ratio of correctly answered trials and all trials.
Step data were calculated using the amplifier's accelerometer recordings. First, the amplifier's signal of the vertical axis was filtered between 0.1 Hz and 20 Hz. Then, mean stepping frequency was detected by identifying the maximum power in the frequency spectrum of the accelerometer data between 0.5 Hz and 3 Hz. After filtering the original accelerometer data via Morlet-wavelet convolution at this frequency, the peaks of this signal were used as step markers to calculate the number of steps and step interval variability. For this we used Matlab's built-in peak detection function (findpeaks) to detect peaks with a minimum prominence of 100 and a minimum height equal to or higher than the 75% quantile of the subject's data.
2.5 Electrophysiological data acquisitionEEG data were acquired with 30 electrodes in a standard 10–20-system montage (Fp1, Fp2, F3, F4, F7, F8, Fz, FC1, FC2, FC5, FC6, C3, C4, Cz, T7, T8, CP1, CP2, CP5, CP6, P3, P4, P7, P8, Pz, PO9, PO10, O1, O2, Oz, A1, A2). FCz was used as online reference and AFz served as the ground electrode. After fitting a tight cap with circumferences ranging from 54 to 60 cm equipped with electrode holders over the participant's head, actively shielded electrodes were inserted into the holders and filled with conductive gel until impedances reached 10 kΩ or less. It was ensured that electrode cables did not cross each other and had no clearance to sway around to prevent electric motion artefacts. All cables were routed through loopholes on the sides of the cap into the mobile LiveAmp EEG amplifier (Brain Products GmbH) which was placed in the actiCap's pocket at the back of the participant's head. Data were recorded with a sampling rate of 500 Hz and a bit depth of 24 bit directly onto a micro SD card inserted into the amplifier. At the same time, the online data stream which was received from the amplifier's Bluetooth connection was monitored on a laptop using the Brainvision Recorder software (Brain Products GmbH). Upon completion of the experiment, the EEG data were transferred from the SD card to the laptop using the LiveAmp File Converter software (Brain Products GmbH). Head movements were recorded simultaneously with the help of the LiveAmp's built-in 3-axis accelerometer sensors and embedded as separate data streams into the EEG data file.
2.6 Data preprocessingAfter conversion into files readable by EEGLab (Delorme & Makeig, 2004), data were processed offline using custom Matlab scripts. Pre-processing was executed similarly to lab-based experiments. First, the data were band-pass filtered between 0.5 and 35 Hz (filter order 4) with the ERPLab butterworth filter (Lopez-Calderon & Luck, 2014). After initial filtering, channels with a kurtosis higher than eight standard deviations (SDs) and amplitude values higher than five SDs were excluded using the EEGLab channel rejection tool. On average 2.2 channels (SE = 0.25) were rejected. In the next step, rejected channels were spherically interpolated to finally re-reference the data to the average of all channels. Before epoching, only correct trials remained in the dataset. All created epochs ranged from −800 ms to + 2,400 ms relative to the cue onset and the segment from −500 ms to −200 ms was defined as the baseline.
A separate independent component analysis (ICA) dataset was created by filtering the continuous data between 1 and 30 Hz using the EEGLab butterworth filter (filter order 4) and downsampling the filtered signal to 125 Hz to facilitate ICA decomposition. Epochs containing artefacts were identified automatically and removed from both datasets. Epochs were defined as artefactual when the amplitude was higher than 500 µVolts and when it had a probability higher than five SDs (with a maximum rejection rate of 10% each iteration) at channel level. Then, an ICA with a rank-reduced PCA (25 - number of rejected channels) was performed on the 125 Hz sampled dataset and the independent component (IC) spatial filters were copied to the 500 Hz dataset. The rationale behind interpolating before ICA and using a PCA afterwards was as follows: The topographical projections of the ICs can be biased if excluded channels are not distributed evenly across the scalp. This, in return, might impede the capability of the IC classifier ICLabel to detect artefact ICs reliably. For this reason, we interpolated excluded channels before computing the ICA. The interpolation of missing channels, however, does not add further information to the data. Therefore, the resulting data might be rank-deficient which can reduce the quality of source separation. Data compression by PCA before running the ICA can guarantee full-rank data (for further information see Makoto's preprocessing pipeline 1 ). A general rank reduction of 5 should make sure that there was no chance of collinearity in the ICA results.
The final step of pre-processing was to exclude artefact-related ICs by using the ICLabel classifier plugin for EEGLab (Pion-Tonachini, Kreutz-Delgado, & Makeig, 2019). All components that were classified as having a probability of less than 50% to be a “Brain IC” were excluded from the EEG dataset. By this procedure, 10.9 ICs (SE = 0.67) were excluded on average. To account for trial number effects on phase-related measures, a random sample of trials was drawn for each condition within each participant equal to the number of trials in the condition with the least number of trials. As ICLabel classifiers were trained on laboratory data, all classification solutions were checked by the corresponding author before advancing with the rest of the analysis. Also, every IC flagged for exclusion was examined individually.
2.7 EEG parametrization and analysis 2.7.1 ERPsThe preprocessed data were averaged for each channel and each experimental condition. Within these conditions, the data were baselined 2 from −200 ms to 0 ms prior to cue onset. Statistical analyses for frontal cognitive processing were performed on the N2 (200–314 ms ± 20 ms) and CNV (450 ms ± 50 ms) time windows at Fz. Parietal EEG activity was parametrized within the P2 (126–244 ms ± 20 ms), N2 (164–312 ms ± 20 ms), and P3 (400 ms ± 100 ms) time windows at Pz. To determine peak latencies of the frontal N2 and the parietal N2 and P2 components, an individual peak detection was performed. For each movement condition (but irrespective of trial type condition), a peak was detected in component-specific time windows (frontal N2: 160 ms – 320 ms, parietal P2: 100 ms – 250 ms, parietal N2: 200 ms – 300 ms). After the peak latency of the individual peaks was determined in the time windows, subject-specific data were averaged in a time window of ± 20 ms around these peaks.
2.7.2 ERSPsPower values were extracted by wavelet convolution of each correct trial. Complex Morlet wavelets (defined as complex sine waves tapered by a Gaussian) were created by using 28 logarithmically spaced frequencies between 3 and 30 Hz with a full width half maximum in the temporal domain ranging from 360 to 100 ms. Power estimates for each time–frequency point were obtained by averaging the squared magnitude of the complex convolution result across trials. ERSPs were decibel-normalized within each experimental condition using a frequency-specific baseline ranging from −500 ms to −200 ms prior to cue onset. The frontal Theta at Fz and the occipital Alpha at an occipital electrode cluster (O1, Oz, O2) were parametrized by using the same grand average peak latency detection procedure as used for ERPs. Theta-range activity was calculated as the mean of all frequencies between 5 Hz and 6 Hz, the Alpha range was determined as the mean of all frequencies from 9 Hz to 11 Hz. Peak detection was performed in frequency range-specific time windows (Theta: 0 – 300 ms post-cue and post-stimulus; Alpha: 300–500 ms post-cue and post-stimulus). Thus, frontal Theta power values were averaged from 124 ms up to 224 ms after cue onset and from 164 up to 264 ms after stimulus onset for each condition separately. Average occipital Alpha power, on the other hand, was parametrized from 388 ms to 588 ms post-cue and from 348 ms to 548 ms post-stimulus.
2.7.3 ISPCsAs a measure of connectivity, inter-site phase coherence (ISPC) was used (Cohen, 2014). Phase angle time series were obtained using the same set of Morlet wavelets as for the ERSPs. For each time–frequency point, ISPC values were calculated as the average phase angle difference of two channels. Finally, ISPCs were analysed in the Theta range for fronto-parietal channel pairs. These pairs were Fz combined with electrodes of two lateralized parieto-occipital patches (left patch: P3, P7, O1; right patch: P4, P8, O2). ISPCs were averaged within two time windows, both detected by applying grand average peak detection. The time windows ranged from 86 ms up to 186 ms after the cue onset and from 106 ms up to 206 ms after the stimulus onset. After ISPC values were computed and averaged over the posterior sites in each hemisphere, these averaged hemisphere-specific ISPC values were Fisher-z transformed over all conditions within a subject to approximate a normal distribution before commencing to statistical testing.
2.8 Statistical analysisStatistical analyses were carried out using Matlab's built-in repeated measures ANOVA (rmANOVA). Subjective measures were analysed by averaging all NASA-TLX subscales to an overall workload score. This score was submitted to a one-factorial rmANOVA regarding movement complexity (stand, walk, obstacle course). Behavioural data (response times and accuracy) were analysed using a 3 × 2 rmANOVA design for each measure, comprising movement complexity and trial type (repeat, switch). Electrophysiological measures (ERPs and ERSPs) were also tested using the same 3 × 2 design. Regarding ISPCs, we calculated a 2 × 3 × 2 rmANOVA (hemisphere x movement complexity × trial type) for both time windows. Since the three-way interaction was significant for the second time window, we broke this effect down by conducting two separate hemisphere-wise 3 × 2 rmANOVAs involving movement complexity and trial type. Gait measures of walking and obstacle course blocks were tested with a paired-sample t-test. The general level of significance was set to 0.05. Whenever a sphericity correction was necessary, the p-value was Greenhouse–Geisser corrected (indicated by pGG). Also, to account for family-wise error accumulation, significances within each ANOVA were corrected for false discovery rate (FDR) as described by Cramer and colleagues (2016).
Consecutive post-hoc tests were carried out using Matlab's built-in pairwise paired t-test function. Post-hoc test probabilities were also corrected for FDR. In cases of FDR correction, adjusted critical p-values (pcrit) are provided. Effect sizes for all tests are reported as adjusted partial eta squared following the article by Mordkoff (2019).
Since this study follows a rather exploratory approach towards real-life electrophysiological recordings, also marginal effects (0.05 < p < 0.10) were reported and discussed.
3 RESULTS 3.1 Questionnaire measures (NASA-TLX)The rmANOVA regarding the average NASA-TLX score showed a significant effect of movement complexity (F2,38 = 4.52, p = 0.02,
 = 0.15) on subjective workload ratings. Post-hoc comparisons demonstrated significant differences in workload ratings between standing (M = 6.15, SE = 0.79) and traversing the obstacle course (M = 7.61, SE = 0.87; t19 = −2.42, pcrit = 0.05, p = 0.03,
 = 0.19), as well as between walking (M = 6.31, SE = 0.63) and traversing the obstacle course (t19 = −5.56, pcrit = 0.033, p = 0.03,
 = 0.18). There was no statistically relevant difference between standing and walking (t19 = −0.37, pcrit = 0.017, p = 0.03,
 = −0.04). All NASA dimensions are visually represented in Figure 2.

Means of subjective NASA-TLX ratings for all dimensions seperately. The sum score was calculated using the unweighted sum of all scales. Error bars depict the standard error. Paired t-tests showed significant differences of movement complexity conditions on the NASA-TLX sum score. Traversing the obstacle course was rated more demanding than standing or walking during the cognitive-motor interference paradigm
3.2 Behavioural measures (Response times, omission errors)For response times, the 3 × 2 response time rmANOVA revealed significant main effects for movement complexity (F2,38 = 19.40, pcrit = 0.033,p<0.001,
 = 0.48) as well as trial type (F1,19 = 79.04, pcrit = 0.05, p < 0.001,
 = 0.80), although the interaction term stayed insignificant (F2,38 = 0.04,pcrit = 0.017, p = 0.962,
 = −0.05). Post-hoc pairwise t-tests showed that standing (M = 929.75, SE = 14.67) was significantly different to walking (M = 969.73, SE = 16.07; t19 = −5.56, pcrit = 0.05, p < 0.001,
 = 0.60) and the obstacle course condition (M = 984.14, SE = 13.86; t19 = −5.65, pcrit = 0.033, p < 0.001,
 = 0.61). Walking and obstacle course conditions did not differ from each other (t19 = −1.43, pcrit = 0.017, p = 0.17,
 = 0.05). Regarding trial type, participants took significantly longer to respond to switch (M = 995.48, SE = 12.49) as compared to repeat trials (M = 926.93, SE = 11.31).
Accuracy, on the other hand, was only impacted by trial type (F1,19 = 28.82, pcrit = 0.05, p < 0.001,
 = 0.58), with higher accuracy in repeat (M = 0.92, SE = 0.01) compared to switch trials (M = 0.89, SE = 0.01). There was no significant main effect for movement condition (F2,38 = 1.38, pcrit = 0.033, p = 0.26,
 = 0.02) or the interaction term (F2,38 = 1.49, pcrit = 0.017, p = 0.24,
 = 0.02). Both response times and accuracies are visualized in Figure 3.

Response times and omission errors for every experimental condition. Error bars depict the standard error. Repeated measures ANOVAs revealed significant main effects of movement and trial type for response times, and a significant main effect for trial type for accuracy. Response times were significantly higher in obstacle course conditions compared to standing and walking. Also mean response times were increased for switch trials. Accuracy was significantly lower in switch trials
Analysing the accelerometer sensor's step data, paired-sample t-tests demonstrated no significant differences between the walking and obstacle course condition regarding number of steps (Mwalk = 1,108.75; SDwalk = 31.11; Mobstacle = 1,073.70; SDobstacle = 21.28; t19 = 1.954, p = 0.07,
留言 (0)