
記住我


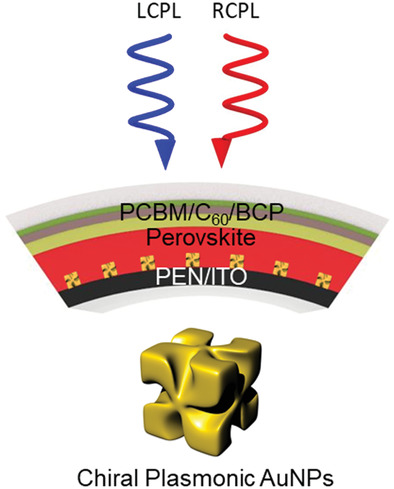
The synthesis of chiral plasmonic AuNPs was conducted as described in a previous report (see Experimental Section for detailed experimental procedures),[31] where the amino acid and peptide-directed asymmetric evolution of the nanoparticles was induced to form helicoid morphologies. The asymmetric evolution of AuNPs with helicoid morphologies can endow strong chiroptical responses as discussed in previous reports.[31, 32] The synthesized chiral plasmonic AuNPs were dispersed in an aqueous hexadecyltrimethylammonium bromide (CTAB) solution, which can stabilize [AuX4]− (X = halide anion) complexes. The procedure to fabricate an embedded configuration of AuNPs in perovskite for device applications is illustrated in Figure 1a. The aggregation of AuNPs on indium tin oxide (ITO) glass was suppressed during drying under ambient conditions by means of drop-casting on a hot plate at a mild heat of 40 °C under an upside-down petri dish. In this manner, we obtained uniformly distributed AuNPs on ITO; otherwise, the evaporation of droplets containing dispersed nanoparticles under ambient conditions formed a highly aggregated ring-like pattern of AuNPs (Figure S1, Supporting Information), which can be explained by the coffee-ring effect.[33, 34] After preparation of the ITO/AuNP substrate, the perovskite film was spin-coated on the substrate, leading to chiral plasmonic AuNP-embedded perovskite films. The compact perovskite film without pinholes on the ITO/AuNPs substrate was verified using scanning electron microscopy (SEM) analysis (Figure S2, Supporting Information). Figure 1b,c displays the circular dichroism (CD) spectra of chiral AuNPs in an aqueous solution and the corresponding anisotropy factor of CD (gCD) at a plasmon resonance wavelength of approximately 600 nm. The spectra originated from the non-perpendicular orientation between magnetic and electric dipole moments, caused by the highly twisted chiral structures of AuNPs.[31] The chiroptical response of chiral AuNPs in an aqueous solution was maintained after drop-casting the solution on an ITO substrate with a slightly blue-shifted resonance wavelength. Meanwhile, the intensity of the CD signal was an order of magnitude lower for ITO/chiral AuNPs than for the solution, which is attributed to the low density of AuNPs during light propagation. Notably, a significant resonance shift toward the higher wavelength was observed with the perovskite film deposited on ITO/chiral AuNPs with an analogous CD intensity, as shown in Figure 1d. In contrast, the perovskite film deposited on bare ITO showed no CD signals as expected. A lower gCD than ITO/AuNPs, but a distinct gCD of approximately 0.02 at the NIR region, appeared with the ITO/AuNP/perovskite film (Figure 1e); this lower gCD is attributed to the high absorption of the perovskite film. This result confirms the chiroptical response in 3D perovskites related to the presence of chiral plasmonic AuNPs, without sacrificing the optoelectronic and crystallographic properties of the original 3D Cs0.05FA0.5MA0.45Pb0.5Sn0.5I3 as shown in Figure 1f,g.

Chiral Plasmonic AuNP-embedded perovskites. a) Schematic fabrication procedures for chiral plasmonic AuNP-embedded perovskites. b) CD and c) gCD spectra of AuNPs dispersed in an aqueous solution. d) CD spectra on ITO/AuNPs, ITO/AuNPs/Cs0.05FA0.5MA0.45Pb0.5Sn0.5I3, ITO/ Cs0.05FA0.5MA0.45Pb0.5Sn0.5I3 films, and e) their corresponding gCD. f) Absorption spectra of ITO/Cs0.05FA0.5MA0.45Pb0.5Sn0.5I3 (pristine) and ITO/AuNPs/ Cs0.05FA0.5MA0.45Pb0.5Sn0.5I3 films. Tauc plots in inset illustrate that the bandgap is not affected by embedded AuNPs. g) X-ray diffraction patterns of ITO/Cs0.05FA0.5MA0.45Pb0.5Sn0.5I3 (pristine) and ITO/AuNPs/ Cs0.05FA0.5MA0.45Pb0.5Sn0.5I3 films.
2.2 Plasmonic Resonance Shift of Chiral AuNPs by Surrounding MediaThe LSPR effect in AuNPs caused by light with a larger wavelength than AuNPs induces collective oscillations, which reaches a plasmonic resonance at a specific wavelength depending on nanoparticles size,[35] distance between nanoparticles,[36] material constitution,[37] geometry,[38] and the surroundings of the nanoparticles.[39] The main peak on the CD spectrum of pristine AuNPs was shifted when they were covered with a Cs0.05FA0.5MA0.45Pb0.5Sn0.5I3 film. This result suggests that the surrounding Cs0.05FA0.5MA0.45Pb0.5Sn0.5I3 might affect the plasmonic resonance of AuNPs. Morphological compactness between AuNPs and perovskite may ensure the behavior of the perovskite as an isotropic surrounding medium that can affect the resonance wavelength of AuNPs as shown in SEM images in Figure 2a and Figure S3 in the Supporting Information. The schematic illustration in Figure 2a shows the possible interaction between AuNPs and perovskite, where quaternary ammonium groups of CTAB that cap AuNPs may be intercalated into the A-site in perovskite instead of the MA, FA, or Cs cations. This was confirmed by Fourier-transform infrared (FT-IR) spectroscopy. The appearance of symmetric or asymmetric CH scissoring vibrations of the H3CN+ moiety (approximately 1450 cm−1) and CN+ stretching (approximately 960 cm−1) in the ITO/AuNPs sample can be attributed to the CTAB capping AuNPs (Figure 2b, bottom).[40] After the deposition of a thin inorganic sublattice of Pb0.5Sn0.5I2 and CsPb0.5Sn0.5I3 on the ITO/AuNPs substrate, partial (Figure 2b, top) and complete (Figure 2b, middle) disappearance of those peaks were observed, respectively, where CsPb0.5Sn0.5I3 was used instead of Cs0.05FA0.5MA0.45Pb0.5Sn0.5I3 for FT-IR analysis to exclude the complicated interpretation by FA or MA. These results show that the ammonium moiety of CTAB is bound to the perovskite, implying possible interactions between the AuNPs and the perovskite. Importantly, both ITO/AuNPs/Pb0.5Sn0.5I2 and ITO/AuNPs/CsPb0.5Sn0.5I3 films showed main peak shifts toward the longer wavelength in CD spectra, compared with ITO/AuNPs (Figure S4, Supporting Information). To speculate on the origin of the shift in the CD spectra based on the surrounding media of AuNPs, we characterized the chiroptical responses of AuNPs with various surrounding media (Figure S5, Supporting Information). Normalized CD spectra with various surrounding media are shown in Figure 2c, where the degree of red-shift showed differences according to the surrounding media.
 Chiroptical responses of chiral plasmonic AuNPs. a) Schematic illustration of possible interactions between AuNPs and Cs0.05FA0.5MA0.45Pb0.5Sn0.5I3. Surface SEM micrograph shows the morphology of perovskite film prepared separately by a mixed solution of perovskite precursor and AuNPs. Scale bar indicates 100 nm. b) FT-IR spectra of ITO/AuNPs, ITO/AuNPs/Pb0.5Sn0.5I2, and ITO/AuNPs/ CsPb0.5Sn0.5I3 films. c) CD spectra of AuNPs with various surrounding media. d) nmed (at the wavelength of 580 nm)-dependent λres in CD spectra, where n of MAPbI3 was obtained from the previous result.[44]
In plasmonics, the origin of the plasmon resonance shift with surrounding media can be represented by an electrostatic model when the wavelength is much larger than the particle dimensions. The induced polarizability α by a dipole moment inside the particle can be defined as follows,[41]
Chiroptical responses of chiral plasmonic AuNPs. a) Schematic illustration of possible interactions between AuNPs and Cs0.05FA0.5MA0.45Pb0.5Sn0.5I3. Surface SEM micrograph shows the morphology of perovskite film prepared separately by a mixed solution of perovskite precursor and AuNPs. Scale bar indicates 100 nm. b) FT-IR spectra of ITO/AuNPs, ITO/AuNPs/Pb0.5Sn0.5I2, and ITO/AuNPs/ CsPb0.5Sn0.5I3 films. c) CD spectra of AuNPs with various surrounding media. d) nmed (at the wavelength of 580 nm)-dependent λres in CD spectra, where n of MAPbI3 was obtained from the previous result.[44]
In plasmonics, the origin of the plasmon resonance shift with surrounding media can be represented by an electrostatic model when the wavelength is much larger than the particle dimensions. The induced polarizability α by a dipole moment inside the particle can be defined as follows,[41]α=4πa3ε−εmedε+2εmed(1)
where a is the dimension of the particle, ε is the complex dielectric function of the particle, and εmed is the complex dielectric function of the surrounding medium. The polarizability experiences a resonance enhancement when |ε + 2εmed| is at a minimum, which can be simplified to the following condition for small or slowly varying Im[ε] (imaginary part of the dielectric function of the particle),Reεω=−2εmed(2)
where Re[ε(ω)] is the real part of the dielectric function of the particle and is expressed by the equation: 1−ωp2/ω2; here, ωp is the plasma frequency of the free electron gas and ω is the resonance frequency of the localized surface plasmon in the particle. This illustrates that the resonance red-shifts as εm increases. Because the refractive index of the media (nmed) is related to the dielectric constant via nmed2 = εmed, a concomitant red-shift of plasmonic resonance wavelength with higher nmed has been revealed and explored for optical sensing using a linear relationship of resonance wavelength to nmed.[42, 43]From this perspective, Figure 2d shows resonance peak wavelengths (λres) at CD spectra depending on nmed, where the n of each solid surrounding medium was extracted with a single layer of each material from ellipsometry spectroscopy (Figure S6, Supporting Information) and the n of MAPbI3 was obtained from the previous result.[44] A consistent linear relationship of λres to nmed was observed with surrounding media of air, water, dimethyl sulfoxide (DMSO), and C60. Furthermore, the linear dependence of λres on nmed with a higher slope was observed with the surrounding media of phenyl-C61-butyric acid methyl ester (PCBM), PCBM bisadduct (bis-PCBM), and perovskites. The slope difference could be distinguished by the presence or absence of interactions between CTAB-capping AuNPs and surrounding media in solid states. A solid surrounding medium (C60) that cannot interact with CTAB or the liquid media (e.g., water or DMSO) with high fluidity produced an easy slope in a λres versus nmed plot. Note that we could not find any evidence in FT-IR analysis regarding the interaction between C60 and CTAB that caps AuNPs (Figure S7a, Supporting Information). In contrast, the surrounding media (PCBM, bis-PCBM, perovskites) capable of interacting with CTAB in solid states exhibited a steep slope in a λres versus nmed plot. Fullerene derivatives with a carbonyl functional group (e.g., bis-PCBM and PCBM) displayed carbonyl stretching peaks shifted to lower wavenumbers in FT-IR analysis, showing the strong interaction of the carbonyl group with the ammonium moiety of CTAB (Figure S7b–e, Supporting Information). These results imply that the dependence of λres on nmed can be strengthened by strong interactions between nanoparticles and surrounding media. The tightly coupled interactions in solid states may induce a stronger influence on the dielectric function of AuNPs by surrounding media in an integrated system, although a lower nmed is present in a single phase. In contrast, a loosely coupled interaction or liquid media with high fluidity may have weak or less aligned effects on the dielectric function of AuNPs.
We also investigated the chiroptical properties by checking the Mueller matrix elements related to CD (M14/M41) recorded in reflection and transmission via Mueller matrix spectroscopic ellipsometry (MMSE), as described in a previous report.[45] In MMSE for ITO/AuNPs film, the circular polarization property for M14/M41 was only observed in transmission mode, which can be elucidated by intrinsic magneto-electric coupling-induced natural optical activity that is not associated with reflection losses (i.e., differential reflection of LCPL and RCPL) (Figure S8, Supporting Information). Therefore, the chirality of AuNPs arises from the intrinsically differentiated interaction of magnetic and electric dipoles depending on LCPL or RCPL. In MMSE for the ITO/Cs0.05FA0.5MA0.45Pb0.5Sn0.5I3 film, no circular polarization property for M14/M41 was observed as expected (Figure S9, Supporting Information). For the ITO/AuNPs/ Cs0.05FA0.5MA0.45Pb0.5Sn0.5I3 film, the circular polarization property for M14/M41 in transmission was evident with spectral shifting toward the longer wavelength compared with ITO/AuNPs (Figure S10, Supporting Information). These results imply that the chirality in an integrated system consisting of AuNPs and perovskite may arise from the intrinsic natural optical activity, similar to AuNPs; spectral resonance can be modulated by the surrounding perovskite. This suggests that such a system may be used as a CPL detector if the resonance spectrum of AuNPs modulated by the surrounding medium corresponds to the absorption range of the surrounding medium.
2.3 Device Performance of CPL Detectors To elucidate the effects of chiroptical response in chiral plasmonic AuNPs-embedded perovskite on device performance in the NIR region, we first fabricated ITO/AuNPs substrates with various initial concentrations of gold precursor. The higher precursor concentration was verified by a higher density of AuNPs on ITO, as shown in Figure 3a–c. Corresponding CD spectra showed that a higher density of AuNPs on ITO induced greater degrees of CD intensities (Figure 3d). Then, we fabricated the CPL detector with the device configurations of ITO/AuNPs/Cs0.05FA0.5MA0.45Pb0.5Sn0.5I3/PCBM/C60/bathocuproine (BCP)/Ag (Figure 3e and Figure S11 in the Supporting Information). Recently, it was found that the mixed PbSn perovskite itself produces upward band-bending near the interface, which is behavior distinct from conventional lead-based counterparts.[46] This enables our HTL-free configuration to maintain photovoltaic effects comparable with full-structured solar cells. This was perfectly reflected in the current density–voltage (J–V) curve of the CPL detector, producing excellent rectifying behaviors (Figure 3f). These device characteristics enable differentiation of RCPL and LCPL under zero bias, which implies that our CPL detector can operate without external power input (i.e., self-powered mode). To highlight this strength compared with previous reports, we performed all device measurements on CPL detectors without the application of external voltages. As shown in J–V and corresponding current density–time (J–t) curves under NIR irradiation (808 nm at 3.5 mW cm−2) at zero bias (Figure 3f–i), all CPL detectors showed higher photocurrents under the RCPL than under the LCPL, regardless of precursor concentrations. This result is consistent with the CD spectra of chiral AuNPs-embedded perovskites and the CD spectroscopy-based measurement of the difference between absorbance (A) of LCPL and RCPL (ALCPL–ARCPL). Non-CPL linearly polarized light (LPL) produced values of photocurrents that were approximately intermediate between the photocurrents under RCPL and LCPL. The discrimination ability for CPL light of CPL detectors was characterized by gres in analogy to gCD, as follows,gres=−2RL−RRRL+RR(3)
where RL and RR are the responsivities under LCPL and RCPL illumination, respectively.
Device performance with various precursor concentrations of gold. Surface SEM micrographs of AuNPs deposited on ITO with precursor concentrations of a) 0.2, b) 0.3, and c) 0.4 mm. Inset shows higher magnitude SEM images. Scale bars in all SEM images indicate 10 µm. Nanoparticle densities expressed as the number of NPs per unit area (#NPs nm−2) are shown in the inset bar charts. d) CD spectra for ITO/AuNP/perovskite films with various gold precursor concentrations. e) Schematic device configuration of the CPL detector using chiral plasmonic AuNPs. J–V characteristics of CPL detectors with various gold precursor concentrations of f) 0.2, g) 0.3, and h) 0.4 mm under CPL illumination (λ: 808 nm, intensity: 3.5 mW cm−2). i) J–t curves of CPL detectors with various gold precursor concentrations. Gold precursor concentration-dependent j) gres (left axis) and R (right axis), k) D* (left axis) and EQE (right axis) of CPL detectors.
The CPL detector prepared by 0.4 mm initial concentration of gold precursor showed a prominent discrimination ability for CPL light, achieving gres of 0.55 under 808 nm CPL illumination, which is the highest gres thus far, compared with the gres values of chiral 2D perovskite-based CPL detectors.[17-21, 23] These results are also of great importance when considering that previous low-dimensional perovskite-based CPL detectors required external voltages and could not effectively detect CPL in the NIR region, thus preventing advanced applications based on NIR light absorption. Photoresponsivity (R), detectivity (D*), and external quantum efficiency (EQE) were also extracted to further characterize sensitivity to incident light in our photodetectors. Using an AuNP-dispersed aqueous solution prepared with 0.4 mm initial gold precursor concentration, we obtained an R of 0.24 A W−1, D* of 7.26 × 10¹² Jones, and EQE of 30.9% under zero bias, comparable with or slightly higher than previous chiral 2D perovskite-based CPL detectors; these findings were highly promising in that previous results were obtained under a high external voltage. We further optimized the important characteristics (e.g., R, D*, and EQE) of photodetectors by controlling the thickness of the perovskite layer, as discussed later. The higher initial concentration of gold precursor yielded the higher gres of CPL detectors, which is consistent with the higher CD signals. In contrast, the lower R, D*, and EQE were obtained with the higher concentration were obtained (Figure 3j,k), which can be attributed to the increased leakage path by the highly conductive AuNPs throughout the device; this resulted in higher dark currents (Figure S12, Supporting Information). This suggests a trade-off between those factors and gres because the figure of merits in a typical photodetector are closely related to the dark current. For higher concentrations of gold precursor (e.g., 0.6 or 0.8 mm), we could not obtain higher device performance in terms of gres, R, D*, and EQE, compared with the values obtained from the optimized precursor concentration of gold (0.4 mm) (Figure S13, Supporting Information). At concentrations above 0.4 mm, homogenous formation of AuNPs on ITO did not occur, leading to the highly aggregated morphology of AuNPs on ITO (Figure S14, Supporting Information). This aggregation would lead to many predominant shunt paths through conductive AuNPs, degrading the fill factor (FF) of the device. The light intensity-dependent device characteristics were also investigated as shown in Figure S15 in the Supporting Information; the corresponding gres, R, D*, and EQE are summarized in Figure S16 in the Supporting Information. Under all light intensities, the detector showed a discrimination ability for CPL light under zero bias, but it showed a continuously decreasing gres at lower light intensity. This is possibly because of the diminishing influence of the chiral plasmonic effect at the lower light intensity, which leads to the weaker amplified field by chiral plasmonic AuNPs. On the other hand, R, D*, and EQE continuously increased with the lower light intensity, reaching R of 0.40 A W−1, D* of 1.45 × 10¹³ Jones, and EQE of 61.5% at 5 µW cm−2 under RCPL illumination, which is a commonly observed phenomenon in typical photodetectors.[47] Additionally, the chiroptical response in visible red at around 680 nm, distinct from NIR region, implies that our detector can also be utilized for CPL detection under the wavelength. The discrimination capability of CPL in the visible red region was also verified (Figure S17, Supporting Information), where a higher photocurrent was produced under LCPL illumination than under RCPL illumination; this is consistent with the CD spectrum signal opposite to the NIR region. The lower gres of 0.04 was obtained under 650 nm (5 mW cm−2) CPL illumination at zero bias because of the lower chiroptical response, compared with the NIR region.
In addition to CPL detectors using chiral AuNP-embedded Cs0.05FA0.5MA0.45Pb0.5Sn0.5I3, we also attempted to fabricate CPL detectors with MAPbI3 as an active layer because the chiroptical response in the NIR region remains prominent in the chiral AuNP-embedded MAPbI3 system. Despite the insignificant photocurrents of MAPbI3 under the excitation at 808 nm and the poor rectifying behaviors induced by downward band bending between ITO and MAPbI3,[48] the distinction between RCPL or LCPL was feasible, yielding gres of 0.2 and 0.01 under 808 nm (3.5 mW cm−2) and 650 nm (5 mW cm−2) CPL illumination, respectively (Figure S18, Supporting Information). These findings imply that direct detection of CPL can be achieved with various types of active layers if there is at least a small amount of absorption by the active layer in the plasmonic resonance region.
To further characterize the device performance of CPL detectors, we investigated thickness-dependent device performance with a fixed precursor concentration of gold (0.4 mm). Figure 4a–c shows cross-sectional SEM images of ITO/AuNPs/ Cs0.05FA0.5MA0.45Pb0.5Sn0.5I3 with various thicknesses (250, 400, and 800 nm) of Cs0.05FA0.5MA0.45Pb0.5Sn0.5I3. AuNPs were confirmed to be embedded in an active layer where the perovskite compactly encased AuNPs without voids (yellow circles in Figure 4a–c). SEM images of the perovskite surface at various thicknesses deposited on ITO/AuNPs showed compact coverage without pinholes (Figure S19, Supporting Information). Figure 4d–f shows the J–V curves of CPL detectors under 808 nm CPL illumination at 3.5 mm cm−2 light intensity. Compared with the CPL detector containing 250 nm-thick perovskite, the thicker perovskites produced larger photocurrents. Figure 4g shows the verification of CPL detection at zero bias producing a higher photocurrent under RCPL illumination than under LCPL illumination. A slightly decreasing gres was obtained with thicker perovskites, possibly because of the reduced contribution of chiral plasmonic enhancement by AuNPs to the thicker active layer. However, as a photodetector, improved performance was achieved with thicker active layers (Figure 4h,i). For the CPL detector using 800 nm-thick perovskite, the highest R of 0.51 A W−1, D* of 2.45 × 10¹³ Jones, and EQE of 77.7% were obtained under zero bias. The improved photo-sensitivity probably originated from the higher photocurrents and the reduced leakage currents because of thicker active layers. Especially, D* was much higher compared with the state-of-the-art chiral 2D perovskite-based CPL detectors and even comparable with 3D MAPbI3-based CPL-insensitive photodetectors (≈1012–1014 Jones).[49, 50] These findings could be facilitated by chiral plasmonic AuNP-assisted CPL detection solely through the use of 3D perovskites with superior optoelectronic properties compared with 2D counterparts. Although gres decreased slightly from 0.55 at a thickness of 250 nm to 0.47 at a thickness of 800 nm, it remained the highest value reported thus far, compared with chiral 2D perovskites.

Device performance with various thicknesses of Cs0.05FA0.5MA0.45Pb0.5Sn0.5I3. SEM micrographs of a cross-section of ITO/AuNP/perovskite with thicknesses of a) 250, b) 400, and c) 800 nm. Scale bar indicates 200 nm. J–V characteristics of CPL detectors with various perovskite thicknesses (d): 250 nm, e): 400 nm, and f) 800 nm) under CPL illumination (λ: 808 nm, intensity: 3.5 mW cm−2). g) J–t curves of CPL detectors with various perovskite thicknesses. Perovskite thickness-dependent h) gres (left axis) and R (right axis), i) D* (left axis) and EQE (right axis) of CPL detectors. Normalized fluorescent photon counts of MAPbI3 films j) without or k) with AuNPs under CPL excitation (λ: 633 nm). l) Normalized decay profile for the fluorescent intensity of MAPbI3 film with AuNPs under CPL excitation.
We investigated the effects of chiral plasmonic AuNPs on the charge carrier dynamics of perovskite films by performing steady-state and time-resolved photoluminescence (TRPL) analysis of the perovskite (MAPbI3) films with or without chiral AuNPs, as shown in Figure 4j–l. MAPbI3 was utilized instead of Cs0.05FA0.5MA0.45Pb0.5Sn0.5I3 because of the NIR wavelength detection limit in our PL system. For the perovskite film without chiral AuNPs, a negligible difference in radiative photon counts was observed under 633 nm RCPL or LCPL excitation (Figure 4j). A noticeable distinction in radiative photon counts was observed depending on the CPL direction for the chiral AuNP-embedded perovskite film (Figure 4k). Considering that selective near-field electric field enhancement is induced for specific polarization direction in chiral plasmonic AuNPs upon surface plasmon excitation, the perovskite directly in contact with AuNPs would comply with such selective electric field enhancement. Consequently, distinct degrees of fluorescence intensity can be induced in perovskites for parts of the CPL direction. Stronger fluorescence under LCPL illumination than under RCPL illumination may illustrate a larger exciton population under 633 nm LCPL illumination, which is consistent with the CD spectrum of AuNPs/MAPbI3 film. On TRPL analysis, in contrast to exhibiting identical decay time profile in the perovskite without chiral AuNPs, AuNP-embedded perovskite displayed dissimilar fluorescence decay rate according to the rotation direction of the circular polarization of incident light (Figure 4l and Figure S20 in the Supporting Information). An increase in fluorescence intensity and a decrease of lifetime might be responsible for metal-enhanced fluorescence, including an increase in the excitation rate because of local field enhancement and fluorophore-metal interaction.[51, 52]
2.4 Application to Flexible CPL DetectorsA flexible CPL 9 × 9 array detector was constructed on a PEN/ITO substrate as shown in Figure 5a. The excellent rectifying behavior and the discrimination ability for CPL were completely maintained, achieving a gres of 0.49 under 808 nm CPL illumination (3.5 mW cm−2) at zero bias (Figure 5b,c). In addition, a comparable R of 0.35 A W−1, D* of 1.54 × 10¹³ Jones, and EQE of 54.2% were obtained. The mechanical flexibility of the device was examined by conducting bending tests at various bending radii, where the bending was performed for 100 cycles at each radius (Figure 5d). The flexible device showed excellent reproducibility up to a bending radius of 2.5 cm, without degrading gres, while slight decreases in gres were observed for a bending radius over 2.5 cm (Figure S21, Supporting Information). The prominent flexibility and durability were verified with a repetitive bending test for 1000 cycles at the critical 2.5 cm bending radius (Figure 5e and Figure S22 in the Supporting Information). The flexible device retained almost 90% of its initial gres after the 1000 cycle test, which suggests that the flexible CPL array possesses excellent mechanical durability and can be effectively utilized for flexible device applications. The photomapping characteristic of the fabricated flexible CPL 9 × 9 array detector is shown in Figure 5f,g. The center of the sensing matrix was directly exposed to a heart-shaped laser source of 808 nm CPL illumination. Consequently, the light-exposed region was expressed using a 2D histogram, as a function of the produced photocurrent. The higher photocurrent, produced under RCPL illumination than under LCPL illumination, was revealed as a deeper red color in the photomapping. These results represent a valuable step toward integrated 3D perovskite-based CPL detector applications capable of real-time detection of NIR CPL.

Device performance of the flexible CPL detector array. a) Photograph and schematic device configuration of the flexible CPL detector array. b) J–V and c) corresponding J–t curve for the flexible device under CPL illumination. d) gres of the flexible device with various bending radii. gres was obtained after repetitive bending for 100 cycles with each bending radius. Inset photographs show the bending degree for each bending radius. e) gres of the flexible device in bending test for 1000 cycles with the fixed bending radius of 2.5 cm. Photocurrent mapping of the photosensor matrix exposed to a heart-shaped laser source (λ: 808 nm, intensity: 3.5 mW cm−2) under f) RCPL illumination or g) LCPL illumination.
留言 (0)