
記住我
Gastric cancer is the sixth most common cancer and the third-leading cause of cancer death worldwide, with the highest incidence rates especially in Eastern Asia.1 The primary prevention of gastric cancer includes reducing intake of foods preserved by salting; increasing consumption of fresh fruits and vegetables; not smoking; and treatment of Helicobacter pylori (H. pylori) infection.2 Although H. pylori eradication therapy is well known as the most definitive method for chemoprevention of gastric cancer, it cannot fully reduce the risk of gastric cancer.3
The chemopreventive effects of cardiovascular or anti-diabetic medications such as aspirin, metformin, and statin against gastric cancer have been proposed.4-9 Aspirin acts as a chemopreventive agent by cyclooxygenase-2 (COX-2) inhibition and non-cyclooxygenase pathways such as phosphatidylinositol 3-kinase, nuclear factor-κB, Wnt-ß-catenin, extracellular signal-regulated kinase, and activated protein 1.4 Possible anti-carcinogenic mechanisms of metformin include direct activation of the 5′ adenosine monophosphate-activated protein kinase (AMPK) pathway and indirect effects from lowering the blood glucose and insulin levels.7 Statins have shown potential chemopreventive effects on various solid tumors, which are believed to be mediated by arresting cell cycle progression inducing apoptosis, inhibiting angiogenesis, and immunomodulation.10 However, those studies were based on heterogeneous populations and study designs. Besides, the effect of drugs on gastric cancer might differ by region, ethnicity, and regional prevalence of H. pylori infection. Nonetheless, few studies have assessed the drug effects on gastric cancer in countries with high incidence of gastric cancer, adjusting various confounding factors. Moreover, the chemopreventive effects of aspirin, metformin, and statin were evaluated in different studies, separately, not in the same database. Generally, these medications often could be co-prescribed in clinical practice, therefore, it is needed to evaluate the chemopreventive effects of each drug in the same database with adjusting many factors that might affect the gastric cancer.
Therefore, this study aimed to identify whether aspirin, metformin, and statin are associated with gastric cancer prevention using a nationwide population-based cohort in Korea, where gastric cancer is highly prevalent. We additionally conducted the systematic review and meta-analysis to validate our study findings.
2 METHODS 2.1 Study designThis nationwide population-based cohort study evaluated the association between potential chemopreventive drugs including aspirin, metformin, and statin on the risk of gastric cancer through the Observational Medical Outcomes Partnership Common Data Model (OMOP-CDM)-based Korean database retrospectively. The analyses were performed using Observational Health Data Science and Informatics (OHDSI), an international, open-science collaborative of more than 220 health care organizations supporting large-scale observational research with OMOP-CDM.11 To validate our findings, we conducted the systematic review and meta-analysis of previously published studies. The protocol of the current study was approved by the Institutional Review Board of Kangdong Sacred Heart Hospital (IRB no. 2019-05-014).
2.2 DatabaseWe obtained data from the National Health Insurance Service–National Sample Cohort (NHIS–NSC), a Korean nationwide cohort comprising about one million subjects.12 Korea has a single-payer health insurance system managed by the NHIS. In 2002, the NHIS established cohort data representative of the Korean population for research purposes.12 These data included a demographic profile, health insurance claims data, death registry, disability registry, and national health check-up data. The NHIS–NSC data during 2002 and 2013 were converted into the OMOP-CDM model.13 The converting process was described previously,13 and OMOP-CDM-based studies have been validated in multiple studies.14-17
2.3 Study population and cohort definitionsTo identify the impact of aspirin, metformin, and statin on gastric cancer development, we selected target (drug user) and comparator (non-drug user) cohorts from a general population; namely, all subjects included in the NHIS–NSC. As part of subgroup analysis, we also analyzed data using additional target and comparator cohorts in a diabetes mellitus (DM) population because these drugs are common medications used by patients with DM.
The target cohort was defined as subjects who were prescribed the target drugs (aspirin, metformin, or statin) for more than 365 days. The included concept identifications associated with the target drugs are listed in Table S1. The index date was defined as the date of the first prescription of the target drug (exposure). The gaps of less than 30 days between drug prescription were permitted, and it were regarded as continuous drug exposures. The comparator cohort was defined as subjects who were prescribed any other drug excluding each target drug (aspirin, metformin, or statin) for more than 365 days. The target and comparator cohorts were censored if they were diagnosed with gastric cancer or the observation period ended in the database. Subjects who met at least one of the following criteria were excluded from both target and comparator cohorts: (1) history of any previous malignant neoplasm beyond the exposure ascertainment period of 3 years before cohort entry; (2) an observation time of less than 1 year prior to cohort entry; and (3) age <18 years at cohort entry. The construction of cohorts is presented in Figure S1.
Within the target and comparator cohorts, subjects with DM were selected based on the International Classification of Diseases (ICD)-10 codes. The target cohort in the DM population was defined as subjects who received target drugs for 30 days or more within 1 year of DM diagnosis. The comparator cohort was defined as subjects who had been exposed to oral hypoglycemic agents or insulin within 1 year of DM diagnosis with no exposure to target drugs. The censoring rules were applied equally with general population.
The outcome cohort was defined as subjects who were newly diagnosed with gastric cancer after 1 year from the index date. Gastric cancer was identified using the ICD-10 diagnosis codes C16.0–C16.9, and D002 (carcinoma in situ of stomach).
2.4 OutcomesThe primary outcome was the impact of aspirin, metformin, and statin on gastric cancer prevention in a general population. The secondary outcome was the impact of those drugs on gastric cancer prevention in DM patients.
2.5 Statistical analysisOHDSI research provides large-scale propensity score models with regularized logistic regression. The following covariates were used for propensity score matching between the target and comparator cohorts: age, sex, index year, all previous comorbidities, all drugs in the 365 days prior to the index date, and Charlson comorbidity index. Of those who had health check-up, smoking history, alcohol consumption, body weight, and family history of cancer were included in covariates. To adjust for previous H. pylori eradication therapy between the target and comparator cohorts, prescribed drugs for H. pylori eradication before the index date, including proton pump inhibitors, amoxicillin, clarithromycin, bismuth, tetracycline, and metronidazole, were also included as covariates. Propensity score matching was performed in a 1:1 ratio and a caliper of 0.25 on the logit scale. Propensity score was estimated using logistic regression models with the L1 penalty hyper-parameter selected through 10-fold cross-validation using high-performance computing.18
We developed Cox proportional hazard models to calculate the hazard ratios (HRs) with 95% confidence intervals (CIs) for the risk of gastric cancer development between the target and comparator cohorts, using the CohortMethod package in R. The Kaplan–Meier method was used to estimate the cumulative incidence rates, and the cumulative incidence between two groups was compared using the log-rank test. To evaluate the robustness of the main analysis results, multiple sensitivity analysis was conducted with various case–control ratios and lag periods. Empirical calibration of the p-values was conducted by fitting an empirical null distribution to point estimates of negative control outcomes, which were expected to not be related with the target or comparator cohort and assumed that true relative risk between the target and comparator cohorts was 1.19 Ninety selected negative control outcomes are listed in Table S2.
Two-sided p-values <0.05 were considered statistically significant in all comparisons. All analyses were performed using ATLAS ver. 2.7 and R statistical software (version 3.6.1 for Windows; R Foundation for Statistical Computing).
2.6 Systematic review and meta-analysisFor the systematic review and meta-analysis, we searched the MEDLINE, EMBASE, and Cochrane Library databases for all relevant studies published between 1980 and 2020 that examined the risk of gastric cancer development according to the administration of aspirin, metformin, or statin. The detailed search strategies and latest search date are shown in Appendix S1.
The inclusion criteria were (a) population: adults in community- or hospital-based cohorts; (b) intervention: administration of aspirin, metformin, or statin; (c) comparator: no administration of aspirin, metformin, or statin; (d) outcome: gastric cancer development; and (e) study design: cohort or case–control studies. Non-original studies, non-human studies, abstract-only publications, and studies published in languages other than English were excluded.
We first reviewed the titles and abstracts of the studies identified by our keyword search. Duplicates from multiple databases were removed, and irrelevant studies were then excluded according to the inclusion and exclusion criteria. Finally, we screened the full texts of the remaining studies. Two investigators (S.I.S. and C.H.P.) independently evaluated the studies for eligibility. Any disagreements were resolved through discussion and consensus. If agreement could not be reached, a third investigator (W.G.S.) determined the final eligibility.
Data were extracted using a data extraction form that had been developed in advance. Two investigators (S.I.S. and C.H.P.) independently extracted information on the first author; year of publication; study design; country; study period; publication language; definitions of aspirin, metformin, or statin use; and the risk of gastric cancer development according to the groups. As the primary outcome of the meta-analysis, we analyzed the pooled risk of gastric cancer development according to the type of medication (aspirin, metformin, and statin) based on all relevant studies. Then, we further demonstrated the risk of gastric cancer development in studies of diabetic patients only, if possible. Besides, subgroup analyses according to study regions (Eastern vs. Western studies) were performed.
For the meta-analysis, pooled odds ratios (ORs) or HRs with 95% CIs were calculated. A random-effects model was utilized in the meta-analyses. We assessed heterogeneity using two methods: Cochran's Q test, wherein p-values <0.1 were considered statistically significant for heterogeneity, and I2 statistics, wherein values >50% were suggestive of significant heterogeneity.20 All p-values were two-tailed, and p-values <0.05 were considered statistically significant in all tests in the meta-analyses except for heterogeneity. Analysis and reporting were performed in accordance with the Preferred Reporting Items for Systematic Reviews and Meta-Analyses (PRISMA) guidelines.21 All meta-analyses were conducted using the statistical software Review Manager 5.4 (version 5.4.0; Cochrane Collaboration, Copenhagen, Denmark) and R (version 4.0.2; R Foundation for Statistical Computing, Vienna, Austria).
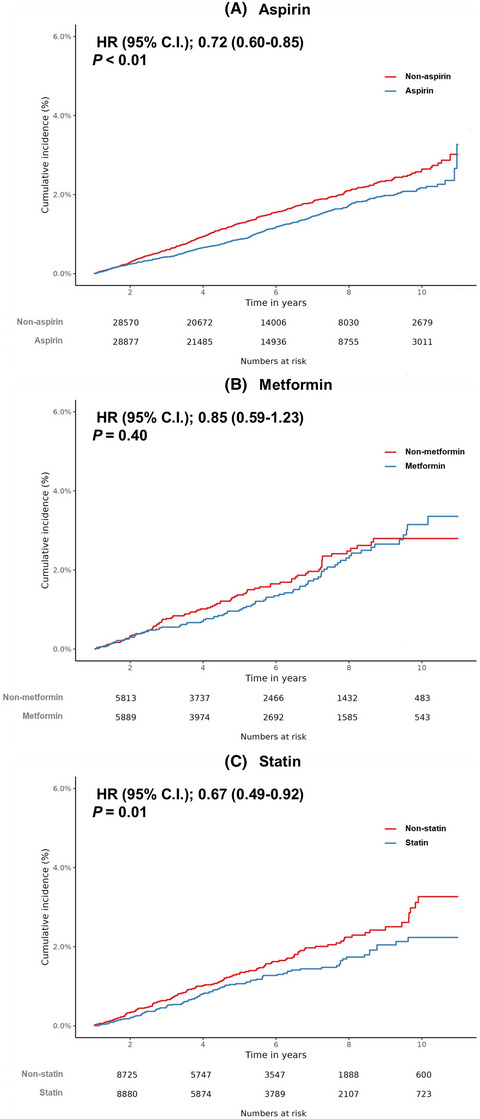
3 RESULTSA total of 1,025,340 subjects in the NHIS–NSC were eligible in our study. The attrition flow charts of each drug are summarized in Figure S2. After large-scaled propensity score matching, a total of 31,839, 6764, and 10,251 subjects were included in the final analysis for aspirin, metformin, and statin, respectively. The covariates balance before and after propensity score matching are presented in Figure S3. Overall, the differences in covariates before propensity score matching were well resolved after matching. To assess for systematic errors in our study populations, the relative risks of the target drugs (aspirin, metformin, and statin) for negative control outcomes were plotted in funnel plots (Figure S4). The plots showed no asymmetry and most negative control outcomes showed no significant difference between two cohorts. The baseline subject characteristics in the target and comparator cohorts are described in Table 1. The most common medical history was hypertensive disorder for aspirin user, DM for metformin user, and hyperlipidemia for statin user. The most common medication was antibacterial use, followed by drugs for acid-related disorders in all analyses. We adjusted for medications that may alter the risk of gastric cancer including aspirin, metformin, statin, and nonsteroidal anti-inflammatory drugs (NSAIDs), and the covariates were well matched (Table 1). Of the anti-inflammatory drugs and antirheumatic products, the detailed proportion of each drug of NSAIDs is presented in Table S3.
TABLE 1. Baseline characteristics in the analysis of aspirin, metformin and statin Characteristic,% After propensity score adjustmentAspirin
(n = 31,839)
Non-aspirin
(n = 31,839)
SMDMetformin
(n = 6764)
Non-metformin
(n=6,764)
SMDStatin
(n = 10,251)
Non-statin
(n = 10,251)
SMD Index year 2003 12.5 12.9 −0.01 11.8 14.4 −0.08 9 9.3 −0.01 2004 10.8 10.8 0.00 9.8 9.9 0 7.6 7.7 0 2005 11.1 11.2 0.00 9.6 9.7 0 8.8 9.1 −0.01 2006 10.6 10.7 −0.01 8.2 7.8 0.02 8.6 8.9 −0.01 2007 10.0 9.8 0.01 8.7 8.4 0.01 9.1 8.7 0.01 2008 9.7 9.8 0.00 8.6 7.5 0.04 9.4 9.6 −0.01 2009 8.8 8.6 0.01 8.2 8.1 0 9.9 10.3 −0.01 2010 8.3 8.0 0.01 9.1 8.7 0.01 10.7 10.4 0.01 2011 11.2 11.4 −0.01 15.6 15.2 0.01 15.4 14.1 0.03 2012 7.0 6.7 0.01 10.4 10.3 0 11.6 11.9 −0.01 Age group 20–24 0.1 0.1 0 0.2 0.2 0.01 0.3 0.4 −0.02 25–29 0.2 0.2 0.01 0.3 0.5 −0.02 0.6 0.7 −0.02 30–34 0.6 0.5 0.01 1.3 1.3 0 1.6 1.8 −0.02 35–39 2.4 2.2 0.01 3.1 2.6 0.03 4 4.1 −0.01 40–44 5.9 5.8 0 6 5.6 0.02 7.8 7.8 0 45–49 11.3 11.4 0 10.4 9.9 0.02 12 12.3 −0.01 50–54 15.6 15.5 0 14.9 13.5 0.04 16 14.9 0.03 55–59 15 15.3 −0.01 13.9 14.3 −0.01 14.5 14.3 0.01 60–64 14.6 15 −0.01 14.8 15 −0.01 13.1 13.1 0 65–69 13.4 13.3 0 13.9 14.4 −0.01 11.9 11.9 0 70–74 9.7 9.6 0 10 10.6 −0.02 9 8.8 0.01 75–79 6.2 6.2 0 7 7.2 −0.01 5.3 5.7 −0.01 80–84 3.2 3.4 −0.01 3 3.4 −0.02 2.8 2.8 0 85–89 1.5 1.3 0.01 1.1 1.2 −0.01 0.9 0.9 0 90–94 0.3 0.2 0.01 0.1 0.2 −0.03 0.1 0.2 −0.01 Gender: female 52.5 52.1 0.01 49.5 49.9 −0.01 51.4 51.2 0 Cigarette smoker 5.4 5.3 0 4.9 4.7 0.01 5.4 5.6 −0.01 Medical history Acute respiratory disease 56.4 56 0.01 55.9 54.7 0.02 57.9 58.2 −0.01 Chronic liver disease 6.3 6.2 0 9.2 10 −0.03 10.6 11.4 −0.02 Depressive disorder 6.4 6 0.02 7.6 8 −0.02 8.4 8.6 −0.01 Diabetes mellitus 23.6 23.9 −0.01 71.3 81.1 −0.23 31.1 31.7 −0.01 Gastroesophageal reflux disease 7.5 7.1 0.02 8.3 8.5 −0.01 9.5 9.5 0 Hyperlipidemia 32.9 32.6 0.01 46.6 50.2 −0.07 70.1 73 −0.06 Hypertensive disorder 78.7 82.2 −0.09 61.8 64.2 −0.05 66.6 66.7 0 Osteoarthritis 14.9 14.8 0 15.1 14.8 0.01 14.6 14.6 0 Visual system disorder 32.9 32.6 0.01 37.2 37 0 36 35.9 0 Cerebrovascular disease 5.8 5.6 0.01 5.8 6.6 −0.03 7.3 7.2 0 Heart disease 23.1 22.4 0.02 25.5 27.7 −0.05 29.6 30.3 −0.02 Heart failure 5 5 0 5.5 6.3 −0.03 6.4 6.3 0 Ischemic heart disease 9.5 8.7 0.03 14.4 15.2 −0.02 16.3 16.8 −0.01 Peripheral vascular disease 16.6 16.4 0 21.2 21.4 0 18.2 18.8 −0.02 Medication use Drugs for H. pylori eradication 4.3 4.2 0.01 4.7 4.7 0 5.4 5.3 0 Agents acting on the renin-angiotensin system 38.2 39.7 −0.03 38 39 −0.02 39 39 0 Antibacterials for systemic use 63.8 63.2 0.01 64.4 63.8 0.01 66.5 67 −0.01 Antidepressants 9.8 9.3 0.02 12 11.5 0.02 11.5 11.5 0 Antiepileptics 6 5.7 0.01 7.1 6.9 0.01 7 7.1 0 Anti-inflammatory and antirheumatic products 56.5 56.1 0.01 56.1 55 0.02
留言 (0)