
記住我
Although cancer in children is rare, it is the second leading cause of death among children in high-income countries.1 Central nervous system (CNS) tumors are the most common solid malignancy in childhood, representing 20% of all cancers observed in children.2 Furthermore, the mortality rate is high. Thus, CNS tumors contribute considerably to the overall childhood cancer incidence and mortality of childhood cancer. A study of the international incidence of childhood cancer between 2001 and 2010 reported an increase in the global incidence of childhood cancer, including CNS tumors.3 However, the incidence of CNS tumors varied across populations and appeared to be highest (>20 per million person-years) in high-income countries including the United States and the Nordic countries,4-7 and lowest in low- and middle-income countries.7 Whether the high incidence can be explained by biological factors, the availability of better diagnostic facilities, and/or more complete registration of cancer diagnoses in national registries remains uncertain.8-10 Since 1943, data on the incidence of cancer in the Danish population have been registered in the Danish Cancer Registry. Using these complete and comprehensive Danish data, a recently published study10 reported an increase in childhood CNS tumors, with an age-standardized rate reaching 43.8 per million person-years in 1977–2014, but the study lacked detailed information on histological types and treatment. In Europe, annual incidence rates range from 22 to 44 per million person-years and increased from the 1980s to the 1990s,5, 8, 11 with a decline or stabilization in the years after 2000.2, 3, 6, 12, 13
Historically, survival of pediatric CNS tumors has improved in Denmark, from a 5-year survival rate of 66% in the 1980s to stable rates of 70%–80% from 2000 to 2020 according to WHO databases.14, 15
Changes in incidence and survival are caused by numerous factors such as access to health care and improved diagnostic and treatment facilities,3 and studies reporting the development over time can form the basis for etiological research and monitor the progress in treatment of childhood cancer. As CNS tumors are a heterogeneous group of malignancies with varied incidences and survivals, detailed tumor information is crucial in these types of studies. Thus, in the present study, we analyzed incidence and survival in children with CNS tumors in Denmark diagnosed, 1997–2019, according to histological type and tumor localization. We also reported the treatment modalities of distinct CNS tumors that have not previously been reported in Danish children in incidence and survival studies.
2 MATERIALS AND METHODS 2.1 Patient cohortSince 1985, all children diagnosed with cancer in Denmark have been registered by clinicians in the nationwide clinical database, the Danish Childhood Cancer Registry (DCCR), with the overall aim of monitoring the quality of childhood cancer care in Denmark.16 The DCCR is linked to the Danish National Patient Registry, the National Pathology Registry, and the Danish Cancer Registry using the unique national identification number assigned to all permanent residents in Denmark at birth or immigration. We obtained information on all children below 15 years of age, living in Denmark who had a primary CNS tumor diagnosed from 1 January 1997 to 31 December 2019 (n = 1093), including information on known syndromes predisposing to CNS tumors (neurofibromatosis type 1 or 2, tuberous sclerosis, Gorlin–Goltz, or multiple endocrine neoplasia type 1), histological type, treatment for first primary tumor, and survival. All patients with neurofibromatosis type 1 or 2 and low-grade glioma as well as patients with tuberous sclerosis and subependymal giant cell astrocytoma were registered. Children with other tumors in the CNS such as Langerhans cell histiocytosis, lipoma, lymphoma, hemangioma, hamartoma, sarcoma, and bone sarcoma were excluded (n = 144), as they are not classified as classical CNS tumors. Information on children aged 15–18 years was not complete for the entire study period and was therefore not included. The final patient cohort consisted of 949 children.
To describe overall and specific treatment modalities, we validated all information on tumor localization and treatment characteristics obtained from the DCCR. Missing information was obtained by systematically reviewing and abstracting relevant information from all medical reports except 62 (6.5%), which were not available.
2.2 Tumor classificationTumors were classified according to localization: cerebellum, cerebrum, supratentorial central area, brain stem, hypothalamic and pituitary area, optic nerve or chiasma, pineal gland, or intraspinal. Both benign and malignant tumors were classified histologically on the basis of the International Classification of Diseases for Oncology (ICD-O)17 according to main diagnostic group III CNS and miscellaneous intracranial and intraspinal neoplasms and the subgroup Xa Intracranial and intraspinal germ cell tumors in the International Classification of Childhood Cancer, third edition (ICCC-3) (Table S1).7 According to 2016 CNS WHO,18 we adopted the terminology “embryonal CNS Tumor NOS” to replace primitive neuroectodermal tumor (CNS-PNET). Atypical teratoid/rhabdoid tumor (ATRT) was incorporated in the ICD-O as a new entity in 2000. Optic nerve glioma and brain stem glioma were accepted without biopsy due to characteristic presentation.
2.3 Statistical methods 2.3.1 IncidenceThe overall age-specific incidence rates (ASI) per million person-years were calculated for all types of CNS tumors in the three age groups 0–4 years, 5–9 years, and 10–14 years according to date of birth and calendar year, with the annual Danish population at midyear from Statistics Denmark19 as the denominator. ASI was calculated for specific histological types and localization in children aged 0–4 years, 5–9 years, and 10–14 years and separately for boys and girls.
Age-standardized incidence rates (ASRs) expressed per million person-years were derived by direct standardization, using the weight of the world standard population as proposed by Segi20 in order to compare with other countries and to eliminate changes in the age distribution during the study period. ASRs were calculated overall and for each year.
Finally, we evaluated changes in incidence rate over time by analyzing the age-standardized incidence rates using restricted cubic spline smoother for the year of diagnosis with four knots, in a Poisson regression model. A joint post hoc test of the coefficients of the higher order spline variables gave a formal test for nonlinear trend.
2.3.2 SurvivalSurvival was defined as time from diagnosis to death from any cause and presented with median with lower and upper quartiles. Patients were censored at date of emigration or 31 December 2019, whatever occurred first. We calculated both 5- and 10-year overall survival (OS) for all histological types combined and for specific subgroups for the entire study period and for the two time periods (1997–2008 and 2009–2019) separately. All survival rates were reported with 95% confidence intervals (95% CIs). Survival function was estimated by the Kaplan–Meier method and presented in plots in children aged 0–4 years and 5–14 years to facilitate comparison with previous studies. The difference in survival functions was estimated with the log-rank test. Two children died at birth. To include these two cases in the survival analyses, 1 day was added to all cases.
Survival function and 95% CIs for each gender, age group, time period, and localization were calculated for individual tumor types. To identify possible factors influencing survival, the risk of death according to gender, age group, time period, and localization was estimated by hazard ratios (HRs) and their 95% CIs using univariate and multivariate Cox proportional hazards regression models. Reference categories were selected logically as the first category (boys, children aged 0–4 years, supratentorial location, 1998–2008).
3 RESULTS 3.1 Patient cohortAfter exclusion of the 144 non-CNS tumors, we identified 949 children (468 girls, 49.3%) diagnosed with a CNS tumor in Denmark who were younger than 15 years of age at diagnosis. On average, 41.3 new cases were diagnosed annually (Table 1). Children aged 0–4 years accounted for 38.2% of all the cases, followed by children aged 5–9 years (33.7%) and children aged 10–14 years (28%). The median follow-up time was 7.5 years (quartiles 1.8–14.9). Around 7% (n = 69) had a predisposing condition: 55 children (5.8%) were diagnosed with neurofibromatosis 1 or 2, 10 (1.1%) with tuberous sclerosis, and 4 (0.4%) with either Gorlin–Goltz syndrome or multiple endocrine neoplasia type 1.
TABLE 1. Characteristics of children <15 years diagnosed with a CNS tumor in Denmark, 1997–2019 n % Patients 949 100 Gender Girls 468 49.3 Boys 481 50.7 Median follow-up (interquartile range) 7.5 (1.8–14.9) Year of diagnosis 1997–2005 377 39.7 2006–2013 319 33.6 2014–2019 263 27.7 Age at cancer diagnosis 0–4 363 38.2 5–9 320 33.7 10–14 266 28.0 Location of tumor Cerebellum 342 36.0 Cerebrum 179 18.9 Supratentorial central area 89 9.4 Hypothalamus or pituitary region 84 8.9 Brain stem 73 7.7 Optic nerve or chiasma 65 6.8 Intraspinal 45 4.7 Pineal gland 22 2.3 Unknown 50 5.3 Predisposing syndrome Neurofibromatosis type 1 or 2 55 5.8 Tuberous sclerosis 10 1.1 Gorlin–Goltz or multiple endocrine neoplasia type 1 4 0.4 Cancer treatment Surgery (only) 374 39.4 Chemotherapy 328 34.6 Radiation 293 30.9 No treatment 93 9.7 No treatment information 41 4.3 Surgery 748 Macroscopically complete 418 55.9 Partial resection 211 28.2 Biopsy only 86 11.5 Extent unknown 33 4.4 3.2 Treatment characteristicsIn total, 374 (39%) children were treated only surgically and 93 patients were observed without therapy (Table 1). Surgery, either alone or combined with radiation or chemotherapy, was performed in 748 children (79%) ranging from macroscopically complete resection (n = 418) to partial resection (n = 211) and biopsy (n = 86). In 33 (4.4%) children undergoing surgery, the extent of surgery was unknown. Chemotherapy was administered in 328 (35%) children and radiotherapy in 293 (31%) children. Treatment with radiotherapy was equally distributed in the two time periods: 12.6 children per year received radiotherapy in 1997–2008 (30.5% of children diagnosed) compared to 12.9 children per year from 2009 to 2019 (31.2% of children diagnosed). More children were treated with chemotherapy in 2009–2019 (183/494, 37.0% of children diagnosed) compared to 1997–2008 (145/455, 31.9%). Information about radiation fields was not available.
3.3 Tumor localization and subgroups according to ICCC-3The most predominant tumor location was the cerebellum (n = 342, 36%) followed by the cerebrum (n = 179, 19%), supratentorial central area (n = 89, 9.4%), hypothalamus or pituitary region (n = 84, 8.9%), brain stem (n = 73, 7.7%), optic nerve or chiasma (n = 65, 6.8%), intraspinal (n = 45, 4.7%), and pineal gland (n = 22, 2.3%) (Table 1). The most common histological types were astrocytoma (n = 385, 40.6%) followed by embryonal tumors (n = 160, 16.9%) (Table 2). In 171 cases (18%), the diagnoses were not verified histologically, because it was not necessary to establish the diagnosis or the tumor was surgically inaccessible (data not shown).
TABLE 2. Subgroups according to the International Classification of Childhood Cancer, third edition (ICCC-3) of all CNS tumors diagnosed in Denmark in children <15 years from 1997 to 2019 presented with median age, gender distribution, and treatment information n % of CNS tumors Age at diagnosis, median (range)Gender distribution,
Girls, n
% Surgery (n) Chemotherapy (n) Radiation (n) All CNS tumors 949 100 7.0 (0–15) 468 49.3 748 328 293 IIIa. Ependymomas and choroid plexus tumor 77 8.1 3.0 (0.1–14.9) 35 45.5 73 31 38 IIIa1. Ependymoma 56 — 5.1 (0.1–14.9) 21 37.5 53 25 35 IIIa2. Choroid plexus tumor 21 — 1.0 (0.2–10.6) 14 66.7 20 6 3 IIIb. Astrocytomas 385 40.6 6.7 (0–14.9) 21 55.6 309 96 62 IIIb1. Pilocytic 200 — 7.1 (0.1–14.7) 111 55.5 192 31 17 IIIb2. Optic glioma 50 — 3.8 (0.4–12.1) 33 66.0 11 23 6 IIIb3. Glioblastoma 23 — 8.0 (0.9–14.5) 12 52.2 20 16 14 IIIb4. Anaplastic 17 — 8.0 (3.0–14.7) 10 58.9 16 9 12 IIIb5. Diffuse 15 — 9.2 (1.0–13.8) 8 53.3 14 5 4 IIIb6. Subependymal giant cell 12 — 9.9 (0.4–14.9) 5 41.7 11 <3 0 IIIb7. Pleomorphic xanthoastrocytoma 9 — 10.3 (3.7–13.5) 7 77.8 8 <3 <3 IIIb8. Pilomyxoid 4 — 9.8 (2.9–14.1) 2 50.0 4 <3 0 IIIb9. Fibrillary 4 — 2.7 (0.74–13.3) 3 75.0 4 <3 0 Other 51 — IIIc. Intracranial and intraspinal embryonal tumors 160 16.9 5.7 (0–14.3) 72 45.0 150 130 113 IIIc1. Medulloblastoma 124 — 5.9 (0.1–14.3) 50 40.3 118 105 91 IIIc2. Embryonal CNS tumor NOS 16 — 7.1 (0.6–12.3) 8 50.0 15 10 9 IIIc3. Medulloepithelioma <6 — — — — — — — IIIc4. Atypical teratoid/rhabdoid tumor 19 — 1.3 (0–11.5) 14 73.7 16 15 13 IIId. Other gliomas 66 7.0 6.9 (0.6–15.0) 31 47.0 33 24 26 IIId1. Oligodendroglioma 13 — 9.4 (0.6–15.0) 7 53.9 12 3 3 IIId2. Mixed and unspecified glioma 53 — 6.2 (1.1–14.8) 24 45.3 21 23 23 IIIe. Other specified intracranial and intraspinal neoplasms 152 16.0 8.8 (0–15) 67 44.1 129 15 24 IIIe1. Pituitary adenoma and carcinoma 25 — 10.2 (0.9–14.8) 9 36.0 15 <3 2 IIIe2. Craniopharyngioma 35 — 7.4 (0–14.5) 16 45.7 34 0 6 IIIe3. Pineal parenchymal tumor 11 — 11.1 (0.9–15.0) 7 63.6 4 3 5 IIIe4. Mixed glial-neuronal tumor 40 — 9.6 (0–14.4) 20 50.0 38 9 8 IIIe5. Dysembryoblastic neuroepithelial tumor (DNET) 18 — 10.1 (0.4–14.3) 3 16.7 17 <3 <3 IIIe6. Ganglioglioma 17 — 8.8 (0.6–14.7) 10 58.8 15 0 <3 IIIe7. Schwannoma <6 — 8.1 (1.4–14.9) 2 33.3 6 <3 0 IIIf. Unspecified intracranial and intraspinal neoplasms 15 1.6 8.7 (0.0–13.5) 5 33.3 14 <3 <3 IIIf1. Meningioma 15 — 8.7 (0–13.5) 5 33.3 14 <3 <3 Xa. Intracranial and intraspinal germ cell tumors 32 3.4 9.8 (0.0–14.7) 16 50.0 28 22 21 Xa1. Germinoma 18 — 10.4 (13.9–14.7) 8 44.4 15 17 17 Xa2. Non-germinoma germ cell tumors 14 — 3.7 (0–14.7) 8 57.1 13 4 4 Unclassified 62 6.5 6.5 (0.0–14.1) 28 45.2 12 8 7Medulloblastoma (n = 124, 50 girls) was diagnosed predominantly in children aged 5–9 years (n = 54), followed by children aged 0–4 years (n = 46) and less frequently at 10–14 years (n = 24) (Table S2). ATRT (n = 19, 14 girls) was diagnosed primarily in the very young children. The majority of these children received both chemotherapy (n = 16) and radiation (n = 13), two received only radiation, and treatment information was unavailable in two children.
Looking further into tumors in children <24 months at diagnosis (n = 147, 76 girls), the three most dominant histological types were astrocytoma (n = 48), including 21 with pilocytic astrocytoma, medulloblastoma (n = 16), and ATRT (n = 16) (Table S2).
The three most dominant histological types among children with tumors with an intraspinal location (n = 45, 22 girls) were astrocytoma (n = 15), other specified intraspinal neoplasm (n = 15), and ependymoma (n = 9) (Table S4).
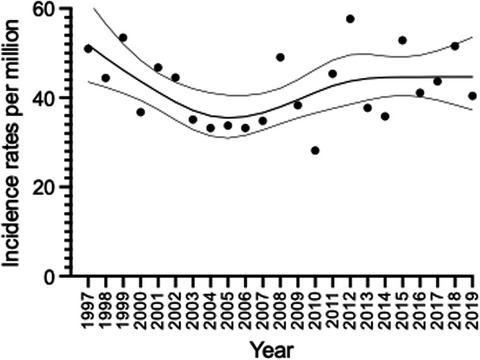
3.4 Age-standardized and age-specific incidencesThe overall ASR for the entire study period was 42.1 (95% CI 39.6–44.9, Figure 1). The overall ASR for brain tumors only was 40.1 (95% CI 37.6–42.8) per million person-years.

Age-standardized incidence rates (dots) with a smoothing spline with 95% CI (grey lines) of childhood CNS tumors in Denmark diagnosed from 1997–2019 in children aged 0–14 years including all subgroups as classified as CNS in ICCC-3
ASR was clinically stable from 1997 to 2019 within the ran
留言 (0)