
記住我
Nasopharyngeal carcinoma is a unique head and neck cancer with unbalanced endemic distribution. Approximately 133,354 new patients were reported worldwide in 2020, with the high rates occurring in Southeastern Asia.1 Radiotherapy is the cornerstone of nasopharyngeal carcinoma treatment, due to its high sensitive to radiation. For stage I nasopharyngeal carcinoma, radiotherapy alone is the main curative treatment; however, whether stage II nasopharyngeal carcinoma could benefit from concurrent chemotherapy remains controversial. A prospective phase III study showed that concurrent chemoradiotherapy brought survival benefit for stage II nasopharyngeal carcinoma compared with two-dimensional radiotherapy alone.2, 3 Since intensity-modulated radiotherapy dramatically improved survival outcomes of nasopharyngeal carcinoma, omitting chemotherapy was considered for stage II patients in intensity-modulated radiotherapy era. Several retrospective studies reported that concurrent chemoradiotherapy had comparable survival to intensity-modulated radiotherapy alone for patients with stage II nasopharyngeal carcinoma,4-6 and a prospective study enrolling 84 patients also confirmed this conclusion.7 Intriguingly, a retrospective study based on National Cancer Database from the United States reported concurrent chemoradiotherapy improved survival of stage II nasopharyngeal carcinoma compared with intensity-modulated radiotherapy alone.8 Similarly, a study demonstrated stage II nasopharyngeal carcinoma from nonendemic region could benefit from addition of concomitant chemotherapy in intensity-modulated radiotherapy era.9 Given the inconsistent conclusions, finding a way to guide individualized treatment is needed.
Tumor volume was a significant prognostic factor in nasopharyngeal carcinoma. Lu et al.10 reported patients with gross tumor volume of nasopharynx higher than 20 ml had lower survival rates. Likewise, gross volume of lymph node had significant prognostic value in nasopharyngeal carcinoma,11-14 and another study showed total tumor volume as an independent prognostic factor can improve prognostic validity of clinical stage.15 Pretreatment plasma Epstein–Barr virus (EBV) DNA has been widely used for prognosis and risk stratification. When tumor volume combined with EBV DNA, it can be better used for risk stratification in nasopharyngeal carcinoma.10, 12, 14 A recent study developed an integrated gross tumor value of cervical lymph node and EBV DNA model to predict survival and guide treatment for patients receiving induction chemotherapy.14 Chen et al. combined tumor volume and EBV DNA for prognostic stratification in patients with stage II nasopharyngeal carcinoma, however, patients who can gain survival benefit from concurrent chemoradiotherapy have not been identified in that study.16 Therefore, we aimed to develop and prospectively validate a risk score model to guide individualized concurrent chemoradiotherapy for stage II nasopharyngeal carcinoma patients in intensity-modulated radiotherapy era.
2 MATERIALS AND METHODS 2.1 Patients and study designA total of 1220 stage II nasopharyngeal carcinoma patients who received intensity-modulated radiotherapy at Sun Yat-sen University Cancer Center were included in this study. Among them, 1026 patients between March 2007 and December 2016 were randomly divided at ratio of 7:3 into a training cohort (n = 719) and a validation cohort (n = 307). And the prospective test cohort (n = 194) was a subset of our prospective observational study (Name: A Prospective Cohort Study of Nasopharyngeal Carcinoma to Establish Prognostic Models, to Discover Toxicity Associated Predictors and to Validate Randomized Trials in Clinical Practice. ClinicalTrials.gov Identifier: NCT03003182) since May 2017. The flow chart is shown in Figure 1. The clinical data were extracted from the nasopharyngeal carcinoma-specific real-world dataset based on a big-data intelligence platform. The inclusion criteria were as follows: (1) newly diagnosed with stage II nasopharyngeal carcinoma including subgroups of T1N1M0, T2N0M0, and T2N1M0; (2) receipt of intensity-modulated radiotherapy with or without concurrent chemotherapy; and (3) complete pretreatment head and neck magnetic resonance imaging (MRI) and EBV DNA. All patients were restaged according to eighth edition American Joint Committee on Cancer/Union for International Cancer Control staging system.

Flowchart of eligible patients. CCRT, concurrent chemoradiotherapy; IMRT, intensity-modulated radiotherapy
This study was approved by the institutional review board at Sun Yat-sen University Cancer Center (No. B2020-263) and informed consents were obtained.
2.2 Tumor volume measurementAll pretreatment head and neck MRI were obtained from picture archiving and communication system, and uploaded into ITK-SNAP software (version 3.8.0; www.itksnap.org) to delineate regions of interest (ROIs). ROIs including the gross tumor volume of nasopharynx and lymph nodes were re-outlined manually by a radiation oncologist (PYOY, 10 years of experience in contouring nasopharyngeal carcinoma) at each slice of axial contrast-enhanced T1-weighted, T1-weighted, and T2-weighted images (Figure S1) and checked by an expert radiation oncologist (FYX, over 30 years of experience in treating nasopharyngeal carcinoma). Then, the delineated gross tumor volumes were extracted by python software (https://github.com). The total tumor volume was equal to the gross tumor volume of nasopharynx plus gross tumor volume of lymph nodes. The protocol of MRI is deposited in Data S1.
2.3 Pretreatment plasma EBV DNABlood sample was gathered from enrolled patients for detection of plasma EBV DNA before treatment, and sample was measured by fluorescence polymerase chain reaction. The detailed method is shown in Data S1. And the cut-off value of pretreatment plasma EBV DNA was defined as 2000 copy/ml based on previous study.17
2.4 Treatment and follow-upAll eligible patients underwent radical intensity-modulated radiotherapy. According to guideline, the prescribed doses of primary tumor and metastatic lymph nodes were 66–72 Gy and 64–70 Gy, respectively. Concurrent chemotherapy plan included weekly (30–40 mg/m2) or three-weekly (80–100 mg/m2) cisplatin regimen. The detailed treatment is described in Data S1.
Follow-up was conducted every 3–6 months during the first 2 years, and every 6 months to 1 year thereafter. During the follow-up period, the routine examinations included nasopharyngoscopy, plasma EBV DNA, MRI, and computed tomography of chest and abdomen. And fluorine-18-fluorodeoxyglucose positron emission tomography/computed tomography and/or biopsy were conducted if necessary.
2.5 Statistical analysisThe primary endpoint was failure-free survival (FFS), which was computed from treatment to failure (locoregional recurrence or distant metastasis). The secondary endpoint was locoregional relapse-free survival (LRFS, defined as the time from treatment to locoregional recurrence).
The cut-off values of continuous variables were determined by time-dependent receiver operating characteristic (ROC) curve analysis. Survival rates were calculated through the Kaplan–Meier method and compared by the log-rank test. Univariate and multivariate Cox regression analyses were performed to select risk factors. The risk score model was developed in the training cohort, and validated in the validation and prospective test cohorts. Statistical analysis was conducted with SPSS 26.0 and R software (version 4.0.1; http://www.r-project.org/). And a two-sided p < 0.05 was defined as statistically significant.
3 RESULTS 3.1 Patient characteristicsA total of 1220 eligible patients were enrolled, including 719 patients in the training cohort, 307 patients in the validation cohort, and 194 patients in prospective test cohort. As shown in Table 1, patients with EBV DNA ≥2000 copies/ml counted for 49.7%, 45.3%, and 26.7% in the training, validation, and prospective test cohorts. The cut-off value of total tumor volume was 11 ml for FFS (3-year area under the curve [AUC]: 0.602, Figure S2) in the training cohort. With median follow-up time of 76, 77, and 30 months in the training, validation, and prospective test cohorts, 15.6% (112/719), 14.0% (43/307), and 6.2% (12/194) of patients suffered from treatment failure. The 3-year FFS was 91.9%, 94.0%, and 88.7% in the training, validation, and prospective test cohorts, respectively.
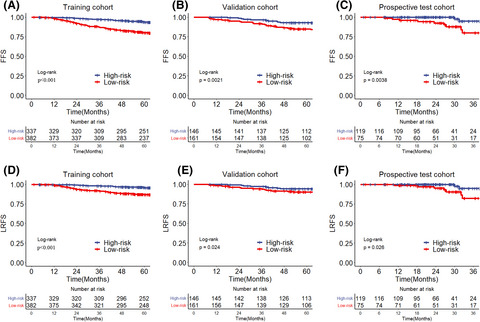
TABLE 1. Baseline characteristics of high-risk and low-risk patients in the training, validation, and prospective test cohorts Training cohort p Validation cohort p Prospective test cohort p Low-risk group High-risk group Low-risk group High-risk group Low-risk group High-risk group N = 337 N = 382 N = 146 N = 161 N = 119 N = 75 N (%) N (%) N (%) N (%) N (%) N (%) Sex 0.676 0.053 0.862 Female 101 (30.0) 108 (28.3) 50 (34.2) 38 (23.6) 36 (30.3) 21 (28.0) Male 236 (70.0) 274 (71.7) 96 (65.8) 123 (76.4) 83 (69.7) 54 (72.0) Age 0.476 0.066 0.71 <45 174 (51.6) 186 (48.7) 77 (52.7) 67 (41.6) 51 (42.9) 35 (46.7) ≥45 163 (48.4) 196 (51.3) 69 (47.3) 94 (58.4) 68 (57.1) 40 (53.3) T stage 0.961 0.523 0.073 T1 95 (28.2) 106 (27.7) 41 (28.1) 39 (24.2) 41 (34.5) 16 (21.3) T2 242 (71.8) 276 (72.3) 105 (71.9) 122 (75.8) 78 (65.5) 59 (78.7) N stage <0.001 <0.001 0.006 N0 120 (35.6) 35 (9.2) 70 (47.9) 21 (13.0) 40 (33.6) 11 (14.7) N1 217 (64.4) 347 (90.8) 76 (52.1) 140 (87.0) 79 (66.4) 64 (85.3) Overall stage <0.001 <0.001 <0.001 T1N1M0 95 (28.2) 106 (27.7) 41 (28.1) 39 (24.2) 41 (34.5) 16 (21.3) T2N0M0 120 (35.6) 35 (9.2) 70 (47.9) 21 (13.0) 40 (33.6) 11 (14.7) T2N1M0 122 (36.2) 241 (63.1) 35 (24.0) 101 (62.7) 38 (31.9) 48 (64.0) Pathology 0.531 0.522 1 WHO I 0 (0.0) 1 (0.3) WHO II 5 (1.5) 8 (2.1) 0 (0.0) 2 (1.2) 1 (0.8) 1 (1.3) WHO III 332 (98.5) 373 (97.6) 146 (100.0) 159 (98.8) 118 (99.2) 74 (98.7) EBV DNA (copy/ml) <0.001 <0.001 <0.001 <2000 337 (100.0) 192 (50.3) 146 (100.0) 88 (54.7) 119 (100.0) 55 (73.3) ≥2000 0 (0.0) 190 (49.7) 0 (0.0) 73 (45.3) 0 (0.0) 20 (26.7) Hemoglobin (g/L) 0.981 1 0.988 <120 28 (8.3) 33 (8.6) 11 (7.5) 12 (7.5) 5 (4.2) 4 (5.3) ≥120 309 (91.7) 349 (91.4) 135 (92.5) 149 (92.5) 114 (95.8) 71 (94.7) LDH(U/L) <0.001 0.004 0.003 <250 337 (100.0) 351 (91.9) 146 (100.0) 150 (93.2) 119 (100.0) 68 (90.7) ≥250 0 (0.0) 31 (8.1) 0 (0.0) 11 (6.8) 0 (0.0) 7 (9.3) Total tumor volume(ml) <0.001 <0.001 <0.001 <11 337 (100.0) 61 (16.0) 146 (100.0) 35 (21.7) 119 (100.0) 18 (24.0) ≥11 0 (0.0) 321 (84.0) 0 (0.0) 126 (78.3) 0 (0.0) 57 (76.0) Treatment <0.001 0.005 0.003 IMRT alone 159 (47.2) 110 (28.8) 61 (41.8) 42 (26.1) 62 (52.1) 22 (29.3) CCRT 178 (52.8) 272 (71.2) 85 (58.2) 119 (73.9) 57 (47.9) 53 (70.7) Abbreviations: CCRT, concurrent chemoradiotherapy; EBV, Epstein–Barr virus; IMRT, intensity-modulated radiotherapy; LDH, lactate dehydrogenase; WHO, World Health Organization. 3.2 Risk score model and risk stratificationIn the training cohort, univariate and multivariate Cox analyses showed EBV DNA, total tumor volume, and serum lactate dehydrogenase (LDH) were independent prognostic factors for FFS and LRFS (all p < 0.05, Table 2). In order to facilitate clinical application, one risk factor was scored one point. Thus, patients were scored from 0 to 3 points according to the number of risk factors. Finally, 336 (46.7%), 231 (32.1%), 142 (19.7%), and 10 (1.4%) patients had 0, 1, 2, and 3 points, respectively. Interestingly, survival curves showed patients with higher risk points had the lower survival rates (all p < 0.05, Figure S3). Subsequently, patients with risk score equal to 0 point were divided into low-risk group, while patients with risk score higher than 0 point were stratified into high-risk group. Hence, 382,161, and 75 patients were divided into high-risk group, while 337,146, and 119 patients were split into low-risk group in the training, validation, and prospective test cohorts, respectively. The baseline characteristics of two risk groups are presented in Table 1. And patients in the low-risk group had higher survival rates than those in the high-risk group in all cohorts (5-year FFS in the training cohort: 93.5% vs. 80.1%, p < 0.001; 5-year FFS in the validation cohort: 92.9% vs. 84.9%, p = 0.002; and 3-year FFS in the prospective cohort: 94.9% vs. 79.9%, p = 0.0038; Figure 2).
TABLE 2. Univariate analysis and multivariate analysis for FFS and LRFS in the training cohort (N = 719) FFS LRFS Univariate analysis Multivariate analysis Univariate analysis Multivariate analysis HR (95% CI) p HR (95% CI) p HR (95% CI) p HR (95% CI) p Sex (Male vs. female) 1.19 (0.78–1.80) 0.425 1.13 (0.68–1.88) 0.629 Age (≥45 vs. <45) 1.05 (0.72–1.52) 0.811 0.86 (0.55–1.36) 0.530 T stage (T2 vs. T1) 0.97 (0.45–1.46) 0.885 0.87 (0.54–1.42) 0.585 N stage (N1 vs. N0) 1.11 (0.70–1.77) 0.663 1.15 (0.64–2.06) 0.636 Pathology 0.59 (0.23–1.49) 0.264 0.74 (0.20–2.80) 0.657 EBV DNA (≥2000 vs. <2000) 2.32 (1.59–3.37) <0.001 1.80 (1.20–2.69) 0.004 2.29 (1.45–3.62) <0.001 1.69 (1.04–2.74) 0.035 Hemoglobin (≥120 vs. <120) 1.42 (0.69–2.92) 0.345 1.60 (0.64–4.01) 0.312 LDH (≥250 vs. <250) 4.72 (2.73–8.15) <0.001 4.42 (2.55–7.65) <0.001 3.37 (1.61–7.04) 0.001 3.24 (1.55–6.79) 0.002 Total tumor volume (≥11 vs. <11) 2.09 (1.43–3.06) <0.001 1.72 (1.14–2.58) 0.009 2.52 (1.56–4.05) <0.001 2.14 (1.29–3.55) 0.003 Treatment (CCRT vs. IMRT alone) 0.76 (0.52–1.10) 0.149 0.68 (0.43–1.08) 0.100 Abbreviations: CCRT, concurrent chemoradiotherapy; CI, confidence interval; EBV, Epstein–Barr virus; FFS, failure-free survival; HR, hazard ratio; IMRT, intensity-modulated radiotherapy; LDH, lactate dehydrogenase; LRFS, locoregional relapse-free survival.
Survival curves of
留言 (0)