
記住我
Glioblastoma is the most common and the most lethal primary malignancy of the central nervous system (CNS), which has a high recurrence rate and mortality rate, thus, threatening human health and life worldwide severely.1 Currently, conventional therapies, such as surgery, radiation, and chemotherapy, and novel therapies, such as immunotherapy2 and nanoparticle-based treatment methods,3, 4 have not been successful because of poor treatment outcomes and intolerable side effects. Furthermore, the key diagnostic and therapeutic targets are far being revealed due to the high heterogeneity of glioblastoma. Therefore, elucidation of the pathology and molecular biology of glioblastoma is urgently needed to improve treatment outcomes.
Thus far, many endeavors from have been made to determine the molecular mechanism of glioblastoma,5-7however, the heterogeneity of cellular populations and complex tumor microenvironment compositing glioblastoma tissue have hindered thoroughly exploration. Importantly, glioblastoma cells have metabolic dependencies, organellar interactions, and/or communication discrepancies that distinguish them from their normal counterparts, for example, it is known to activate or block pathways to consume more glucose and produce more lactic acid, even in normoxic conditions.8, 9 Mitochondria are powerhouses of cellular activities that are involved in mediating various biological processes of glioblastoma cells,10, 11 such as proliferation, apoptosis, multidrug resistance, signal transmission, oxidative stresses sensors, and so on. Mitochondria also act as switches to regulate tumor development12 and control the transformation of cellular phenotype.13 Although there are many sources of energy for cellular activities, the main energy process that provides energy for glioblastoma cells development and progression is still mitochondrial respiration.14, 15 In cancer cells, mitochondrial damage reduces ATP production and facilitates apoptosis or autophagy, which further accelerates lysosomal degradation to maintain cellular compartment homeostasis and mediate the survival.16, 17 Thus, mitochondria are emerging as promising targets in clinical treatments.18
Dcf1, also known as dendritic factor 1 or TMEM59, is a one-pass transmembrane protein that has been demonstrated to play vital roles in glioblastoma cell lines in previous studies. Our group have demonstrated that Dcf1 overexpression inhibits U251 cells through the destruction of mitochondria and the activation of apoptosis,19 and puried TAT-DCF1 protein is capable to promote the apoptosis of U251 cells.20 More importantly, the Dcf1 also identified to be crucial for energy balance.21 Thus, Dcf1 is an important regulator of survival in glioblastoma cells. For interaction of organelles, Emilio Boada-Romero et al demonstrated that Dcf1 motif from amino acids 263–281 mediates the interaction of Dcf1 with the WD-repeat domain of ATG16L1 to promote LC3 activation and lysosomal targeting of the endosomal compartment to promote the autophagy,22, 23 and the alteration of ATG16L1 (T300A) changes the ability of the C-terminal WD40-repeat domain to interact with an amino acid motif that recognizes this region, then, impairing the unconventional autophagic activity with TMEM59, thus, disrupting its normal intracellular trafficking and its response to bacterial infection to increase the risk of Crohn's disease.24 Moreover, Dcf1 has been identified to interact with FZD and LRP6 to form mature Wnt signalosomes that significantly to activate Wnt3a, which is responsible for regulating cell proliferation and cell fate decisions,25 and maintaining the stemness of neural stem cells26 and activation of microglia.27 However, the precise mechanisms of Dcf1 in primary glioblastoma cells have not been elucidated clearly due to the high heterogeneity and complex microenvironment constitution.
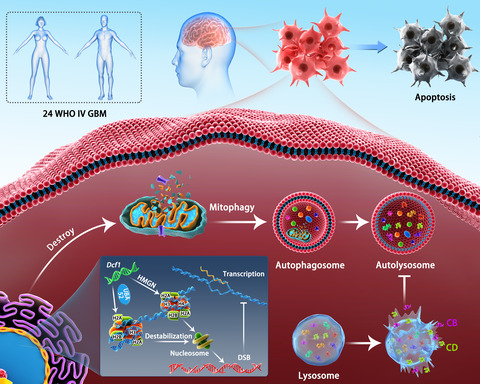
In this study, we investigated the molecular mechanism of Dcf1 in glioblastoma cells separated from surgical grade IV glioblastoma patients. In total, proteomic analysis revealed that overexpression of Dcf1 altered the change of 176 proteins significantly and the differentially expressed proteins (DEPs) involved in the regulation of genetic materials stability and cellular energy supply. Taken deeper exploration, we found out the Dcf1 destabilized the nucleosome structure by downregulating the expression of HistoneH2A.X but not macroH2A or HistoneH2A.Z to induce DNA damage, inhibiting the binding to UBA52 for recruiting the DNA repair complex, decreased mitochondrial DNA (mtDNA) copy number, inhibited mitochondrial biogenesis, destructed the structure and function of mitochondria, which inhibited the supply cellular energy and induced mitophagy directly and preferentially but not mitochondrial apoptosis. Moreover, Dcf1 also led to lysosomal dysfunction and destruction, which prevented forming mature autolysosomes and blocked the process of autophagy, and increased the release of lysosomal content to cytosol, activated and executed apoptosis via cleaving BID finally (Graphical ToC). Overall, we found, for the first time, that the expression of Dcf1 is correlated with glioblastoma malignancy and revealed the key role of Dcf1 in the survival of human glioblastoma cells, it provides new insight for understanding glioblastoma.
2 MATERIALS AND METHODSAll patients in this study consented to an institutional review board-approved protocol that allows comprehensive analysis of tumor samples (Ethics Committees of Shanghai University, PR China, the Fifth People's Hospital of Shanghai, Fudan University, PR China and Karolinska Institutet, Stockholm, Sweden.). All human glioblastoma tumor and brain tissue from trauma patients were collected at The Fifth People's Hospital of Shanghai, Fudan University, Shanghai, China. And all human glioblastoma tissue experienced curative surgery, but did not receive other therapies, and the tissue samples were confirmed as glioblastoma by a neuropathologist. This study conforms to the Declaration of Shanghai University, PR China, the Fifth People's Hospital of Shanghai, Fudan University, PR China and Karolinska Institutet, Stockholm, Sweden. All the antibodies’ information is referred to Table S1; the plasmids’ information is referred to Table S2; the primes’ information is referred to Table S3; the chemicals, kits’ information is referred to Table S4.
2.1 Glioblastoma cell isolation and cultureThe glioblastoma tissues were separated into single cells using collagenase I for 30 min with gentle mixing every 5 min and the blood red cells were lysed with Red Blood Cell Lysis Buffer. The cells were cultured in DMEM/F12 (BI) medium with 15% FBS plus sodium pyruvate and GlutaMAX™ Supplement and 1% penicillin-streptomycin (Life) at 37 ℃ under 5% CO2 in an incubator. The cell line used in this study was isolated from surgically obtained glioblastoma tissue, and no other cell lines were included.
2.2 Real-time quantitative reverse transcription PCR (RT-PCR)Isolated tumor tissues and normal tissues were carefully dissected using surgical scissors and stored in RNA storage reagent. Total RNA was isolated using a total Eastep® Super RNA extraction kit. RNA (3 μg) was reverse transcribed into cDNA using a ReverTra Ace Kit for RT-PCR. Quantitative PCR was performed on a Rotor-Gene Three-Step Real-Time PCR system. PCR was performed with SYBR® Green Realtime PCR Master Mix with the following specific primers as Table S3. A total of 20 ng of cDNA or genome DNA was used per reaction. All standard curve reactions and samples were run in triplicate along with no-template control reactions for all primer sets. The PCR cycling parameters followed the manufacturer's recommendations.
2.3 Cell invasion assayA BioCoatTM MatrigelTM Invasion Chamber was used to assess the effect of Dcf1 on cellular invasive ability. After transfection with pcDNA3.1 or pcDNA3.1-Dcf1 for 48 h, cells were harvested and adjusted to a density of 5 × 10⁵/mL. After incubation in the invasion chamber for 24 h, noninvaded cells were scrubbed with a cotton swab, and invaded cells were stained with crystal violet and observed using a Nikon Ti-S fluorescence microscope at a magnification of 100×.
2.4 Flow cytometry assayAfter transfection with pcDNA3.1 or pcDNA3.1-Dcf1 for 48 h, glioblastoma cells were digested with trypLE, harvested in 10% FBS in DMEM/F12, washed twice with 2% BSA in PBS, resuspended in 100 μl of binding buffer, combined with 5 μl of annexin V-FITC and 5 μl of PI according to the protocol of an Annexin V-FITC/PI Apoptosis Detection Kit, mixed gently and stained at room temperature for 15 min before flow cytometry detection. The cell cycle was detected by flow cytometry after digestion with 10 μg/ml RNase at 37℃ for 30 min and staining with 50 μg/ml PI at 4℃ for 30 min. The percentages of apoptotic cells and cells in each phase of the cell cycle were calculated.
2.5 Wound healing assayScratch wound healing assays were performed in 24-well culture plates. Cells at 40%–45% confluence were transfected with pcDNA3.1 or pcDNA3.1-Dcf1 plasmids to enhance protein expression for 24 h. Scratches were made using 1-ml pipette tips and washed twice with culture medium. The cells were permitted to grow for an additional 48 h, fixed in 4% paraformaldehyde for 30 min and stained with 1% crystal violet in 2% ethanol for 15 min. Photographs were taken on a Nikon inverted microscope with an objective of 10×. The gap distance of the wound was measured using Image-Pro Plus software, and the data were normalized to the data for the control group.
2.6 Real-time monitoring of cellular migration assayReal-time monitoring of cellular migration was performed using an xCELLigence RTCA DPlus Instrument and cell invasion and migration (CIM) plates. The assays were performed after glioblastoma cells were transfected with pcDNA3.1 or pcDNA3.1-Dcf1 for 12 h. The cells were harvested and placed into the upper chambers of CIM plates in serum-free DMEM/F12 medium at a density of 25,000 cells per well. The bottom chambers of the CIM plates were filled with 15% serum-containing medium to promote migration across the membrane. The CIM plates were transferred into the RTCA DP instrument, and continuous readouts were obtained for 72 h at 15-min intervals. The experiment was performed in quadruplicate.
2.7 Isobaric tags for relative and absolute quantificationThe isobaric tags for relative and absolute quantification (iTRAQ) were conducted with the help of Shanghai Majorbio Bio-Pharm Technology Co., Ltd. The entire process including: (1) Protein extraction and quantification; (2) Protein digestion and iTRAQ labeling; (3) High-pH reversed-phase liquid chromatography (RPLC); (4) Mass spectrometry analysis; (5) Sequence database searching using Proteom DiscovererTM Software 2.1 against the Homo sapiens database (70,611 entries); (6) Function annotation using the Blast2GO program against the nonredundant (NR) protein database (NCBI). The Kyoto Encyclopedia of Genes and Genomes (KEGG) database (http://www.genome.jp/kegg/) and the Clusters of Orthologous Groups (COG) database (http://www.ncbi.nlm.nih.gov/COG/) were used to classify and group these identified proteins.
2.8 Cellular ATP assayATP concentrations were detected using an ATP Assay Kit. In brief, cells were cultured in 6 cm dishes after transfection with pcDNA3.1 or pcDNA3.1-Dcf1 for 48 h, lysed, and then centrifuged at 12,000 rpm for 10 min to isolate total proteins. Then, 100 μl of supernatant was added to 100 μl of ATP detection solution, and standard samples were generated. Luminescence was immediately detected using a plate reader (PerkinElmer). The protein concentration was measured using a Bradford assay.
2.9 Mitochondrial membrane potential assay (JC-1 assay)Mitochondrial membrane potential was evaluated with a JC-1 Mitochondrial Membrane Potential Detection Kit. In brief, before staining, cells were incubated with 1:1000-diluted CCCP as a positive control for 30 min. After transfection for 48 h, the cells were incubated with 1× JC-1 staining solution in 24-well plates for 20 min at 37℃ and rinsed twice with 1× staining buffer. Finally, cells cultured in 10% FBS/DMEM were detected using an LSM710 fluorescence microscope.
2.10 Acridine Orange stainingAfter transfection for 48 h, glioblastoma cells were stained with Acridine Orange (AO) at a final concentration of 5 μg/ml for 15 min (37°C, 5% CO2). Fluorescence images were captured using a Zeiss 710 LSM confocal microscope. AO produces red fluorescence (with an emission peak at approximately 650 nm) in lysosomal compartments and green fluorescence (with an emission peak between 530 and 550 nm) in cytosolic and nuclear compartments. The fluorescence intensity per pixel was quantified with Image-Pro Plus software, and the ratio of red and green fluorescence intensity per pixel was calculated.
2.11 Transmission electron microscopePrimary glioblastoma cells transfected with pcDNA3.1 or pcDNA3.1-Dcf1 were cultured in complete medium for 48 h, and then, the cells were fixed in 2% formaldehyde and 2.5% glutaraldehyde. The fixed samples were postfixed with osmium tetroxide, dehydrated, and embedded in Araldite Durcupan ACM. Then, ultrathin sectioning was conducted, and the sections were photographed with a transmission electron microscope.
2.12 Isolation of the lysosomal fractionCells transfected with pcDNA3.1 or pcDNA3.1-Dcf1 for 48 h were washed in precooled PBS, trypsinized, quenched with medium, and centrifuged at 500× g for 3 min to produce cell pellets. After medium removal, the pellets were washed with precooled PBS and centrifuged at 500× g for 3 min again. The primary glioblastoma cell pellets were resuspended in sucrose homogenization buffer (0.25 M sucrose, 20 mM HEPES) containing PMSF, protease inhibitor, and phosphatase inhibitor; homogenized by sonication; and ground. The homogenates were centrifuged at 500× g for 5 min, and the unbroken cell debris was discarded. The resulting supernatant (S1) was centrifuged at 6800 g for 10 min to yield P2 (mitochondrial fraction). The remaining supernatant (S2) was centrifuged again at 20,000× g for 40 min to yield P3 (the lysosomal fraction), which was washed with fresh sucrose homogenization buffer and centrifuged at 20,000× g for 15 min. The P2 and P3 fractions were resuspended in RIPA buffer containing protease and phosphatase inhibitors for further detection.
2.13 Labeling of mitochondria/lysosomesMitochondria and lysosomes were labeled with MitoTracker Green and LysoTracker Red, respectively, according to the manufacturer's protocol. Briefly, the labeling reagent was added to cultured cells at a 1:1,000 dilution, and the cells were incubated at 37°C for 30 min. Images were obtained using a fluorescence microscope.
2.14 Lysosomal acid phosphatase (ACP) assayACP activity was assayed with a commercially available kit according to the manufacturer's instructions. Glioblastoma cells transfected with pcDNA3.1-Dcf1 or pcDNA3.1 were collected, lysed and centrifuged at 10,000 rpm at 4℃ for 5 min, and the supernatant was removed and placed in a new tube for testing. After incubation with detection reagent, the absorbance was recorded at 450 nm using a microplate reader.
2.15 Immunofluorescence (IF)Glioblastoma cells were seeded, transfected for 48 h, rinsed with PBS, fixed in 4% paraformaldehyde for 15 min at room temperature, permeabilized with 0.1% Triton X-100 for 15 min, blocked with 5% BSA-PBS at room temperature for 90 min, and incubated with primary antibodies at 4°C overnight. After they were washed with PBS, the cells were incubated with secondary antibodies for 2 h at room temperature, and fluorescence was obtained using an LSM710 fluorescence microscope.
2.16 Immunoprecipitation assayGlioblastoma cells were seeded in 10-cm culture dishes, transfected with pcDNA3.1 or pcDNA3.1-Dcf1 for 48 h, rinsed with PBS three times and collected in to 10 ml centrifuge tube, and lysed with cell lysis buffer contain protein inhibitors. The lysate was incubated with the protein A/G beads that coupled with UBA52 antibody 4°C overnight. Then, the protein A/G beads were collected via centrifuging at 3000 rpm for 5 min and washed with PBS three times, the desorption of bound protein were treated with glycine (0.1 M, pH2.5), boiled and examined with western blotting.
2.17 Western blotting analysisThe protein abundance values of the pooled samples previously analyzed by iTRAQ LC-MS/MS were confirmed. Protein samples (35 μg) were added to electrophoretic buffer containing β-mercaptoethanol prior to SDS-PAGE and transferred onto 0.45 or 0.22 μm nitrocellulose membranes. The membranes were blocked with 5% milk in PBS for 1.5 h and subsequently probed by using the following primary-specific antibodies (as shown in Table S1). Tubulin and GAPDH were used as loading controls. After the samples were incubated with affinity-purified goat anti-rabbit DyLight 800-conjugated or goat anti-mouse DyLight 680-conjugated secondary antibodies (1:10,000) for 1.5 h, images were acquired by using an Odyssey infrared imaging system at 700 and 800 nm in the 16-bit TIFF format. Odyssey software was applied for the quantification of protein expression.
2.18 Statistical analysisFor cell-based assays, independent experiments were performed. The results of Western blotting analyses of differential protein expression were validated in cell lysates from three biological replicates. Statistical significance was analyzed using Student's t-test or ANOVA by using GraphPad Prism v7.01 software (GraphPad Software). Statistical significance is expressed as *p < 0.05, **p < 0.01, ***p < 0.001, and ****p < 0.0001.
3 RESULTS 3.1 Dcf1 expression is decreased with tumor malignancy but lacks mutationTo thoroughly investigate the relationship between Dcf1 and glioblastoma, 24 WHO grade IV surgical glioblastoma tissues were collected, and 11 glioblastoma cell lines were isolated for culture successfully. First, the expression of Dcf1 was explored, and the results showed that Dcf1 was downregulated in glioblastoma tissue compared to normal tissue in mRNA and protein (Figure S1A,B), it is consent with data from the gene microarray database (GDS2853, GSE12305; Figure S1C), which implies that the expression level is negatively related to tumor malignancy. Moreover, we explored the mutation by DNA sequencing, the results showed that there is no mutation in full length of Dcf1 gene (Figure S1D), which is not similar with the oncogenes or antioncogenes, such P53, KRAS, and PTEN in glioblastoma.
3.2 Dcf1 destabilizes the stability of genetic materialIn previous studies, Dcf1 promoted apoptosis in U251 cell.19, 20 Hence, we applied iTRAQ-based proteomics approach to obtain a comprehensive understanding profile of the molecular mechanisms in primary glioblastoma cells. A total of 176 DEPs were identified after Dcf1 overexpression (Figure 1A; 64 were upregulated, Table 1), 112 were downregulated (Table 2), and the differential expression was confirmed by western blotting (Figure S2A,B). Given the results of deeper bioinformatic analysis combined with the results of previous study,28, 29 the DEPs mainly involved in regulating the stability of genetic material and cellular energy supply (Figure S2C,D), both are crucial for the cell survival. As expected, Dcf1 induced the most significant decrease in HistoneH2A (Accession: A0A0U1RRH7, Figure 1A), the core component of nucleosomes and a modulator that stabilizes DNA to control different biological processes. However, Dcf1 did not alter HistoneH2B, HistoneH3, HistoneH4 via iTRAQ sequencing data; thus, we assumed that Dcf1 induces primary glioblastoma cells into apoptosis via altering the stability of genetic material. And the bioinformatic analysis revealed that the Dcf1 leaded to the reduction of UBA52 (Figure S2E), a ribosomal protein, which links to proteins and is responsive for the degradation of protein and the recruitment of the DNA damage repair complex.30, 31 As shown in Figure 1B, the western blotting results showed that Dcf1 induced the downregulation of three isomers of HistoneH2A significantly, and the immunoprecipitation results revealed that only HistoneH2A.X was decreased linked to UBA52 (Figure 1C), thus, Dcf1 inhibits the recruitment of the DNA damage repair complex. In addition, the bioinformatic analysis results confirmed that the expression of nucleosome core-related proteins, including HIST1H2AB, HIST2H2AB, HIST1H1C, and HIST3H2BB (Figure 1D), was also decreased significantly, which prevented DNA histone assembly and thus prevented formation of nucleosome and condensation to form chromosomes. Moreover, Dcf1 also induced the decrease of HMGN1, HMGN3, and HMGN4 (Figure 1D), exposing transcription activation/inactivation regions to cause DNA damage (Figure 1E,F) that affected the stability of genetic material and induced apoptosis,32 which is similar to our group's research in U251 cells.29

Dcf1 destabilized the structure of nucleosomes and damaged DNA. (A) Scatter plot of the protein expression (n = 3). Red: upregulated proteins; green: downregulated proteins; gray: unchanged proteins. (B) Detection of HistoneH2A isomer expression using Western blotting (n = 3). (C) Immunoprecipitation of UBA52 and HistoneH2A isomers. (D) Summary of nucleosome-related protein changes determined by iTRAQ (n = 3). (E) Evaluation of DNA damage with γ-H2A.X (n = 3). (F) Immunofluorescence image of γ-H2A.X. Scale bar: 50 μm. Data were presented as mean ± SEM. Significance between every two groups was calculated by the Student's t-test. *p < 0.05, **p < 0.01, ***p < 0.001
TABLE 1. List of selected differentially upregulated expressed proteins in glioblastoma cells Rank# Accession Gene symbol FC (DCF1/EGFP) Unique peptides AA MW (kDa) 1 V9GZ17 TUBA8 1.82 1 275 31.051 2 Q9H993 ARMT1 1.292 3 441 51.14 3 Q8NHH9 QTL2 1.299 3 583 66.187 4 Q969Y2 GTPBP3 1.31 1 432 52.026 5 O00401 WASL 1.3 2 505 54.793 6 P48163 ME1 1.455 1 572 64.109 7 Q9UKV5 AMFR 1.59 1 643 72.949 8 Q96CW5 TUBGCP3 1.347 1 907 103.506 9 Q9UNI6 DUSP12 1.287 1 340 37.663 10 Q7Z4G4 TRMT11 1.333 1 463 53.387 11 P07948 LYN 1.283 1 512 58.537 12 Q9Y2H2 INPP5F 1.286 2 1132 128.326 13 P48201 ATP5G3 1.328 1 142 14.684 14 Q9H4I9 SMDT1 1.303 1 107 11.434 15 M0QYN0 MYDGF 1.278 1 189 20.375 16 Q8TD26 CHD6 1.248 1 2715 305.22 Note FC: expression fold change, the abundance ratio of DCF1 and EGFP. AA: the number of amino acid. MW: molecular weight of selected protein. TABLE 2. List of selected differentially downregulated expressed proteins in glioblastoma cells Rank# Accession Gene symbol FC (DCF1/EGFP) Unique peptides AA MW (kDa) 1 M0QZM1 HNRNPM 0.482 1 383 40.016 2 P62987 UAB52 0.665 1 128 14.719 3 A0A0U1RRH7 Histone H2A 0.384 1 170 18.541 4 P04908 HISTAH2AB 0.55 1 130 14.127 5 Q15642 TRIP10 0.701 3 601 68.31 6 Q8IUE6 HIST2H2AB 0.65 1 130 13.987 7 Q13480 GAB1 0.703 1 694 76.569 8 P50552 VASP 0.59 1 380 39.805 9 Q6UXH1 CRELD2 0.68 2 353 38.166 10 Q9UNZ5 C19orf53 0.665 2 99 10.57 11 P48509 CD151 0.698 2 253 28.276 12 P20933 AGA 0.648 1 346 37.184 13 O14734 ACOT8 0.673 1 319 35.891 14 Q9Y639 NPTN 0.599 1 398 44.36 15 Q92551 IP6K1 0.68 1 441 50.204 16 P16104 H2AFX 0.758 5 143 15.135 Note FC: expression fold change, the abundance ratio of DCF1 and EGFP. AA: the number of amino acid. MW: molecular weight of selected protein. 3.3 Dcf1 causes mitochondrial destruction and dysfunction to induce mitophagyThe previous results showed that Dcf1 destabilized genetic material, and the crucial regulation of genetic materials in cell survival and fate. On the other hand, the Dcf1 has been identified to express at mitochondria and induces the loss of mitochondrial localization of MGST1.28 However, the precise molecular mechanism of Dcf1 between genetic materials and cellular survival is still unknown. Hence, we conducted deeper bioinformatic analysis on the iTRAQ sequencing data. The results showed that the localization of DEPs in mitochondria and lysosomes was opposite that in the remaining organelles (Figure S3A,B), which suggested that the Dcf1 controls the viability of glioblastoma cell via the structure and function of mitochondria and lysosomes. As we all known, the status of mitochondrial DNA (mtDNA) and mitochondrial physiology were controlled by nucleus DNA (nDNA), and mitochondria and lysosome are critical for cell death and apoptosis.19, 33, 34 Therefore, we explored the relationships of Dcf1 with mitochondria and inter-organelle interactions in glioblastoma cells. First, we observed that Dcf1 decreased the ratio of mtDNA to nDNA (Figure 2A), which could alter the physiology and function of mitochondria, including cellular respiration. Mito-Tracker Green staining revealed that Dcf1 decreased the number of mitochondria (Figure 2B) and inhibited the biogenesis of mitochondria via the SIRT1/SIRT3-PGC1α-NRF1-TFAM pathway (Figure 2C).35, 36 More, the mitochondrial membrane potential examination conclusively showed that Dcf1 reduced the membrane potential (Figure 2D) and increased the permeability of the mitochondria membrane via the permeability transition pore (PTP; Figure 2E), these can lead to decreased release (efflux) or increased uptake (influx) of ions and materials by above destruction synergistically, such as Ca2+ and K+. Immunofluorescence with COX8-DsRed revealed mitochondrial fragmentation upon ectopic Dcf1 expression (Figure 2F), implying Dcf1 has a destructive effect on mitochondrial structure and induced the dysfunction of mitochondria. As expected, the ATP concentrations in glioblastoma cells were significantly reduced (Figure 2G). The results of further examination also showed that the content of intracellular Ca2+ was elevated (Figure S3C), suggesting the existence of mitochondrial dysfunction and communication improper between organelles that impacted cell viability.

Dcf1 destroyed mitochondria. (A) The mtDNA/nDNA ratio detected with RT-PCR (n = 6). (B) Mitochondrial staining with MitoTracker Green. (C) Detection of mitochondrial membrane potential with a JC-1 kit. (D) Western blotting results for the mitochondrial biogenesis pathway (n = 3). (E) Detection of isolated mitochondrial membrane permeability transition pores (MPTPs) with Ca2+ absorbance examination. (F) Immunofluorescence images of mitochondrial structure. (G) ATP concentrations in glioblastoma cells determined using an ATP Assay Kit (n = 4). Scale bars: 50 μm. Data were presented as mean ± SEM. Significance between every two groups was calculated by the Student's t-test. *p < 0.05, **p < 0.01, ***p < 0.001
Mitochondria play important roles in cell survival and the response of stress different stimulus, damaged mitochondria can induce autophagy or apoptosis via the mitochondrial pathway,
留言 (0)