
記住我
Primary immune thrombocytopenia (ITP) is a common autoimmune bleeding disease, in which immune-mediated excessive platelet clearance and insufficient platelet production result in a decrease in platelet count (<100 × 109/L). The clinical manifestation varies from asymptomatic to mucocutaneous bleeding, visceral bleeding, and even life-threatening intracranial hemorrhage.
Among mechanisms of platelet clearance in ITP, the clearance mediated by anti-platelet autoantibodies is considered the classical pathway, and the type of autoantibodies is mainly immunoglobulin G (IgG). IgG antibodies are glycoproteins and undergo post-translational modification. The Fc portion of IgG has a uniquely conserved glycosylation site at asparagine 297 (Asn297). The exact composition of the attached N-glycan affects IgG-mediated effector functions such as antibody-dependent cell-mediated cytotoxicity (ADCC), complement-dependent cytotoxicity (CDC), and antibody-dependent cellular phagocytosis (ADCP) through modification of the IgG Fc binding affinity for Fcγ receptors (FcγRs) and complement protein C1q complex.1-5 Glycosylation of IgG Fc is critical for modulating the pro-inflammatory and anti-inflammatory activities of IgG and may contribute to autoimmune and inflammatory diseases. It has been reported that a variety of autoimmune and inflammatory diseases such as autoimmune hemolytic anemia, systemic lupus erythematosus, inflammatory bowel disease, and rheumatoid arthritis have skewed IgG glycosylation pattern,6-9 and in some diseases, the skewed IgG glycosylation is associated with disease severity and treatment response.10, 11 In addition to IgG, the altered glycosylation pattern of total serum proteins, which is considered reflecting the physiological and pathological state of the body, is also associated with autoimmune and inflammatory diseases.12 Nowadays, the disease-related glycosylation alterations of serum and IgG have shown great potential in the biomarker field.12-16
The researches on glycosylation alteration in ITP are scarce and inconsistent. One study showed IgG galactosylation of ITP patients was higher than that of healthy controls,17 while another did not detect any difference in IgG glycosylation between ITP patients and healthy controls.18 Whether the glycosylation patterns of serum and IgG are altered in ITP, similar to other autoimmune disorders, needs further investigations. In this study, we compared the N-glycan profiling of serum proteins and purified IgG fraction (hereinafter referred to as serum and IgG respectively) between ITP patients and healthy controls and investigated the correlations of N-glycans with platelet counts, and the specific N-glycan patterns of serum and IgG were observed in ITP patients.
2 MATERIALS AND METHODS 2.1 Patients and controls61 patients with ITP (23 males and 38 females; 22–84 years old; median age 54 years) were enrolled between January 2020 and November 2021 in the Department of Hematology, Yueyang Hospital of Integrated Traditional Chinese and Western Medicine, Shanghai University of Traditional Chinese Medicine, China (hereinafter referred to as Yueyang Hospital), after an informed consent was obtained from each patient. All the patients were diagnosed according to Chinese guideline on the diagnosis and management of adult primary immune thrombocytopenia (version 2020).19 35 age- and sex-matched healthy controls (16 males and 19 females; 39–63 years old; median age 54 years) were randomly selected from the database established by Shanghai Eastern Hepatobiliary Surgery Hospital as a control group (http://206.189.76.64/NGFP/login.php). The study was approved by the Institutional Review Boards at the leading study center (EHBHKY2020-02-012). Serum samples were stored until analysis (−80°C).
2.2 Serum N-glycan profilingFluorescent glucose electrophoresis based on DNA sequencer (DSA-FACE) was used to analyze N-glycan profiling of desialylated sera as previously described.20 In brief, the N-glycans were released from the glycoproteins in 2 μL serum with peptide-N-glycosidase-F (PNGase F) (New England Biolabs, MA) and labeled with fluorescein APTS (8-amino-naphthalene-1,3,6- trisulfonic acid) (Invitrogen, CA); then, sialic acid at the end of the oligosaccharide was removed with arthrobacter ureafaciens sialidase (Roche Bioscience, Palo Alto, CA). The processed samples were analyzed by capillary electrophoresis-based ABI 3500 Genetic Analyzer (Applied Biosystems, Foster City, CA) and the GeneMapper software (Applied Biosystems). 12 obvious N-glycan peaks were detected, and the relative structure abundance of each N-glycan peak was described numerically by normalizing its peak height to the sum of the heights of all peaks. Subsequently, the levels of fucosylation and galactosylation were calculated. The level of fucosylation was described as the sum of relative abundances of all the peaks containing core fucose (peak 1 + peak 2 + peak 3 + peak 4 + peak 6 + peak 7 + peak 9p + peak 10), and the level of galactosylation was described as the sum of relative abundances of all the peaks containing galactose (peak 3 + peak 4 + peak 5 + peak 6 + peak 7 + peak 8 + peak 9 + peak 9p + peak 10 + peak 11).
2.3 IgG N-glycan profilingIgG was isolated from the whole serum using protein A/G Spin kit according to the manufacture's instruction (Thermo Scientific, USA). IgG was eluted with formic acid and dried in a vacuum concentrator; then, N-glycans were released from IgG by PNGase F. The N-glycan profiling was performed by DSA-FACE as described above. 7 IgG N-glycan peaks corresponding to peak 1 to peak 7 of serum N-glycan peaks were detected, and the relative abundance of each N-glycan was described as above. The level of fucosylation was described as the sum of relative abundances of all the peaks containing core fucose (peak 1 + peak 2 + peak 3 + peak 4 + peak 6 + peak 7), and the level of galactosylation was described as the sum of relative abundances of all the peaks containing galactose (peak 3 + peak 4 + peak 5 + peak 6 + peak 7).
2.4 Statistical analysisStatistical analyses were performed in SPSS 26.0, and SPSS 26.0 and GraphPad Prism 5.0 were used for graphing. Categorical variables were expressed as numbers and percentages (n, %), and the comparison of categorical variables between groups was performed using chi-square test. Continuous variables were expressed as mean ±standard deviation (SD) and median with range according to data distribution, and comparisons of continuous variables between groups were performed by Mann-Whitney U test, unpaired t test and paired t test. The diagnostic efficacies of the biomarkers were evaluated by receiver operating characteristic curve (ROC). A two-tailed p values < 0.05 was considered statistically significant.
3 RESULTS 3.1 Baseline characteristicsThe main demographic features and platelet counts of healthy controls and ITP patients were summarized in Table 1. There were no significant differences in age and sex between control group and ITP group.
TABLE 1. Demographic and clinical characteristics of healthy controls and ITP patients CharacteristicsControl
(n = 35)
ITP
(n = 61)
P
Value
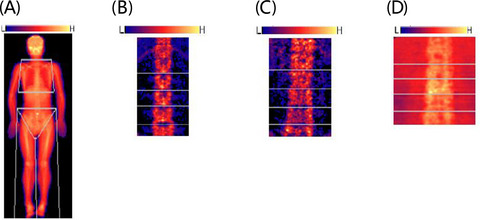
Age in years Median 54 54 0.855 Range 39–63 22–84 Gender, n (%) Male 16(45.71) 23(37.70) 0.442 Female 19(54.29) 38(62.30) PLT (×109/L) Mean ±SD 235.63 ± 50.95 39.59 ± 22.30 0.000* Range 140–359 2–94 Note PLT, platelet count. *p < 0.05, the difference is statistically significant. 3.2 Alterations of N-glycan profiling in ITPWe analyzed serum N-glycan profiling in 35 healthy controls and 61 ITP patients, and IgG N-glycan profiling in 35 healthy controls and 34 out of 61 ITP patients, and the flow chart was shown on Supplementary data, Figure S1. 12 serum N-glycan structures (peaks) and 7 IgG N-glycan peaks were identified. The 12 serum N-glycan peaks comprised 7 biantennary glycans, 4 tri-antennary glycans, and 1 tetra-antennary glycan, and the detailed structure of each N-glycan peak was described previously by Liu et al.21 The representative serum and IgG profiling patterns were shown in Figure 1. 6 out of 12 directly measured serum N-glycan peaks showed statistically significant differences between healthy controls and ITP patients. In ITP patients, the relative abundances of peak 5 (NA2), peak 9p (NA3F), and peak 11 (NA4) were increased, while the relative abundances of peak 3 (NG1A2F), peak 4 (NG1A2F), and peak 6 (NA2F) were decreased. We also analyzed the derived N-glycan traits, namely fucosylation and galactosylation, which were commonly differentially expressed in autoimmune diseases. The level of fucosylation in ITP patients was significantly decreased compared with healthy controls, whereas no statistically significant difference for galactosylation was observed between two groups (Table 2).

Representative desialylated N-glycan profiling for serum and IgG of healthy controls and ITP patients. 12 peaks were identified in all serum samples, and 7 peaks were identified in all IgG samples, and the structures of the N-glycan peaks are shown below the pane. Blue square indicates β-linked N-acetylglucosamine (GlcNAc); green circle indicates α/β-linked mannose; yellow circle indicates β-linked galactose; and red triangle indicates α/β-1,3/6 linked fucose
TABLE 2. Serum and IgG N-glycans in healthy controls and ITP patients Peak or glycosylation Serum IgGControl
(n = 35)
ITP
(n = 61)
P1Control
(n = 35)
ITP
(n = 34)
P2 Peak 1 7.01 ± 1.77 7.37 ± 2.55 0.468 22.32 ± 4.99 28.41 ± 7.51 0.000* Peak 2 1.05 ± 0.35 1.10 ± 0.39 0.480 3.61 ± 1.07 4.42 ± 1.64 0.018* Peak 3 6.56 ± 1.03 5.89 ± 1.38 0.014* 19.81 ± 1.78 22.81 ± 3.14 0.002* Peak 4 5.82 ± 0.96 5.28 ± 0.86 0.006* 12.82 ± 1.37 14.54 ± 2.33 0.000* Peak5 39.15 ± 3.14 42.27 ± 4.36 0.000* 5.52 ± 1.22 5.22 ± 1.24 0.315 Peak 6 21.39 ± 3.62 18.93 ± 2.93 0.000* 29.47 ± 5.93 22.65 ± 6.85 0.000* Peak 7 5.66 ± 1.21 5.34 ± 1.19 0.212 6.44 ± 1.11 2.95 ± 1.36 0.000* Peak 8 7.95 ± 1.81 8.20 ± 2.39 0.599 - - - Peak 9 2.35 ± 1.13 1.90 ± 1.15 0.067 - - - Peak 9p 0.87 ± 0.30 1.05 ± 0.44 0.031* - - - Peak 10 0.32 ± 0.29 0.29 ± 0.11 0.491 - - - Peak 11 1.86 ± 0.53 2.18 ± 0.71 0.025* - - - Fucosylation 48.68 ± 4.68 45.25 ± 5.93 0.004* 94.48 ± 1.22 94.78 ± 1.24 0.315 Galactosylation 91.94 ± 2.03 91.32 ± 2.81 0.259 74.07 ± 5.83 67.17 ± 8.48 0.000* Note Data were expressed as means ±standard deviation (SD); PLT: platelet count; P1: comparison of serum N-glycans between control and ITP; P2: comparison of IgG N-glycans between control and ITP. *p<0.05, the difference is statistically significant.In the aspect of IgG, 6 out of 7 IgG N-glycan peaks showed statistically significant differences between healthy controls and ITP patients. In ITP patients, the relative abundances of agalactosyl peak 1 and peak 2, and monogalactosyl peak 3 and peak 4 were increased, while the relative abundances of bigalactosyl peak 6 and peak 7 were decreased. With regard to glycosylation, IgG galactosylation in ITP patients was significantly decreased compared with healthy controls, whereas IgG fucosylation was not significantly different between two groups (Table 2).
ITP patients with platelet counts (PLT) below 30 × 109/L were usually in high bleeding risk and need drug intervention, so ITP patients were further stratified into two subgroups according to PLT, ITP patients with severe thrombocytopenia (PLT <30 × 109/L), and ITP patients with mild and moderate thrombocytopenia (PLT≥30 × 109/L). The level of serum fucosylation in ITP patients with severe thrombocytopenia was significantly lower than that in ITP patients with mild and moderate thrombocytopenia. With respect to IgG N-glycans, there was no significant difference in the relative abundances of IgG N-glycan peaks and IgG glycosylation between two subgroups (Table 3).
TABLE 3. Serum and IgG N-glycans in ITP patients with PLT≥30 × 109/L and PLT<30×109/L Peak or glycosylation Serum IgGPLT≥30 × 109/L
(n = 39)
PLT<30 × 109/L
(n = 22)
P1PLT≥30 × 109/L
(n = 20)
PLT<30 × 109/L
(n = 14)
P2 Peak 1 7.60 ± 2.37 6.96 ± 2.85 0.347 29.10 ± 7.83 27.42 ± 7.19 0.530 Peak 2 1.12 ± 0.36 1.08 ± 0.44 0.683 4.57 ± 1.61 4.21 ± 1.72 0.535 Peak 3 6.12 ± 1.39 5.47 ± 1.29 0.080 21.58 ± 2.84 22.15 ± 3.61 0.609 Peak 4 5.36 ± 0.90 5.14 ± 0.80 0.330 14.51 ± 1.93 14.57 ± 2.88 0.947 Peak 5 41.51 ± 4.42 43.62 ± 4.01 0.069 5.26 ± 1.26 5.17 ± 1.26 0.828 Peak 6 19.32 ± 2.96 18.23 ± 2.79 0.162 22.10 ± 7.91 23.44 ± 5.14 0.553 Peak 7 5.56 ± 1.12 4.95 ± 1.24 0.052 2.88 ± 1.29 3.05 ± 1.49 0.733 Peak 8 8.04 ± 2.03 8.48 ± 2.94 0.490 - - - Peak 9 1.71 ± 1.03 2.24 ± 1.29 0.080 - - - Peak 9p 1.04 ± 0.38 1.06 ± 0.54 0.842 - - - Peak 10 0.27 ± 0.08 0.34 ± 0.14 0.051 - - - Peak 11 2.16 ± 0.70 2.20 ± 0.76 0.817 - - - Fucosylation 46.40 ± 5.81 43.22 ± 5.71 0.043* 94.74 ± 1.26 94.83 ± 1.26 0.828 Galactosylation 91.09 ± 2.65 91.73 ± 3.08 0.396 66.33 ± 8.97 68.37 ± 7.89 0.498 Note Data were expressed as means ± standard deviation (SD); PLT: platelet counts; P1: comparison of serum N-glycans between ITP with PLT≥30 × 109/L and PLT<30 × 109/L; P2: comparison of IgG N-glycans between ITP with PLT≥30 × 109/L and PLT<30 × 109/L. *p < 0.05, the difference is statistically significant. 3.3 Comparison of N-glycans between serum and IgGN-glycans of serum and IgG were simultaneously analyzed in 35 healthy controls and 34 ITP patients. In order to be consistent with IgG N-glycan peaks, we recalculated the relative abundances of the front 7 N-glycan peaks in serum. The abundances of 7 N-glycan peaks and 2 glycosylations were compared between serum and IgG in paired manner. In ITP patients, 6 out of 7 N-glycan peaks were significantly changed. Among them, the abundances of IgG peak 1, peak 2, peak 3, and peak 4 were significantly increased, while the abundance of IgG peak 5 and peak 7 was significantly decreased, and no significant difference in peak 6 between IgG and serum was found. With regard to glycosylation, IgG fucosylation was increased and IgG galactosylation was decreased compared with serum (Figure 2). Healthy controls had the same changes with ITP patients except for peak 6 and peak 7. In healthy controls, the abundance of IgG peak 6 was significantly increased compared with serum, while the abundance of peak 7 did not show significant difference between IgG and serum (Supplementary data, Figure S2).

Comparisons of N-glycan structure and glycosylation between serum and IgG in ITP patients (n = 34). The diagonal line represents the equal ratio between serum and IgG
3.4 Correlation between N-glycans and platelet counts in ITPFor the significantly differential N-glycans, we further investigated their correlations with platelet counts. The abundance of serum peak 5 was negatively correlated with platelet counts, while serum Peak 3 and fucosylation were positively correlated with platelet counts. In ITP patients with severe thrombocytopenia, the correlations between serum peak 5, serum fucosylation, and platelet counts were deepened and the absolute values of correlation coefficient were both over 0.5, but serum peak 3 was no longer associated with platelet counts (Table 4). Neither IgG N-glycan peak nor IgG glycosylation was significantly correlated with platelet counts in ITP patients and ITP patients with severe thrombocytopenia (Supplementary data, Table S1).
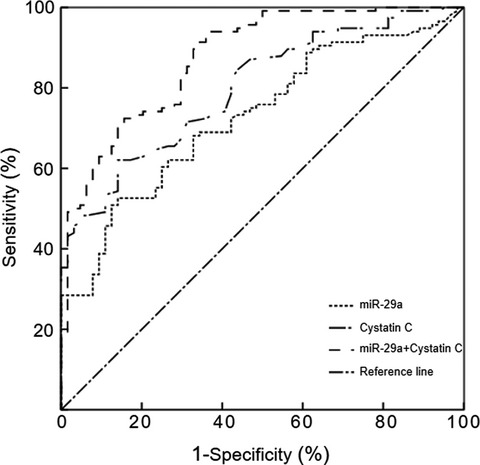
TABLE 4. Correlation between serum N-glycans and platelet counts Correlation Peak3 Peak4 Peak5 Peak6 Peak9p Peak11 Fucosylation ITP (n = 61) r 0.268 0.228 −0.315 0.097 0.052 −0.051 0.329 P 0.036* 0.078 0.013* 0.456 0.690 0.695 0.010* ITP with PLT <30 × 109/L(n = 22) r 0.375 0.158 −0.563 0.335 0.060 0.029 0.548 P 0.086 0.483 0.006* 0.128 0.789 0.898 0.008* Note Pearson correlation test; PLT, platelet counts. *p < 0.05, the difference is statistically significant. 3.5 Assessment of N-glycans as diagnostic biomarkers in ITPReceiver operating characteristic (ROC) curve was used to evaluate the diagnosis efficacies of significantly altered N-glycans for discrimination of ITP patients from healthy individuals. In serum N-glycans, the under area of curve (AUC) of peak 5 was the highest, 0.726 (95% CI 0.624–0.827), with 57.4% sensitivity, and 88.6% specificity for cutoff value 41.720. In IgG N-glycans, the AUC of - IgG peak 7 was the highest, 0.967 (95% CI 0.932–1.000), with 91.2% sensitivity and 91.4% specificity for cutoff value −5.272 (Figure 3). For discrimination of ITP patients with severe thrombocytopenia from ITP patients with mild and moderate thrombocytopenia, the AUC of serum fucosylation was 0.653 (95% CI 0.509–0.796), with a sensitivity of 68.2% and a specificity of 59.0% for cutoff value −45.299 (Figure 4).

Receiver operating characteristic (ROC) curve in prediction of clinically significant discrimination of ITP patients from healthy individuals. (A) The ROC of significantly altered serum N-glycans. (B) The ROC of significantly altered IgG N-glycans

Comparison of serum fucosylation between ITP patients with PLT<30 × 109/L (n=22) and ITP patients with PLT≥30 × 109/L (n = 39) and ROC curves. (A) Comparison of serum fucosylation between ITP patients with PLT<30 × 109/L and ITP patients with PLT≥30 × 109/L. (B) ROC curves of serum fucosylation for discriminating ITP patients with PLT<30 × 109/L from ITP patients with PLT≥30 × 109/L
4 DISCUSSIONProtein glycosylation, the most common post-translational modification, finely tunes the function of proteins. Addition of different N-glycans to IgG plays an important role in regulating the pro-inflammatory or anti-inflammatory activities of IgG. For example, high level of sialylation in IgG Fc fragment decreased inflammatory activity of IgG,2 whereas lack of core fucose residues improved cytotoxic activity of IgG.22 Studies on the glycosylation alteration of antibodies could assist in understanding the exact underlying pathophysiological mechanism23, 24 and possibly provide novel biomarkers or therapeutic targets for autoimmune and inflammatory diseases including ITP.
The exact pathophysiological mechanism of ITP is not yet fully understood and its diagnosis is exclusive. In order to explore the potential of N-glycans as auxiliary diagnostic biomarkers for ITP, we analyzed N-glycan profiling both serum and IgG in ITP patients and healthy controls, and found alterations of N-glycan structure and glycosylation in ITP. 6 of 12 serum N-glycan peaks, 6 of 7 IgG N-glycan peaks, serum fucosylation, and IgG galactosylation were significantly different between ITP patients and healthy controls. In terms of diagnostic efficacy for discriminating ITP patients from healthy individuals, IgG N-glycans were collectively better than serum N-glycans. Of the significantly altered N-glycans, the diagnostic efficacy of IgG peak 7 (bigalactosylated, core-α-1,6-fucosylated biantennary, NA2FB) was the best, and the AUC of – IgG peak 7 was 0.967. IgG peak 7 had the potential for auxiliary diagnosis of ITP, but its usefulness as a diagnostic biomarker of ITP should be further evaluated. Larger sample size and secondary thrombocytopenic disorders such as SLE and Evan's syndrome should be included in the validation investigation.
The significantly altered glycosylation of ITP patients was different in serum and IgG, which may be caused by the differently altered N-glycan structures in serum and IgG. For IgG, ITP patients exhibited increased agalactosylation (peak 1 and peak 2) and decreased digalactosylation (peak 6 and peak 7), which resulted in a decrease in the level of IgG galactosylation. Low IgG galactosylation was also observed in a number of autoimmune and inflammatory diseases such as RA,9 SLE,7 Crohn's disease (CD), ulcerative colitis (UC),8 and ANCA-associated vasculitis,25 and may be not a disease-specific marker. As with other autoimmune disorders, inflammation plays an important role in the development of ITP.26 It was reported that low galactosylation had increased pro‑inflammatory activity of IgG. So, we speculate the decrease in IgG galactosylation may be a reflection of inflammatory state of ITP. However, two other ITP related researches did not detect a decrease in IgG galactosylation.17, 18 This inconsistence may be caused by different glycosylation analysis method, different patients background, and small sample size. For serum, the N-glycans with core fucose (peak 3, peak 4, and peak 6) were decreased, while the N-glycans without core fucose (peak 5 and peak 11) were increased, which resulted in a decrease in serum fucosylation of ITP patients. Furthermore, ITP patients with low serum fucosylation were more likely to develop severe thrombocytopenia, and the AUC of - fucosylation for distinguishing ITP patients with severe thrombocytopenia from those with mild and moderate thrombocytopenia was 0.653. The decrease in serum fucosylation was also observed in multiple sclerosis.
留言 (0)