
記住我
Severe acute respiratory syndrome coronavirus 2 (SARS-CoV-2) spreads rapidly worldwide, causing about 5 million deaths while writing this manuscript. During this prolonged COVID-19 pandemic, cost-effective rapid antigen tests (RATs) are warranted to detect SARS-CoV-2, especially in resource-limited settings. Currently, the real-time reverse transcription–polymerase chain reaction (rRT-PCR) is globally used and considered as the reference technique for detecting SARS-CoV-2 using nasopharyngeal (NP) swabs, throat swabs, nasal swab (NS), or saliva.1-4 However, rRT-PCR requires highly trained laboratory personnel and well-equipped laboratory facilities. Therefore, in a resource-limited setting, specimens required transportation to a laboratory with rRT-PCR capability. This transportation, along with a time-consuming rRT-PCR procedure, delays in delivering test results and increases the anxiety of the suspected COVID-19 patients. Also, this delay in test result delivery increases the risk of SARS-CoV-2 transmission, especially in densely populated areas.5-7
The RAT using lateral flow principles have been introduced as quick and cost-effective methods to detect SARS-CoV-2 proteins. The most important feature of these test kits is that they can be used as point-of-care (POC) diagnostic tools that require neither trained laboratory personnel nor well-equipped laboratory facilities. These kits can increase the turn-around time for quick isolation of suspected cases in a remote and resource-limited area. Although the RAT is less sensitive than rRT-PCR, they can detect SARS-CoV-2 specimens of high viral load.7-12 Therefore, several countries approved these kits for mass screening.13
Performance of RATs may vary depending on different influencing factors such as specimen type, quality of specimens, collection at the particular time point of disease progression, and viral load. For example, the sensitivity of SD Biosensor rapid SARS-CoV-2 antigen kits ranged from 75% to 98% in different settings.14, 15 World Health Organization (WHO) recommended that a RAT should show at least 80% sensitivity with clinical specimens.16
Usually, NP specimens are recommended to detect respiratory viruses, including SARS-CoV-2, owing to their high sensitivity.17 However, obtaining NP specimens are difficult than NS and often requires trained personnel to avoid neck injury. In contrast, NS specimens can be collected more rapidly and efficiently; this technique can also be used for the self-sampling method. Previous studies showed that SARS-CoV-2 could be detected in NS specimens at an early stage of infection; however, viral load and sensitivity of NS have been a concern.18
The new RAT InTec Rapid SARS-CoV-2 Antigen Test (InTec PRODUCTS, INC., Fujian, P. R. China) was evaluated under field condition in Bangladesh. We compared the performance of this kit with the WHO recommended kit, Standard Q COVID-19 Ag (SD Biosensor, Korea), and gold standard rRT-PCR test.
2 MATERIALS AND METHODS 2.1 Study design and participant enrollmentA cross-sectional study of the diagnostic tests was designed to compare the performance of RATs with detect SARS-CoV-2 antigen. According to FDA, USA guideline, a minimum of 30 positive specimens and 30 negative specimens are required to evaluate each test.19 Accordingly, we enrolled 214 COVID-19 symptomatic participants who fulfilled WHO case definitions for COVID-19 and who had known rRT-PCR test results within the last 24 h, using NP swab. The criteria were as (i) all age group (ii) either sex; (iii) acute onset of fever or cough; OR (iv) acute onset of any three or more of the presented signs or symptoms, general weakness/fatigue, headache, myalgia, sore throat, runny nose, nasal congestion, dyspnea, anorexia/nausea/vomiting, diarrhea, and altered mental status.
2.2 Ethical statementsThis study protocol was approved by the Institutional Review Board of icddr,b (PR-20146). We obtained signed informed consent from all study participants before specimen and data collection, and followed standard biosafety and biosecurity protocols during sample collection and transportation. The funder of the study had no role in study design, data collection, data analysis, data interpretation, or writing of the report.
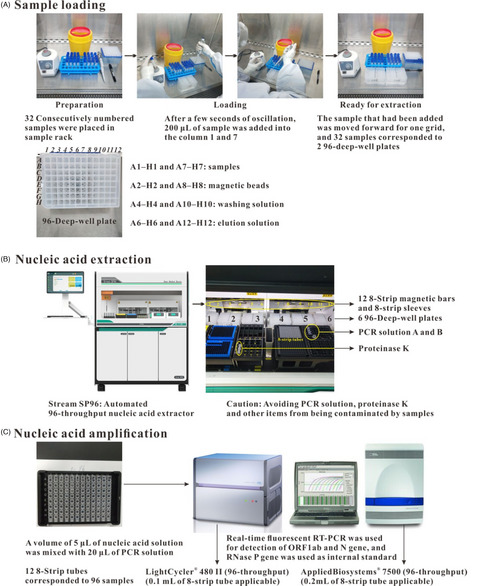
2.3 Clinical specimen collectionDuring May-August 2021, we collected 214 paired NP and NS specimens in a 1-ml viral transport media (VTM) for rRT-PCR and SD Biosensor and 200-µL buffer solution supplied with the InTec kit according to the manufacturer's instructions. We tested the specimens using rRT-PCR (following China CDC protocol), InTec (lot number: GJ21040477, Fujian, China), and SD Biosensor kits (lot number: QCO3020021C, Gyeonggi-do, South Korea), and the results were interpreted according to the manufacturers’ guidelines.
2.4 Rapid antigen testBoth InTec (Fujian, China) and SD Biosensor (Gyeonggi-do, South Korea) rapid tests use a lateral flow test format and are available as a cassette with a nitrocellulose strip containing control line (C) and test line (T). As per the InTec instructions, NP and NS specimens were collected and placed into the extraction buffer. Five drops of specimens were then dispensed in the ‘specimen well’ and observed the results in the ‘result window’ between 15 and 20 min. Finally, the test results were recorded based on the color intensity of the band in the ‘test line’. As for SD Biosensor, NP and NS specimens were collected and placed into VTM. Specimens in VTM, 350 µL, was mixed with the extraction buffer supplied with the kit. Three drops of specimens were dispensed in the ‘specimen well’ and observed the results in the ‘result window’ between 15 and 30 min. Finally, the test results were recorded based on the color intensity of the band in the ‘test line’ by comparing them with a color-reference rating card.
2.5 Real-time RT-PCRWe extracted total viral RNA from 200 μL of each NP and NS specimen using the chemagic viral NA/gDNA kit (PerkinElmer, MA, USA) and tested the RNA for SARS-CoV-2 by rRT-PCR targeting ORF1ab (RdRp)-specific primers and probes following the protocol of the Chinese Center for Disease Control and Prevention (briefly as China CDC).20 In brief, we prepared rRT-PCR reaction mixtures with iTaq™ Universal Probes and One-Step Reaction Mix (Bio-Rad Laboratories, Inc., Hercules, CA, USA), and CFX96 Touch™ Real-time PCR Detection System (Bio-Rad Laboratories, Inc., Hercules, CA, USA) was used.21 We categorized all rRT-PCR-positive specimens as strong (Ct < 25), moderate (25–30), and weak (Ct > 30) positives.
2.6 COVID-19 case definitionCOVID-19 cases were defined as either one NP or NS was positive by RT-PCR.
2.7 Statistical analysisWe calculated the sensitivity, specificity, and accuracy of the RATs with a 95% confidence interval (95% CI) using MedCalc online statistical software22 using the following formula:
Diagnostic sensitivity = a/(a + c) × 100 (%) (95% CI), specificity = d/(b + d) × 100 (%) (95% CI), and accuracy = a + d / (a + b + c +d) × 100 (%) (95% CI), where a, true positive; b, false positive; c, false negative; and d, true negative. We analyzed data by Excel, SPSS version 21, EPI Info, and Graphpad prism9 software. We compared the influencing factors against the performance of RATs by chi-squared tests (95% CI).
3 RESULTSAmong 214 participants, 118 were male, mean age was 40.6 years (range 0.5 to 95.0), and median was 38.0. We considered several factors such as specimen type, viral load, different disease stages (days of symptom onset), and presenting symptoms to evaluate the rapid kit performances. We documented major symptoms of COVID-19 when the participants submitted specimens. Fever was identified in 88% of the participants while coughing, 78%; muscle aches, 45%; sore throat, 28%; runny nose, 48%; shortness of breath, 21%; headache, 56%; loss of appetite, 14%; vomiting, 12%; nausea, 20%; joint aches,17%; diarrhea, 17%; and altered smell, 27%.
3.1 Specimen typesAmong 214 study participants, a total of 112 NP or NS specimens were COVID-19 positive by rRT-PCR. Both NP and NS specimens were positive for 100 cases, 112 was positive for NP only, and 100 was positive for NS only.
3.1.1 Nasopharyngeal swab specimenAmong 112 rRT-PCR-positive NP specimens, 102 (90.2%) and 95 (84.8%) were positive by InTec and SD Biosensor, respectively. All rRT-PCR negative (n = 102) remained negative using InTec rapid kits; however, all except 3 were negative using SD Biosensor. Thus, comparing with rRT-PCR results, the overall sensitivity of InTec for NP was 90.2% (95% CI, 83.1 to 95.0), the specificity was 100.0% (95% CI, 96.5 to 100.0), and the accuracy was 94.9% (95% CI, 91.0 to 97.4). The overall sensitivity of SD Biosensor was 84.8% (95% CI, 76.8 to 90.9), the specificity was 97.1% (95% CI, 91.6 to 99.4), and the accuracy was 90.7% (95% CI, 85.9 to 94.2) (Table 1). The average sensitivity, specificity, and accuracy of the two RATs were 87.5%, 98.6%, and 92.8%, respectively.
TABLE 1. Nasopharyngeal and nasal swab: rapid antigen kits vs rRT-PCR (RdRp) rRT-PCR InTec Rapid SARS-CoV−2 Antigen Test SD Biosensor Rapid SARS-CoV−2 Antigen Test Positive Negative Positive NegativeSensitivity
(95% CI)
Specificity (95% CI) Accuracy (95% CI) Positive NegativeSensitivity
(95% CI)
Specificity (95% CI) Accuracy (95% CI) NP Ct <25 86 NA 85 NA98.8
(93.7 to 99.9)
NA NA 84 NA 97.7 (91.9 to 99.7) NA NA Ct 25–30 10 NA 8 NA 83.3 (51.6 to 97.9) NA NA 4 NA 62.5 (35.4 to 84.8) NA NA Ct >30 16 NA 8 NA 50.0 (24.7 to 75.4) NA NA 7 NA 43.8 (19.8 to 70.1) NA NA Overall 112 102 101 102 90.2 (83.1 to 95.0) 100.0 (96.5 to 100.00) 94.9 (91.0 to 97.4) 95 99 84.8 (76.8 to 90.9) 97.1 (91.6 to 99.4) 90.7 (85.9 to 94.2) NS Ct <25 55 NA 55 NA 100.0 (93.5 to 100.0) NA NA 54 NA 98.2 (90.3 to 99.9) NA NA Ct 25–30 24 NA 19 NA 82.8 (64.2 to 94.2) NA NA 18 NA 80.0 (61.4 to 92.3) NA NA Ct >30 21 NA 6 NA 28.6 (11.3 to 52.2) NA NA 6 NA 28.6 (11.3 to 52.2) NA NA Overall 100 114 80 111 80.0 (70.8 to 87.3) 97.4 (92.5 to 99.5) 89.6 (84.3 to 93.1) 78 108 78.0 (68.6 to 85.7) 94.7 (88.9 to 98.0) 86.9 (81.7 to 91.1) Note NA: Not applicable since negatives have no Ct values. 3.1.2 Nasal swab specimensAmong 100 rRT-PCR-positive NS specimens, 80 (80%) and 78 (78%) were positive using InTec and SD Biosensor, respectively. Among 114 rRT-PCR-negative specimens, 3 and 6 were false positive using InTec and SD Biosensor, respectively. Thus, the overall sensitivity of InTec for NS was 80.0% (95% CI, 70.8 to 87.3), the specificity was 97.4% (95% CI, 92.5 to 99.5), and the accuracy was 89.6% (95% CI, 84.3 to 93.1) (Table 1). SD Biosensor kit showed the overall sensitivity was 78.0% (95% CI, 68.6 to 85.7), the specificity was 94.7% (95% CI, 88.9 to 98.0), and the accuracy was 86.9% (95% CI, 81.7 to 91.1). The average sensitivity, specificity, and accuracy of the two RATs were 79.0%, 96.1%, and 88.3%, respectively.
3.2 Viral load (Ct value)The NP specimens showed significantly low Ct values than NS specimens (mean 21.5, SEM 0.61, median 19.9, SD 6.5 vs. mean 25.0, SEM 0.58, median 24.6, SD 5.8; p < 0.001), and several NP-positive specimens resulted in negative for NS (Figure 1). For NP, among strong positives (Ct < 25), the sensitivity of InTec was 98.8% (95% CI, 93.7 to 99.9) and SD Biosensor was 97.7% (95% CI, 91.9 to 99.7). As for strong to moderate positives (Ct 25–30), the sensitivity of InTec and SD Biosensor was 83.3% (95% CI, 51.6 to 97.9) and 62.5% (95% CI, 35.4 to 84.8), respectively. The sensitivity for weak positive (Ct > 30) specimens was comparatively lower; 50.0% (95% CI, 24.7 to 75.4) using InTec and 43.8% (95% CI, 19.8 to 70.1) using SD Biosensor (Table 1).

Scatter dot plot for all specimens; X-axis denotes rRT-PCR Ct value for RdRp gene using nasopharyngeal swab specimen, and Y-axis denotes rRT-PCR Ct value for RdRp gene using nasal swab specimen
NS also showed similar sensitivity pattern considering Ct values; for strong positive, the sensitivity of InTec and SD Biosensor was 100.0% (95% CI, 93.5 to 100.0) and 98.2% (95% CI, 90.3 to 99.9), while for moderate positive (Ct 25–30) specimens, the sensitivity of InTec and SD Biosensor was 82.8% (95% CI, 64.2 to 94.2) and 80.0% (95% CI, 61.4 to 92.3) (Table 1). The sensitivity of both RATs was much lower, 28.6% (95% CI, 11.3 to 52.2) for weak positives. In summary, we observed a progressive decline in the performance of RATs with the increased Ct values (Figure 1). In addition, we observed no remarkable difference in the performance of both RATs using NP and NS (Figure 2).

Comparison of the rapid test result. (A) Box plot of rRT-PCR Ct value (positive only) compared with rapid test–positive and –negative result using a nasopharyngeal swab. (B) Box plot of rRT-PCR Ct value (positive only) compared with rapid test–positive and –negative result using a nasal swab
3.3 Clinical consequences over the performance of RATsWe analyzed the performance of RATs using NP (112 positive and 102 negative) and NS (100 positive and 114 negative) specimens to evaluate clinical consequences over the performance.
3.3.1 Onset of symptomsWe categorized the participants into three groups according to the onset of symptoms: 0–3 days (29, 13.6%), 4–7days (117, 54.7%), and >7 days (68, 31.7%) (Table 2). Those who presented within 0–3 days were less likely to be positive than those between 4–7 days and >7 days using rRT-PCR. On the other hand, the sensitivity of InTec and SD Biosensor during 0–3 days was 100% compared with 96.6% vs. 89.8 during 4–7 days and 80.4% vs. 76.1% during >7 days using NP. As for NS, however, the highest sensitivity was observed for 4–7 days (Table 2).
TABLE 2. Comparison of the rapid test based on the days of symptom onset and viral load using NP and NS specimens Ct value Test NP NS 0–3 days (n = 29) 4–7 days (n = 117) >7 days (n = 68) 0–3 days (n = 29) 4–7 days (n = 117) >7 days (n = 68) Positive Sensitivity Positive Sensitivity Positive Sensitivity Positive Sensitivity Positive Sensitivity Positive Sensitivity <25 rRT-PCR 7 46 32 5 28 16 InTec 7 100 46 100 31 96.9 5 100 28 100 16 100 SD Biosensor 7 100 46 100 31 96.9 5 100 28 100 16 100 25–30 rRT-PCR 0 5 6 1 17 14 InTec 0 5 100 4 66.7 0 0 15 88.2 12 85.7 SD Biosensor 0 2 40.0 2 33.3 0 0 15 88.2 10 71.4 >30 rRT-PCR 0 8 8 1 8 10 InTec 0 6 75.0 2 25.0 0 0 2 25.0 2 20.0 SD Biosensor 0 5 62.5 2 25.0 0 0 2 25.0 2 20.0 Overall rRT-PCR 7 59 46 7 53 40 InTec 7 100 57 96.6 37 80.4 5 71.4 45 84.9 30 75.0 SD Biosensor 7 100 53 89.8 35 76.1 5 71.4 45 84.9 28 70.0 3.3.2 SymptomsAll study participants were symptomatic and presented different symptoms, as mentioned above. However, we did not find any significant association of symptoms with the sensitivity of the RATs (Supplementary Table ST1).
4 DISCUSSIONIn this study, we evaluated the performance of the SARS-CoV-2 RATs, considering different influencing factors. The RATs showed strong performance in field conditions. Three major factors, ie, specimen types, viral load (Ct values), and the onset of symptoms, were identified as the influencing factors for the sensitivity of the RATs; however, we did not find any association of symptoms with the kit sensitivity.
The rRT-PCR quantitative values for NS were inconsistent, possibly due to uneven NS specimen collection. Therefore, both InTec and SD Biosensor RATs showed higher performance with NP specimens than NS specimens, which might be due to the low viral load in the NS specimen (relatively high Ct value). Moreover, in the early stage of COVID-19 infections, we found high viral load (low Ct value), resulting in increased sensitivity of NP specimens (100% sensitivity) than NS (71% sensitivity). Thus, considering the specimen type, NP was found more sensitive than NS.
We found that both RATs showed high performance (>90% sensitivity) for lower Ct values (Ct ≤ 30). Previous studies showed that the rRT-PCR and other nucleic acid amplification tests (NAATs) were more sensitive than antigen tests to diagnose SARS-CoV-2,23 which is inline with our findings where we found the relatively lower performance of RATs than rRT-PCR. However, the RATs (InTec and SD Biosensor) fulfilled the minimum performance limit for sensitivity (>80%) and specificity (>97%) set by WHO for the COVID-19 antigen test.16
Considering only symptomatic cases for enrollment was a limitation of this study as asymptomatic individuals could carry SARS-CoV-2 and act as the silent killer by accelerating viral spread in the community.24-26 Future studies should include asymptomatic populations and a more significant number of symptomatic cases with different times of symptom onset to observe the actual scenario. Also, rapid kit evaluation using a specimen from the asymptomatic individual will provide more confidence to use this kit for mass screening in entry points such as airports, educational institutes, and offices. However, the rapid kits are Ct value-dependent; thus, the kits will also be effective for asymptomatic cases.27, 28 Another limitation of the study was evaluating the antigen test based on rRT-PCR results from clinical specimens, which missed more positive cases during the NS specimen test. Therefore, a virus culture assay would be helpful to identify the true positive cases for better evaluation of RATs.29
In conclusion, the best performance of the RATs can be achieved with NP specimens within the first week of the onset of symptoms with high viral load. During this prolonged pandemic, the RATs can be applied to mass screening for SARS-CoV-2 including asymptomatic individuals to reopen the office and educational institutes to limit the SARS-CoV-2 transmission.
ACKNOWLEDGMENTSThe InTec PRODUCTS INC. funded the study. icddr,b acknowledges with gratitude the commitment of the InTec PRODUCTS, INC. to its research efforts. icddr,b is also grateful to the Government of Bangladesh, Canada, Sweden, and the UK for providing core/unrestricted support.
CONFLICT OF INTERESTMR received funding from InTec PRODUCTS, INC., for this work. ZL and TK are scientific staff of the InTec PRODUCTS, INC. but had no role in sample collection, laboratory evaluation, and analysis of this study. All other authors had no competing interests.
AUTHOR CONTRIBUTIONSMR developed the protocol, methodology, conceived and coordinated the study, and reviewed the manuscript. MNB was involved in laboratory data interpretation, cleaned and finalized the dataset, performed the descriptive analyses, and prepared the first draft of the manuscript. MJ was involved in the analysis of laboratory data and provided intellectual input in the manuscript. KN built the questionnaires, collected clinical data for study participants, and supervised the specimen collection and recording. SR was involved in data analysis and intellectual input, and MT performed laboratory testing and provided intellectual information in data analysis. SS coordinated all the rapid tests in the field site. ANU, SK, and MSU were involved in study participant enrollment. ZL and TK critically reviewed the manuscript and provided intellectual input. MZR coordinated all the laboratory procedures and verified the data. All authors reviewed subsequent drafts of the manuscript and approved the final version.
All the data related to this work are available with the manuscript and supplementary file. All authors had full access to all the data in the study and accepted the responsibility to submit for publication.
Filename Description jcla24203-sup-0001-TableS1.docxWord 2007 document , 14.7 KB Table S1Please note: The publisher is not responsible for the content or functionality of any supporting information supplied by the authors. Any queries (other than missing content) should be directed to the corresponding author for the article.
REFERENCES
1Sethuraman N, Jeremiah SS, Ryo A. Interpreting diagnostic tests for SARS-CoV-2. JAMA. 2020; 323(22): 2249- 2251. 2Corman VM, Landt O, Kaiser M, et al. Detection of 2019 novel coronavirus (2019-nCoV) by real-time RT-PCR. Eurosurveillance. 2020; 25(3): 2000045. 3Organization. Laboratory testing strategy recommendations for COVID-19: interim guidance [Internet]. World Health. 2020;. [cited 21 March 2020]. Available from: https://apps.who.int/iris/bitstream/handle/10665/331509/WHO-COVID-19-lab_testing-2020.1-
留言 (0)