
記住我

Cervical cancer is the fourth most common cancer in women worldwide, as approximately 570,000 women developed cervical cancer and 311,000 died of the disease in 2018.1 Human papillomavirus (HPV) infection is a common cause of cervical cancer and its precancerous lesions as well as cervical intraepithelial neoplasia (CIN). Previous studies have indicated that cervical lesions should be managed according to HPV genotype.2 Besides HPV genotype, patients with cervical lesions are also managed according to their CIN classification (CIN1, CIN2, and CIN3). The risk stratification of patients with cervical lesions according to HPV genotype and CIN classification is critical to present effective treatment strategies while avoiding obstetric complications.3, 4
In this context, the prognosis of CIN lesions according to HPV genotype has been assessed.5 A continuous-time multistate Markov model was also applied to accommodate the bidirectional feature of CIN lesions6; for example, CIN2 can regress to CIN1 or to a normal condition, remain as CIN2, or progress to CIN3 or cervical cancer.7 However, another concern when building structural models of CIN lesion prognosis is diagnostic misclassification. Although CIN diagnosis is based on the combination of cytological and histological examinations aided by colposcopy, the accuracy of CIN diagnosis is limited, resulting in the misclassification of the “true” pathology of the lesion. For example, cytologic diagnosis was shown to have low sensitivity in detecting CIN2 or more severe lesions.8 Colposcopy-directed biopsy also tends to underestimate the CIN severity compared with a diagnosis confirmed by surgery.9 Nevertheless, few studies have evaluated HPV pathogenesis, accounting for the probability of diagnostic misclassification.10
To accommodate these types of measurement challenges, various latent variable models (e.g., factor models and structural equation models) have been adopted in medical research.11 Latent variable models can manage unobserved random variables. Recently, another latent variable model, a hidden Markov model, was applied to model (i) the transition between the (unobserved) “true” states and (ii) the probabilities of the “observed” state conditional on the “true” states (misclassification probabilities).12, 13 In contrast, a Markov model can model only transitions between observed states. In addition to other latent variable models, hidden Markov models have been applied in clinical settings with measurement challenges, such as frailty, HIV infection, and diabetic retinopathy.14-16
In this study, we applied a hidden Markov model to our cohort of HPV-infected patients to clarify the natural course of CIN according to HPV genotype, which accounted for the misclassification probability. We aimed to confirm the robustness of the current literature, including a previous study that used a Markov model, on the CIN characteristics according to HPV genotype. Using this model, we also quantified the misclassification probability in CIN diagnosis.
2 MATERIALS AND METHODS 2.1 Study cohortBetween October 1, 2008 and March 31, 2015, 1427 female patients underwent HPV genotyping at the Obstetrics and Gynecology Department of the University of Tokyo Hospital (Tokyo, Japan). Patients with mild cervical lesions were also followed up at this hospital instead of being referred to other clinics. We reviewed the electronic medical records (EMRs) of those patients and extracted information on pathological (cytological and histological) examinations and treatment of cervical lesions as previously described.6
To clarify the natural course of cervical lesions according to the CIN classification, we constructed a dataset that included patients (i) diagnosed with normal cervical lesions, CIN1, or CIN2 at the time of entry and (ii) who visited the Obstetrics and Gynecology Department at least twice during the follow-up period. Patients were excluded if they had HPV 6-single-positive lesions with the sole diagnosis of condyloma during the follow-up period and if they had only glandular lesions. Patients with multiple HPV genotypes were excluded. One patient with malignant lymphoma was also excluded. Patients were followed up until they received treatment, until they were diagnosed with CIN3 or cervical cancer, until they were moved to another hospital, or until March 31, 2018, whichever occurred first. Finally, 729 patients (6082 observations) were included in the dataset (Figure 1).

Flowchart illustrating the sample selection
This study was performed under the principles of the Declaration of Helsinki and was approved by the ethics committee of the Graduate School of Medicine, University of Tokyo (nos. 1390–1, G10082-11, and G0637-8).
2.2 Variables 2.2.1 HPV genotypeA cervical swab sample was collected from each patient at the time of entry or at the first visit when the HPV DNA genotype was determined. DNA was extracted from the cervical samples with a DNeasy Blood Mini Kit (Qiagen), the procedure for which has been previously described.6 For each patient, we confirmed the HPV genotype, which was recorded in the EMRs. Since the genotyping was performed only once for each patient, the HPV genotype did not change over time. We classified HPVs into Group 1 or Group 2A (HPVs 16, 18, 31, 33, 35, 39, 45, 51, 52, 56, 58, 59, and 68) as “high-risk HPVs” (hrHPVs) according to the classification of the International Agency for Research on Cancer.17 We focused on HPVs 16, 18, 52, and 58.6 hrHPVs other than these four genotypes were defined as “other hrHPVs.” The remaining HPVs were classified as “no hrHPVs.” Patients without HPV infection were placed into this category (i.e., “no hrHPV” patients).
2.2.2 Pathological diagnosisThe dates of visits and the trajectory of cytological and histological results were maintained in the EMRs of each patient. At the patient’s first visit, we collected a histological sample via colposcopy. Thereafter, we performed repeated cytological and/or histological examinations in line with each patient’s visits. The histological examination was performed at the gynecologists’ discretion, especially when colposcopic findings indicated severe lesions compared with the previous diagnosis, the disease had progressed since the previous assessment, or when lesions that tended to exhibit discrepancies in cytological and histological diagnoses were observed.
Based on the cytological and histological results obtained after each visit, we grouped the pathological diagnoses at each visit into one of the following four CIN categories: normal, CIN1, CIN2, and CIN3/cancer. For some controversial records, the investigators (gynecologic oncology experts) discussed and determined the following: (i) CIN1–2 was classified as CIN1, (ii) CIN2–3 was classified as CIN2, (iii) uncertain diagnoses (e.g., atypical squamous cells of uncertain significance, atypical squamous cells that cannot exclude high-grade squamous intraepithelial lesion [HSIL], and dysplasia without grading) were excluded from diagnostic reliability, and (iv) if the histological and cytological results were not identical, we accepted the more severe result as the diagnosis. We classified CIN1–2 as CIN1 and CIN2–3 as CIN2 in order to mitigate the overdiagnosis from the fourth protocol.
Furthermore, based on the dates of patients’ visits, we calculated the follow-up time at the time of each examination. The age of the patients at the time of entry was extracted from the EMRs.
2.3 Continuous-time multistate hidden Markov modelWe applied the continuous-time multistate hidden Markov model to account for the possibility that pathological examinations were subject to misclassification and for the natural bidirectional course of cervical lesions. This statistical model contains two parts: (i) the transition between the “true” pathological states and (ii) the probabilities of the “observed” diagnosis conditional on the “true” pathological states (misclassification probabilities).13, 18
We assumed transitions of the “true” pathological states and the misclassification patterns as shown in Figure 2. For each of the underlying true states and the observed states, the state space was with each element corresponding to state 1, state 2, state 3, and state 4, respectively. Each observed state was determined by the underlying true state and misclassification. All transitions between adjacent true states were allowed in this model, except for the transition from CIN3/cancer to CIN2, as CIN3/cancer was the absorbing state. The transition parameter represents the transition intensity, which can be interpreted as an instantaneous rate of transition from the true pathological state i to the true pathological state j (e.g.,
  denotes the transition intensity from true CIN1 to true CIN2). Based on the clinical assumption that adjacent misclassifications could account for most diagnostic misclassifications, we assumed the following misclassification matrix for the estimation (Figure 2):
 where
where  denotes the probability of observing the state s conditionally on the true state r (e.g.,
  denotes the probability of observing CIN3 when the true state is CIN2). In other words, we allowed for just a “one-step” misclassification adjacent to the true state.
 Hidden Markov model for the underlying true pathological states (CIN categorization). We defined four states: normal (state 1), cervical intraepithelial neoplasia 1 (CIN1, state 2), CIN2 (state 3), and CIN3/cancer (state 4). The arrows in this figure specify possible transitions among these states; all transitions between adjacent states were allowed, except for the transition from CIN3/cancer to CIN2 (i.e., CIN3/cancer was the absorbing state). The transition parameter
  represents an instantaneous rate of transition from the true pathological state i to the true pathological state j.
  denotes the probability of observing the state s conditionally on the true state r (
 = 1−
= 1− ,
,  = 1−
= 1− −
− ,
,  = 1−
= 1− ,
,  = 1−
= 1− )
2.4 Statistical analysis
)
2.4 Statistical analysis
First, we reported the summary statistics of patients according to HPV genotype (HPV 16, 18, 52, 58, other hrHPVs, and no hrHPVs) and observed diagnoses at the time of entry. We also showed the transition of diagnoses according to HPV genotype over two successive examinations.
Next, a maximum likelihood procedure was applied to estimate the parameters  and
and  using the msm package in R.18 The estimates were derived to maximize a likelihood function composed of the transition probabilities among the true states and the misclassification probabilities conditional on the true state. Along with the parameter estimation, the “true” initial distribution was also estimated in the models. The detailed formulation of the likelihood function is described elsewhere.18 To account for possible differences in the natures of HPV genotypes, we introduced dummy variables representing each HPV genotype (except for “no hrHPVs,” the reference genotype). These dummy variables were included in the model as covariates for the transition parameter
  . Furthermore, we simulated the probabilities of transitions among the true states for up to 2 years. We selected the span of 2 years for two reasons. First, a two-year transition prediction is considered a good benchmark for the prognosis of hrHPV-related cervical lesions. At least half of those lesions have been reported to regress to a normal state and approximately 10% progress to CIN3 within 2 years.5 Second, the median follow-up period of our subjects was approximately three years. Hence, a transition prediction beyond this period was unwarranted. Finally, we evaluated our model by visually comparing the prevalence of observed diagnoses and that of simulated observed diagnoses, which was derived by right-multiplying the simulated “true” prevalence matrix by the estimated misclassification matrix. R 3.6.2 (R Foundation) was used for all analyses.19
To confirm the robustness of our primary analysis, we performed two different sensitivity analyses. First, we assumed another misclassification matrix for the CIN categorization. Specifically, we set  in the misclassification matrix to zero. We performed this sensitivity analysis because the estimation of the parameter
  jointly with
  in the CIN analysis was supposedly unstable due to the nature of our dataset. Since the analysis of patients in our dataset with the CIN categorization was truncated once they were diagnosed with CIN3/cancer, the available observations to estimate
  were reasonably scarce. Using this sensitivity analysis, we aimed to stabilize the estimation of
  to examine whether the estimates in the primary analysis were subject to this instability.
Second, to clarify the natural course of cervical lesions according to the two-tier classification (World Health Organization 2020),20 we constructed another dataset based on that classification (i.e., normal, low-grade squamous intraepithelial lesion [LSIL], and HSIL). The details of this dataset are described in the Supplemental material (eAppendix 1, Figure S1). We applied the same analysis as in the CIN categorization for the two-tier classification according to the model specified in Figure S2. For these sensitivity analyses, the estimated misclassification matrix was presented. The probabilities of transitions among the true states up to two years were then simulated.
3 RESULTS 3.1 Patient characteristicsTable 1 shows the characteristics of our study subjects. In total, 729 patients in the CIN category were enrolled with a mean follow-up of 3.3 years (standard deviation [SD]: 2.4 years). The mean age at the time of entry was 39.1 years (SD: 9.8 years), and the mean number of visits was 8.3 (SD: 5.4). At the time of entry, 185 (25.3%), 270 (37.0%), and 274 (37.6%) patients were diagnosed as normal or with CIN1 or CIN2, respectively.
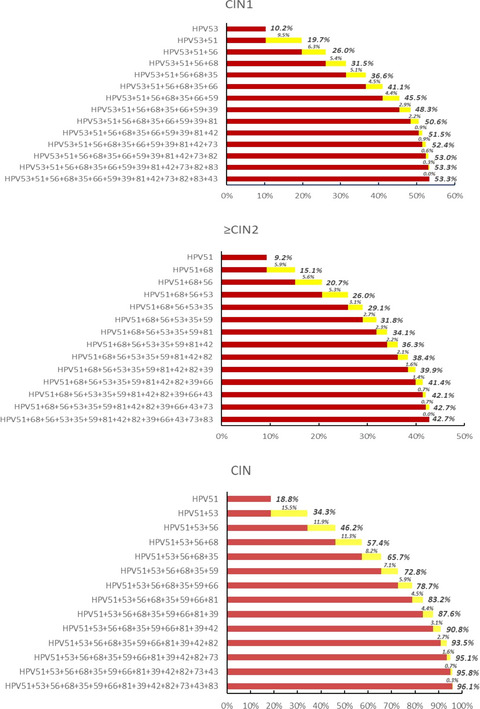
TABLE 1. Basic characteristics of the study subjects at the time of entry (CIN categorization) Diagnosis at the time of entry HPV 16 HPV 18 HPV 52 HPV 58 Other hrHPVs No hrHPVs All Normal N 8 7 14 10 24 122 185 Age at entry (years), mean (SD) 39.9 (8.2) 45.3 (15.9) 38.0 (10.1) 44.9 (17.4) 42.7 (16.3) 41.2 (10.5) 41.5 (11.9) Number of visits, mean (SD) 6.6 (5.8) 8.4 (2.7) 8.9 (7.2) 7.0 (5.0) 8.0 (4.8) 6.5 (4.0) 7.0 (4.5) Follow-up interval (years), mean (SD) 0.47 (0.35) 0.48 (0.30) 0.51 (0.37) 0.49 (0.44) 0.47 (0.27) 0.52 (0.39) 0.50 (0.36) Follow-up period (years), mean (SD) 2.7 (3.0) 3.4 (1.1) 4.3 (3.3) 3.0 (2.4) 3.4 (2.2) 3.1 (2.1) 3.2 (2.3) CIN1 N 20 8 32 23 67 120 270 Age at entry (years), mean (SD) 35.3 (9.2) 33.0 (10.6) 39.1 (8.7) 36.7 (8.3) 34.5 (7.1) 38.8 (10.1) 37.1 (9.2) Number of visits, mean (SD) 8.8 (5.4) 6.5 (2.8) 9.4 (5.0) 11.0 (5.5) 9.4 (4.4) 9.3 (5.4) 9.3 (5.1) Follow-up interval (years), mean (SD) 0.38 (0.19) 0.51 (0.56) 0.38 (0.21) 0.42 (0.28) 0.38 (0.18) 0.42 (0.30) 0.41 (0.27) Follow-up period (years), mean (SD) 3.5 (2.6) 3.0 (1.8) 3.6 (2.1) 4.2 (2.5) 3.6 (2.0) 3.9 (2.4) 3.7 (2.3) CIN2 N 64 12 52 37 51 58 274 Age at entry (years), mean (SD) 38.4 (7.8) 42.5 (5.7) 41.4 (8.0) 41.1 (8.1) 39.1 (7.8) 37.0 (9.3) 39.4 (8.3) Number of visits, mean (SD) 6.4 (5.9) 6.7 (5.2) 8.5 (6.3) 8.4 (5.6) 8.7 (5.7) 9.4 (5.7) 8.1 (5.9) Follow-up interval (years), mean (SD) 0.33 (0.19) 0.31 (0.11) 0.35 (0.19) 0.36 (0.22) 0.38 (0.41) 0.37 (0.35) 0.35 (0.28) Follow-up period (years), mean (SD) 1.9 (2.3) 1.9 (1.9) 2.9 (2.5) 3.1 (2.4) 3.2 (2.2) 3.5 (2.4) 2.8 (2.4) Note Other hrHPVs included HPV 31, 33, 35, 39, 45, 51, 56, 59, and 68. No hrHPVs were HPVs other than HPV 16, 18, 52, 58, or other hrHPVs. Abbreviations: hrHPV, high-risk human papillomavirus; SD, standard deviation.Table 2 shows the visit-wise transitions of observed lesions according to HPV genotype. For the CIN categorization, 5353 transitions were observed, of which 551, 165, 770, 569, 1130, and 2168 transitions were observed for HPVs 16, 18, 52, 58, other hrHPVs, and no hrHPVs, respectively. The HPV genotype pattern in transitions was similar for the two-tier classification. Most (78%–90%) patients in the normal state remained in that state over consecutive observations (e.g., 86.7% of HPV 16-positive patients in the normal state observed at a certain visit were also categorized as normal at the next visit). The progression from CIN2 to CIN3 was dependent on HPV genotype: 11.9%, 7.5%, 5.1%, 3.7%, 5.4%, and 2.0% of those with HPVs 16, 18, 52, 58, other hrHPVs, and no hrHPVs, progressed to CIN3, respectively.
TABLE 2. Transitions from each diagnosis of cervical epithelial lesions according to HPV genotype (CIN categorization) Diagnosis at (t − 1) visit HPV category Diagnosis at t visit Normal CIN1 CIN2 CIN3 Cancer Normal HPV 16 190 (86.7) 10 (4.5) 16 (7.3) 3 (1.3) 0 (0.0) HPV 18 60 (80.0) 11 (14.6) 4 (5.3) 0 (0.0) 0 (0.0) HPV 52 251 (77.7) 44 (13.6) 26 (8.0) 2 (0.6) 0 (0.0) HPV 58 196 (84.1) 21 (9.0) 14 (6.0) 2 (0.8) 0 (0.0) Other hrHPVs 573 (86.8) 71 (10.7) 14 (2.1) 2 (0.3) 0 (0.0) No hrHPVs 1348 (89.9) 119 (7.9) 28 (1.8) 3 (0.2) 1 (0.0) CIN1 HPV 16 24 (26.9) 30 (33.7) 33 (37.0) 2 (2.2) 0 (0.0) HPV 18 15 (40.5) 13 (35.1) 8 (21.6) 1 (2.7) 0 (0.0) HPV 52 65 (33.6) 80 (41.4) 46 (23.8) 2 (1.0) 0 (0.0) HPV 58 39 (26.5) 69 (46.9) 36 (24.4) 3 (2.0) 0 (0.0) Other hrHPVs 122 (45.3) 113 (42.0) 33 (12.2) 1 (0.3) 0 (0.0) No hrHPVs 225 (52.5) 162 (37.8) 38 (8.8) 3 (0.7) 0 (0.0) CIN2 HPV 16 26 (10.6) 34 (13.9) 153 (62.9) 29 (11.9) 1 (0.4) HPV 18 7 (13.2) 6 (11.3) 36 (67.9) 4 (7.5) 0 (0.0) HPV 52 36 (14.1) 44 (17.3) 161 (63.3) 13 (5.1) 0 (0.0) HPV 58 21 (11.1) 43 (22.7) 118 (62.4) 7 (3.7) 0 (0.0) Other hrHPVs 40 (19.9) 35 (17.4) 115 (57.2) 11 (5.4) 0 (0.0) No hrHPVs 57 (23.6) 42 (17.4) 137 (56.8) 5 (2.0) 0 (0.0) Note Values are the number (percentage) of observed transitions from a visit to the next visit. Other hrHPVs included HPV 31, 33, 35, 39, 45, 51, 56, 59, and 68. No hrHPVs were HPVs other than HPV 16, 18, 52, 58, or other hrHPVs. Abbreviations: hrHPV: high-risk human papillomavirus. 3.2 Primary analysisTable 3 represents our estimates for the misclassification matrix for the CIN categorization. Of patients with the normal state as their true state, 95.7% (95% confidence interval [CI], 94.2%–96.9%) were estimated to be diagnosed correctly. The model estimated that, of patients with the true state of CIN1, 61.9% (95% CI, 51.6%–71.2%) were diagnosed correctly, while 24.4% (95% CI, 17.3%–33.4%) and 13.5% (95% CI, 9.3%–19.2%) were misclassified as having normal and CIN2, respectively. For those with the true state of CIN2, 88.7% (95% CI, 80.4%–93.8%) were estimated to be diagnosed correctly as having CIN2, while 6.2% (95% CI, 3.8%–10.0%) and 4.9% (95% CI, 3.1%–7.7%) were estimated to be misclassified as having CIN1 and CIN3/cancer, respectively. For those with the true state of CIN3/cancer, 95.5% (95% CI, 24.6%–99.9%) were estimated to be diagnosed correctly. However, this wide 95% CI implied the instability of the estimation.
TABLE 3. Misclassification probabilities for the CIN categorization based on cytology and histology True underlying state Observed state Normal CIN1 CIN2 CIN3/cancer Normal 0.957 (0.942–0.969) 0.042 (0.030–0.057) 0.000 (0.000–0.000) 0.000 (0.000–0.000) CIN1 0.244 (0.173–0.334) 0.619 (0.516–0.712) 0.135 (0.093–0.192) 0.000 (0.000–0.000) CIN2 0.000 (0.000–0.000) 0.062 (0.038–0.100) 0.887 (0.804–0.938) 0.049 (0.031–0.077) CIN3/cancer 0.000 (0.000–0.000) 0.000 (0.000–0.000) 0.044 (0.000–0.753) 0.955 (0.246–0.999) Note Values are the estimated emission probabilities (95% confidence interval).Table 4 shows the predicted transition probabilities of true lesions after two years according to HPV genotype. For HPV 16, 2.3% (95% CI, 0.9%–5.5%), 17.7% (95% CI, 9.3%–29.3%), and 27.8% (95% CI, 16.6%–43.5%) of patients progressed to CIN3/cancer from the true state of normal, CIN1, and CIN2, respectively. On the contrary, 44.4% (95% CI, 32.5%–55.5%) and 29.9% (95% CI, 20.3%–39.9%) of HPV 16-positive patients regressed to a normal state from CIN1 and CIN2, respectively. For HPV 18-positive patients, the progression to CIN3/cancer was less likely than for HPV 16-positive patients; 0.7% (95% CI, 0.0%–14.4%) transitioned from a normal state, 2.6% (95% CI, 0.0%–35.2%) transitioned from CIN1, and 10.9% (95% CI, 0.0%–96.5%) transitioned from CIN2. For HPV 52/58-positive patients, the transitions were more likely to be stable over the 2 years than for HPV 16/18-positive patients; approximately 55%–70% of CIN1/2 patients remained as CIN1/2 after 2 years. Figure S3 illustrates the observed prevalence of the test-revealed lesions and the simulated prevalence of observed lesions by HPV genotype.
TABLE 4. Predicted two-year transition probabilities according to HPV genotype (CIN categorization) Current state HPV category State after two years Normal CIN1 CIN2 CIN3/cancer Normal HPV 16 0.832 (0.685–0.913) 0.064 (0.033–0.126) 0.079 (0.036–0.155) 0.023 (0.009–0.055) HPV 18 0.736 (0.493–0.897) 0.159 (0.054–0.310) 0.096 (0.006–0.214) 0.007 (0.000–0.144)
留言 (0)