
記住我
Currently, burns, sepsis, and cancer represent significant global public health challenges, all of which involve complex immune responses characterized by inflammation, cellular injury, and subsequent repair mechanisms. A comprehensive understanding of the unique pathophysiological processes underlying these conditions is crucial for advancing therapeutic strategies. Furthermore, identifying pathways that can alleviate disease progression, rather than allowing it to worsen, holds substantial therapeutic value. Elucidating the mechanisms behind these interconnected yet distinct health issues, by synthesizing global and regional data, enables a systematic analysis of key aspects such as disease epidemiology, risk factors, and disease burden. This knowledge provides critical evidence for the development of effective control strategies and facilitates the formulation of targeted and impactful interventions (1–3).
Sepsis is notably characterized by its rapid onset and high mortality rate, primarily attributed to the excessive release of cytokine that initiates a cascade of immune imbalances leading to immunosuppression and, ultimately, multiorgan failure (4, 5). A considerable body of research has focused on the pathophysiological mechanisms through which sepsis induces organ dysfunction. With the support of immunological approaches, basic research has increasingly concentrated on the role of macrophages in various organs during this process, while also showing significant interest in the regulatory mechanisms of macrophages in the context of infection. Although macrophages play a central role, other immune cells, such as neutrophils and T cells, are equally critical in the progression of both sepsis and cancer. A thorough understanding of the immune responses of various immune cell types is vital for developing comprehensive therapeutic strategies. Understanding the role of cytokines in immune responses provides valuable insights for the development of effective treatment strategies for a range of diseases. Through research into cytokine signaling and immune regulation mechanisms, scientists have identified numerous potential therapeutic targets (6). Burn injuries induce widespread inflammatory responses and immune dysregulation, often resulting in immunosuppression and increased susceptibility to sepsis. Severe burns can lead to systemic inflammatory response syndrome (SIRS), a pathway similar to sepsis, frequently culminating in organ failure and high mortality rates (7). Investigating the immune and inflammatory alterations triggered by burns is critical for devising preventive strategies against burn-induced sepsis (8, 9).In this context, a significant number of macrophages may become hyperactivated, releasing immune mediators in a rapid, burst-like manner. This amplified immune response can shift the individual’s focus from managing the initial inflammatory phase to addressing secondary infections, which are frequently observed following severe burns and critically influence the prognosis of burn-induced sepsis. When designing therapeutic interventions, it is essential to consider the dynamic temporal patterns of macrophage activation, particularly during the acute and chronic phases of sepsis and burns, as well as their interplay with metabolic shifts. These metabolic changes can further exacerbate immune dysfunction, influencing the effectiveness of immune responses and the overall recovery process.
Additionally, the immunosuppressive state induced by burn injuries can impair the body’s capacity to detect and combat emerging cancers, potentially heightening the risk for certain malignancies (10, 11). Cellular regeneration following burn injuries may foster conditions conducive to abnormal cell growth and cancerous lesions. Such an environment could contribute to carcinogenesis (12, 13). In the pursuit of understanding the underlying mechanisms, recent research advancements in the field of molecular biology have provided valuable insights. Transcriptomics has emerged as a crucial tool, as it plays a significant role in revealing the immune microenvironment and holds great importance for the diagnosis and prognosis of various diseases (14, 15). Through transcriptome analysis and single - cell techniques, researchers are now able to identify the functional characteristics and molecular markers of different cancer - associated fibroblast (CAF) sub - populations, thereby providing a solid theoretical foundation for the development of precise treatment strategies (16). Moreover, the immune escape mechanisms prevalent in the tumor microenvironment and their subsequent promotion of tumor progression have been identified as potential therapeutic targets for novel targeted treatment approaches (17). Single - cell transcriptomics analysis has demonstrated that diverse signaling pathways and immune regulatory factors play critical roles in antigen - specific cell functional exhaustion and immune escape, offering essential guidance for optimizing treatment regimens (18, 19). By leveraging single - cell RNA sequencing and bioinformatics analysis, researchers have been successful in identifying important molecules and pathways associated with the tumor microenvironment, thus charting new directions for precision medicine (20). Additionally, single - cell transcriptomics has been applied to analyze the repair process, shedding light on the underlying mechanisms (21). Concurrently, bioinformatics analysis and experimental validation of potential biomarkers have furnished crucial indicators for disease diagnosis and prognosis assessment (22–24). The advent of novel technologies and advanced molecular research methods has had a profound impact on disease research and treatment (25). In the realm of cancer treatment, for instance, antibody - drug conjugates and photodynamic therapy have witnessed continuous development. Through meticulous mechanism research, rigorous clinical validation, and the integration of bioinformatics analysis of clinical data, these advancements have propelled cancer treatment to new heights (26). Modern bioinformatics and big data technologies are increasingly indispensable in disease diagnosis, prognosis evaluation, and treatment. The application of these cutting - edge technologies and methodologies has not only spurred the growth of biomedical research but has also laid a robust foundation for the realization of precision medicine (27, 28). Gaining insight into how burns may facilitate cancer formation could inform the development of strategies to mitigate the risk of advanced-stage cancer (13, 29). However, the specific mechanisms by which burn-induced immune-metabolic changes impact cancer development across different cancer types should be further elucidated, as this connection is not yet fully understood.
Sepsis, with its extensive infectious inflammation, similarly poses a potential pathway for cancer development (30, 31). The prolonged inflammatory state associated with sepsis may lead to genomic instability and the accumulation of mutations, creating conditions that disrupt local cellular environments and potentially transform cells into malignant tumors (32, 33). Addressing chronic sepsis-related inflammation and bolstering immune function could play a pivotal role in modulating cancer risk and progression (31, 34). Furthermore, various macrophage cell death pathways, such as pyroptosis, autophagy, and ferroptosis, play a significant role in organ damage during sepsis. These mechanisms add complexity to the immune response in sepsis and may serve as potential therapeutic targets for modulating immune responses and preventing multiorgan failure. The heterogeneity of tumor microenvironments across different cancer types may limit the generalizability of findings related to the impact of sepsis-induced immune alterations on cancer development. Moderate exercise has long been recognized for its positive effects on immune function, strengthening the body’s defense mechanisms. Such exercise may enhance management strategies for conditions like burns, sepsis, and cancer (35, 36). Exercise supports recovery from burn injuries, reduces the risk of sepsis, and mitigates some irreversible side effects of cancer therapies, while also boosting the efficacy of treatments (37, 38). Thus, this emerging perspective could foster a more integrated approach to patient care, treating these conditions in concert rather than in isolation (39, 40). Research has found that nicorandil can relieve joint contracture and fibrosis by inhibiting the RhoA/ROCK and TGF - β1/Smad signaling pathways, providing potential drug targets for joint diseases (41).
The fields of cell therapy and biologic agent therapy are developing rapidly. Studies on engineered extracellular vesicles and exosomes derived from stem cells have delved deep into their mechanisms of action and actual treatment effects in tissue repair and regeneration (42). Moreover, exploring the relationship between exercise-induced metabolites and macrophage activity offers a promising area for research. Insights from this field could reveal novel methods for immune regulation and open pathways for resolving sepsis-associated inflammation. In summary, the combined effects of conditions such as burns and sepsis may increase the risk of cancer, a factor that warrants attention both medically and socially (31, 43). Moreover, by investigating the role of macrophages and their immune functions in sepsis, we aim to identify novel therapeutic targets to reduce multiorgan dysfunction and improve patient survival rates. Moving forward, it is essential to further explore the complex interconnections between burns, sepsis, and cancer, with the goal of optimizing treatment strategies based on these findings, ultimately offering better therapeutic prospects for patients.
Materials and methodsExercise-induced modulation of pan-cancer gene expression in the context of burns and sepsisWe applied the Wilcoxon rank sum test (also known as the Mann-Whitney U test), a nonparametric method, to assess gene expression differences between cancerous and normal tissue across multiple cancer types (44, 45). This test was chosen for its suitability with non-normally distributed data, unlike parametric alternatives that require normal distribution assumptions. Statistical significance was established at α = 0.05, indicating meaningful divergence between the median values of two independent sample groups. We analyzed de-identified gene expression data, represented as transcripts per million (TPM), from The Cancer Genome Atlas (TCGA) for tumor samples and late-stage normal tissue samples from the Genotype-Tissue Expression (GTEx) project. These datasets were accessed via the UCSC Xena database. To mitigate inter-dataset variability, the gene expression values were normalized using Z-scores, allowing for consistent dimensional comparisons. Our primary analysis centered on the glioblastoma multiforme (GBM) dataset, through which we investigated gene expression disparities between cancerous and non-cancerous tissues. This detailed comparison allowed us to observe exercise-induced changes in gene expression, providing insights into potential therapeutic implications for managing burns and sepsis within the cancer context.
Promoter methylation analysis of genes linked to exercise impacts on burns and sepsisThis study provides an overview of methylation levels across diverse genomic regions, including the TSS1500 region (200–1500 bp upstream of the transcription start site), the proximal promoter region (the first 200 bp upstream from the TSS), the first exon, and the 5’ untranslated region (UTR) (46, 47). For each sample, median methylation values within these regions were determined to represent the sample’s overall methylation status. To investigate the correlation between methylation levels and gene expression, we applied Spearman’s rank correlation, a non-parametric test ideal for assessing relationships between variables that may not exhibit linear patterns. In this analysis, methylation levels served as the independent variables, while gene expression levels were treated as dependent variables. The strength of these associations was quantified using the Spearman rank correlation coefficient. Additionally, we employed the Wilcoxon rank sum test to compare methylation levels between tumor and normal tissue samples. This non-parametric test is appropriate for comparing two independent sample groups without assuming a specific data distribution, thereby enabling a reliable distinction between tumor and normal tissue methylation patterns across different sample sources. Through this approach, we identified significant methylation differences, enhancing our understanding of tumor biology and the potential role of exercise in modulating responses to burns and sepsis.
ATAC-seq analysis of exercise-related gene modulation in burns and sepsisIn this study, we employed ChIPseeker, an R package tailored for analyzing and visualizing both ChIP-seq and ATAC-seq data (48, 49). Utilizing ChIPseeker’s annotatePeak function, we conducted an in-depth analysis of transcription start sites (TSS) within promoter regions of genes. We set the parameter tssRegion = c (-3000, 3000) to cover the 3000 base pairs upstream and downstream of the TSS, enabling a comprehensive examination of genomic elements, including transcription factor binding sites and histone modifications. To visualize coverage, we utilized ChIPseeker’s covplot function, generating plots that illustrate the distribution of peaks across the genome in human ATAC-seq data. These coverage plots reveal not only the spatial distribution of peaks along chromosomes but also offer detailed insights, including gene names, tumor types, chromosomal positions, and genetic distances, conveniently displayed on the left side of the graph. This visual approach provides researchers with a holistic and precise representation of the ATAC-seq data, enhancing our understanding of exercise-induced gene regulation in the context of burns and sepsis.
Prognostic assessment of exercise-related genes in burns and sepsis across pan-cancerTo evaluate the prognostic significance of various genes, we applied a univariate Cox regression model using the survival package in R (50, 51). For each gene, we derived hazard ratios along with their 95% confidence intervals by fitting the data into a Cox proportional hazards model through the coxph() function. The results were visualized in a heatmap to facilitate comparative analysis and enhance interpretability.
Genomic profiling of exercise-related genes in burns, sepsis, and pan-cancer contextsTo investigate the impact of exercise on genes associated with burns and sepsis across various cancer types, we analyzed copy number alterations and DNA methylation data from The Cancer Genome Atlas (TCGA) (52, 53). Patient samples were organized in a structured matrix format, with rows representing samples and columns representing genes or genomic regions. After quality control steps to exclude low-quality samples and probes, data were standardized to minimize technical variation. Using tools like GISTIC and CNAnorm, we identified and categorized genomic amplification and deletion events, quantifying their frequencies across the genome. DNA methylation levels at gene promoter regions were assessed on the UALCAN platform, comparing differences between normal and cancerous tissues to elucidate the influence of exercise on wound healing and infection responses. For methylation pattern analysis in specific cancer-associated genes, we utilized the ‘gene visualization’ module available in MethSurv. To further understand genomic impacts, Mutation Annotation Files (MAF) from TCGAbiolinks and tumor mutation burden (TMB) calculations via maftools allowed us to explore links between these genomic features and immunotherapy responsiveness. Statistical analyses, including correlation and survival analyses, were conducted on copy number alteration, DNA methylation, and TMB data to assess their associations with exercise-modulated gene expression in wound healing and infection. These analyses aimed to evaluate the potential impact of these genomic variations on tumor progression and patient outcomes.
Gene set enrichment analysis across pan-cancer typesThis study utilized data from The Cancer Genome Atlas (TCGA) repository, incorporating tumor and normal tissue samples from a specific cancer type (54, 55). The data underwent stringent quality control processes, during which invalid samples and probes were excluded to ensure robustness. Following quality filtering, normalization was applied to mitigate technical variability inherent in the dataset, including adjustments for background noise, often present in raw files. We employed the “limma” package within the R environment, which facilitates background correction, normalization, and statistical analyses for identifying genes with significant differential expression. The criteria for selection involved both log2 fold change (log2FC) and p-values. Log2FC quantified the relative changes in gene expression, while the p-value assessed statistical significance. For gene set enrichment analysis (GSEA), we used the “clusterProfiler” package in R to annotate and visualize enriched pathways associated with differentially expressed genes in public databases such as KEGG, GO, and Reactome. We relied on the Enrichment Score (ES), which ranges from 0 to 1, as a metric to determine the relevance of pathway alterations in relation to gene expression changes. Finally, to visualize the findings, we utilized R packages, including “ggplot2,” to create various graphical representations. This included simple bar charts, scatter plots, and heatmaps, allowing a clear interpretation of the results. This methodological framework provides a structured approach to interpreting the molecular implications of gene expression variations in cancer.
Cell cultureHuman umbilical vein endothelial cells (HUVECs) were seeded in culture flasks and maintained in Dulbecco’s modified Eagle medium (DMEM, low glucose), supplemented with 10% fetal bovine serum (FBS), 1% endothelial cell growth supplement, and 1% penicillin-streptomycin solution. The cells were incubated at 37°C in a humidified chamber with 5% CO₂ under normoxic conditions. To establish an in vitro model, HUVECs were subsequently exposed to 1 μg/mL of lipopolysaccharide (LPS). Eight hours before the experiments, cells were cultured in serum-free DMEM. For differentiation, THP-1 cells were treated with 100 ng/mL phorbol 12-myristate 13-acetate (PMA) for five days to induce macrophage-like characteristics. RAW 264.7 mouse macrophages (ATCC, Rockville, MD, USA) were cultured in DMEM containing 10% heat-inactivated FBS, 100 U/mL penicillin, and 100 μg/mL streptomycin, and incubated at 37°C in a 5% CO₂ atmosphere.
Cell viability assayHUVECs, seeded at a density of 5 × 10³ cells per well, were transfected with MLIP knockdown, overexpression, or control plasmids and plated in 96-well plates to assess proliferation. After an initial 16-hour incubation, the cells were either stimulated with LPS or left untreated for 0, 6, and 24-hour intervals. Cell proliferation was measured using the Cell Counting Kit-8 (CCK-8; Beyotime, Beijing, China, Cat#C0038), in accordance with the manufacturer’s protocol. Absorbance was recorded at 450 nm using a BioTek microplate reader (BioTek, U.S.A.).
Real-time reverse transcription polymerase chain reactionTotal RNA was isolated from the three experimental groups using Trizol reagent (Invitrogen, USA). The isolated RNA was reverse-transcribed into complementary DNA (cDNA) using the PrimeScript II 1st Strand cDNA Synthesis Kit (Takara, Shiga, Japan). Real-time RT-PCR was performed with the SYBR Premix Ex Taq II (Takara, Shiga, Japan) on a StepOnePlus Real-Time PCR system (Applied Biosystems, CA, USA). The relative mRNA expression levels were quantified using the 2^−ΔΔCt method, with GAPDH as the internal control.
Measurement of oxidative stress and LDH release assayCytotoxicity was assessed by quantifying lactate dehydrogenase (LDH) release using a commercial assay kit, following the manufacturer’s instructions. Briefly, 50 μL of supernatant from each well was collected and incubated with reduced nicotinamide adenine dinucleotide (NADH) and pyruvate for 15 minutes at 37°C. The reaction was terminated with the addition of 0.4 mol/L NaOH. LDH activity was measured by recording the absorbance at 440 nm on a SpectraMax M2 spectrophotometer (Molecular Devices, Sunnyvale, CA, USA) and expressed as U/g protein. Additionally, oxidative stress markers, including superoxide dismutase (SOD) and glutathione peroxidase (GSH-Px) activities, along with reactive oxygen species (ROS) and malondialdehyde (MDA) levels, were measured using commercially available kits, following the manufacturer’s protocols.
Flow cytometry analysisApoptosis and cell polarization were evaluated in both treated and untreated cells using flow cytometry. Following treatment, cells were harvested and stained with FITC-Annexin V and propidium iodide (PI) for 10 minutes at room temperature, following the protocol provided by the Annexin V-EGFP Apoptosis Detection Kit (KeyGEN BioTECH). For polarization assessment, cells were additionally stained with antibodies targeting M1 polarization markers when required. Data acquisition and analysis were conducted on a Fluorescence-Activated Cell Sorting (FACS) Calibur flow cytometer (Becton-Dickinson, Sparks, MD, USA) with associated software. For the colony formation assay, cells were plated in 6-well plates and treated with designated drugs for 6 hours according to the experimental groups for reactive oxygen species (ROS) detection. A fluorescent probe, DCFH-DA (10 µM; Solarbio, China), was diluted in a serum-free medium, and cells were incubated with it for 30 minutes at 37°C. FITC signals were subsequently detected via flow cytometry.
Immunofluorescence analysisCells were plated in 6-well culture plates and incubated overnight to ensure adherence. The cells were then fixed with 3.7% paraformaldehyde at room temperature for 15 minutes and subsequently permeabilized in cold methanol at -20°C for 15 minutes. Blocking was performed using a buffer containing 5% normal goat serum and 0.5% Triton X-100 in PBS for 1 hour at room temperature. Primary antibodies were added, and cells were incubated overnight at 4°C. After washing three times with PBS for 10 minutes each, cells were incubated at room temperature with Alexa Fluor 488-conjugated goat anti-rabbit secondary antibody (Cat# A-11034) and Alexa Fluor 594-conjugated goat anti-mouse secondary antibody (Cat# A-11004; Thermo Fisher), both diluted 1:500 in blocking buffer. Prior to imaging, nuclei were stained with DAPI (Cat# D9542; Sigma) for 30 minutes at room temperature. Images were obtained using a Nikon Eclipse E800 fluorescence microscope.
Statistical analysisData are presented as mean ± standard deviation (SD). Statistical analyses were conducted using GraphPad Prism 8 software. Group differences were assessed using either Student’s t-test or analysis of variance (ANOVA), depending on the experimental design. A p-value of less than 0.05 (P < 0.05) was considered statistically significant.
ResultsGene expression and pathway enrichment analysisIn our study, we investigated gene expression differences and pathway enrichment between two sample groups using a variety of analytical approaches. The UMAP plot (Figure 1A) revealed distinct clustering between the groups, indicating significant differences in gene expression profiles. This clustering suggests that the gene expression profiles of the groups are sufficiently divergent to merit further investigation into the underlying molecular mechanisms. The volcano plot (Figure 1B) highlighted differentially expressed genes. This visualization not only underscores the extent of differential expression but also aids in the identification of key genes that may be crucial in the context of burn-induced sepsis and its potential association with cancer. GSEA identified significantly enriched pathways (Figure 1C), including those related to immune response activation, metabolic pathways, and tumor suppressor inhibition. The top four enriched pathways (Figure 1D) were further explored, with the enrichment scores and the specific positions of genes within these pathways clearly displayed. A heatmap (Figure 1E) illustrates the Z-scores of gene expression for genes within these pathways, providing a clear visualization of expression patterns across all samples. This comprehensive analysis highlights significant differences in gene expression and pathway enrichment between the two groups, emphasizing key pathways involved in disease mechanisms and pinpointing potential therapeutic targets. These findings lay the groundwork for identifying therapeutic targets and biomarker candidates, which could play a crucial role in the development of more effective treatment strategies for burn-induced sepsis and its potential link to cancer.
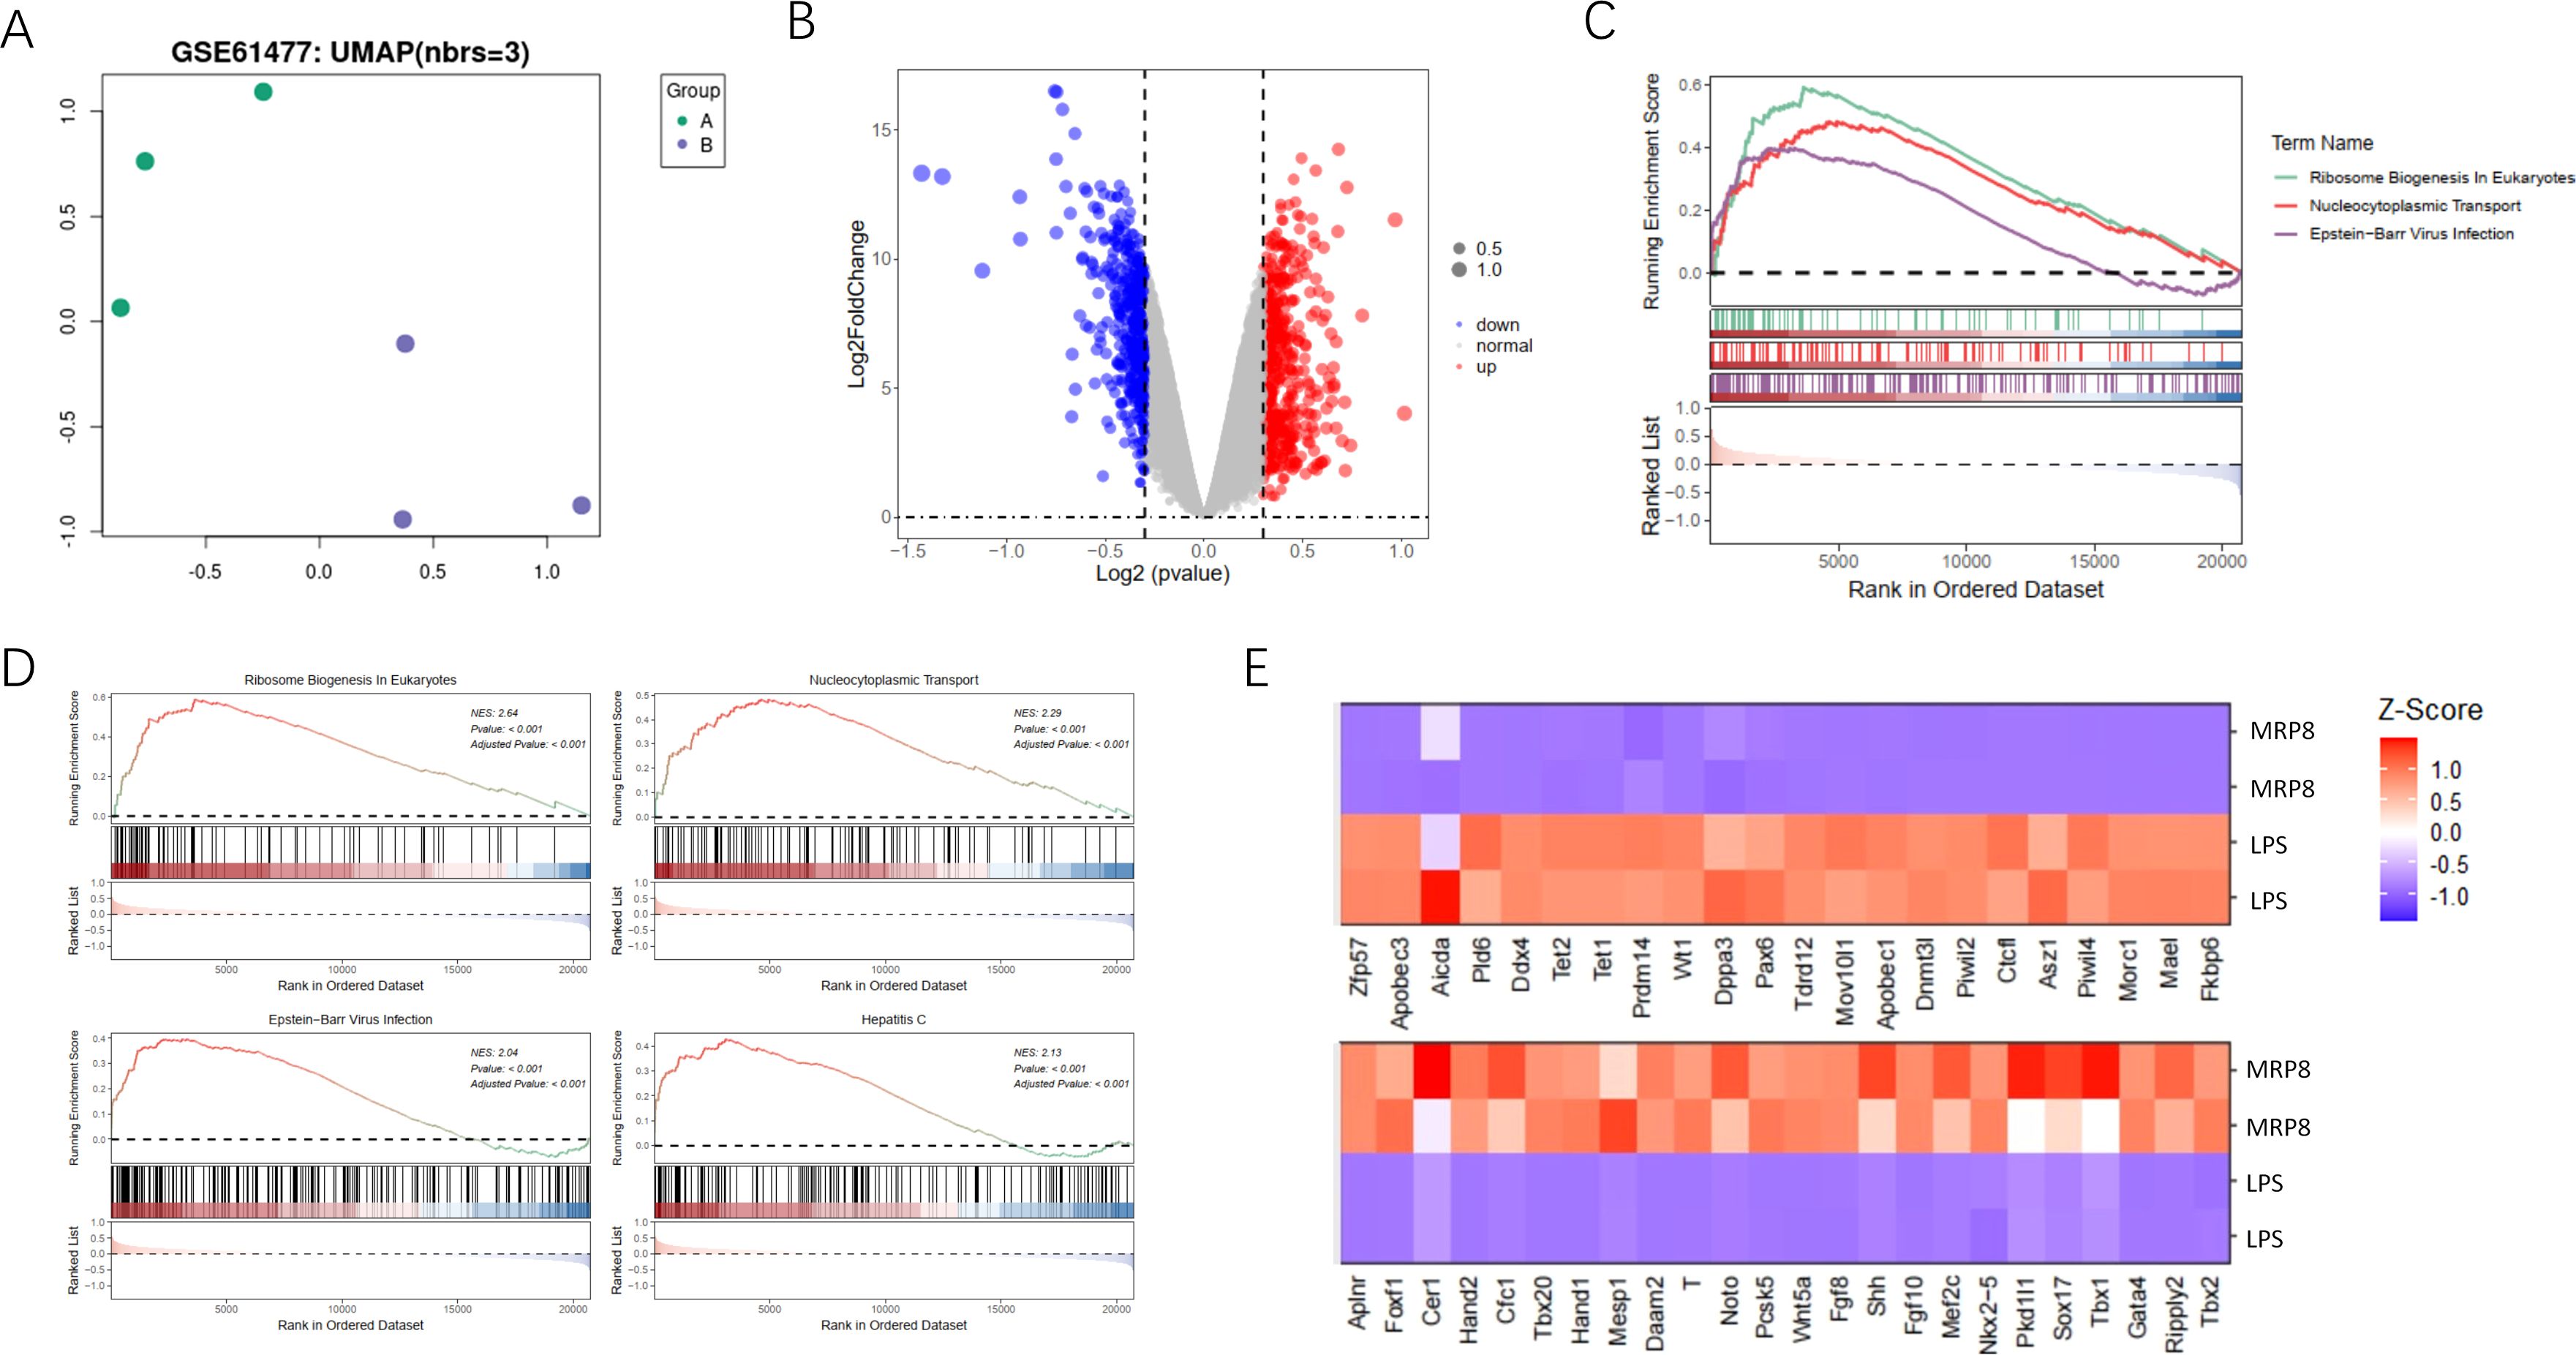
Figure 1. Analysis of gene expression and pathway enrichment between two sample groups. (A) The UMAP plot shows the two-dimensional distribution of the two sample groups visualized using Uniform Manifold Approximation and Projection (UMAP). Each point represents an individual sample, color-coded by group, and illustrates clustering patterns based on gene expression profiles. (B) The volcano plot presents differential gene expression analysis between the two groups. The x-axis displays the log2 fold change in gene expression between groups, and the y-axis shows the -log10 adjusted p-value to indicate statistical significance. Red points highlight significantly upregulated genes, blue points represent significantly downregulated genes, and grey points indicate genes without significant changes. (C) The GSEA plot illustrates gene set enrichment analysis, highlighting pathways with significant enrichment. The enrichment score is plotted across the rank-ordered gene list for three specific pathways: Immune Response in Activation, Metabolic Pathways, and Tumor Suppressor Inhibition, each represented by different colors and line types. (D) The GSEA top pathways display the four most significantly enriched pathways individually through GSEA. Each panel includes an enrichment score curve, indicating the positions of genes within the pathway on the ranked gene list, revealing the distribution and relevance of genes contributing to pathway enrichment. (E) The heatmap visualizes the expression levels of genes identified in the enriched pathways. Each row represents a specific gene, and each column corresponds to a sample. Gene expression levels are normalized to z-scores, with red indicating high expression and blue indicating low expression, allowing a visual comparison of expression patterns across samples in each group.
Differential gene expression and pathway enrichment analysisOur study aimed to identify differentially expressed genes (DEGs) and significantly enriched pathways between tumor and normal tissue samples. To achieve this, we utilized a combination of statistical and computational tools, with the results presented in various figures to provide clarity and a comprehensive understanding of the findings. Figure 2A presents a volcano plot that illustrates the distribution of DEGs between tumor and normal groups. The dashed lines represent thresholds for statistical significance, enabling the clear identification of the most relevant genes affected by the conditions under investigation. GSEA was conducted to identify significantly enriched pathways, with Figure 2B depicting the statistical significance of these pathways. This figure reveals the biological processes most influenced by the differential gene expression patterns observed between tumor and normal tissues. The pathways selected based on their statistical significance offer valuable insights into the biological processes that are most affected by the differentially expressed genes. Further GSEA results highlighted the top four enriched pathways, as shown in Figure 2C. Additionally, the gene distribution within these pathways is shown, offering a clearer understanding of how specific genes contribute to pathway enrichment and their potential role in tumor development. Figure 2D displays a heatmap that visualizes gene expression levels across all samples, specifically focusing on genes related to the identified pathways. Each row in the heatmap corresponds to a unique gene, while each column represents an individual sample. Collectively, these analyses provide a detailed view of the molecular alterations occurring in tumor and normal tissues. The identification of significantly enriched pathways and differentially expressed genes contributes to a deeper understanding of the biological functions and pathways involved in tumorigenesis.
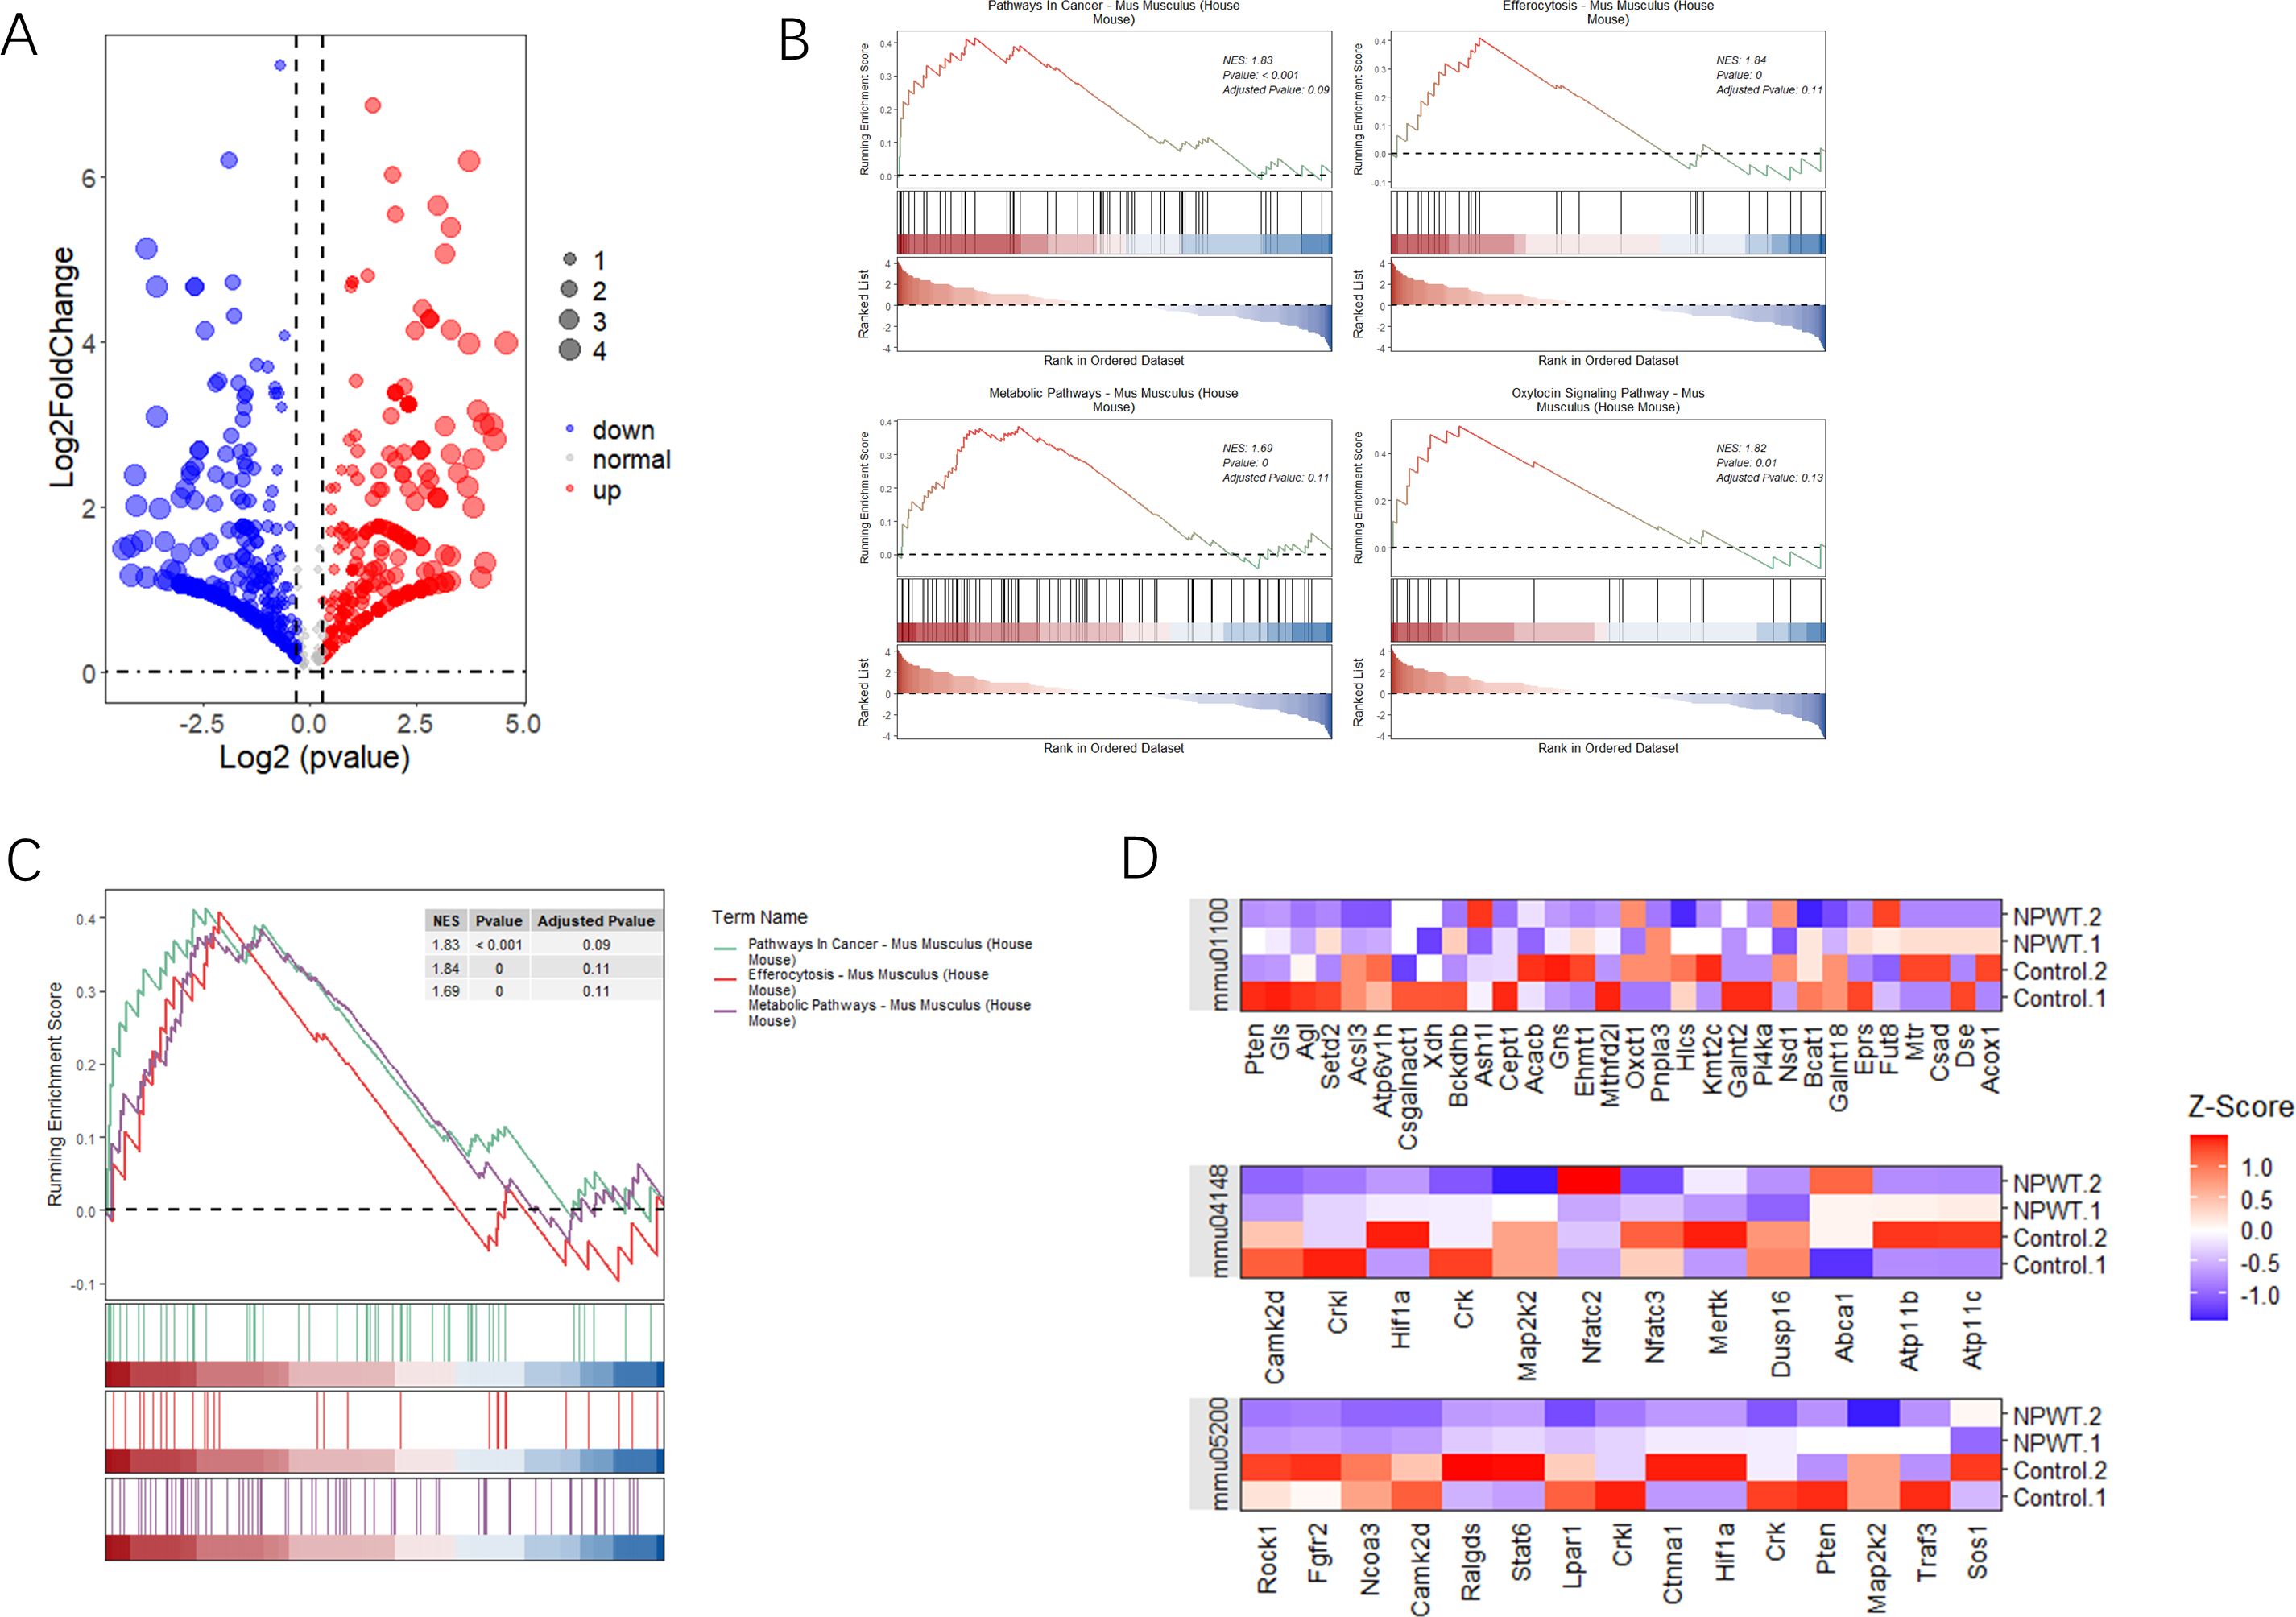
Figure 2. Analysis of differential gene expression and pathway enrichment. (A) The volcano plot illustrates the differential expression of genes between two groups. The x-axis represents log2 fold change, while the y-axis shows -log10(p-value). Red highlights genes with significant upregulation, blue indicates downregulated genes, and dashed lines mark the thresholds for statistical significance. (B) Gene Set Enrichment Analysis (GSEA) plots illustrate the enrichment of three pathways with significant results. The y-axis displays the enrichment score (ES), and the x-axis shows the rank of genes within the ordered dataset. Key pathways enriched in this analysis are emphasized based on their statistical significance. (C) Additional GSEA plots present the top four pathways with notable enrichment scores, further emphasizing the relevance of pathways that show substantial statistical enrichment. (D) A heatmap shows the expression levels of genes across significant pathways, normalized by Z-score across all samples. Each row represents a gene, and each column represents a sample, with color gradation indicating expression levels—red for high expression and blue for low. This comparison includes gene expression data from both tumor and normal tissue samples, allowing a comparative analysis of gene expression under different conditions.
Expression landscape of exercise-influenced genes in pan-cancer analysisIn this study, we analyzed the expression landscape of exercise-influenced genes associated with burns and sepsis. The datasets used included GSE193428, GSE61477, and a dataset of exercise-related genes, collectively providing a comprehensive profile of gene expression. By integrating data from these diverse sources, we aimed to investigate the shared and unique gene expression patterns influenced by exercise in the context of burns, sepsis, and cancer. As shown in Figure 3A, a Venn diagram illustrates the overlap and unique characteristics of DEGs across the datasets. Specifically, 626 genes were unique to GSE193428, 911 were specific to GSE61477, and 194 were exclusive to the exercise-related genes. Additionally, 53 genes overlapped between GSE193428 and GSE61477, while 10 genes were common between GSE61477 and the exercise-related gene dataset. Key genes identified among these, such as FARSA, SVIL, LAMP2, and COL12A1, were found to be influenced by exercise in both burns and sepsis, suggesting their potential roles in exercise-mediated recovery processes. These genes are involved in critical biological functions such as protein synthesis, cell signaling, and tissue repair, all of which are vital for enhancing the body’s response to burns, sepsis, and potentially cancer development. Figures 3B, C present the differential expression analysis of these genes across various cancer types. Figure 3B illustrates the expression levels using non-paired samples, capturing the variability in gene expression due to exercise, burns, and sepsis. In contrast, Figure 3C employs paired samples to compare tumor and adjacent normal tissues, providing a more refined analysis that controls for individual variability and highlights consistent exercise-influenced expression patterns. Expanding on these analyses, Figure 3D integrates data from both the TCGA and GTEx projects, enabling a comprehensive comparison of gene expression profiles in malignant and healthy tissues. This figure offers further insights into how physical activity may modulate expression changes associated with burns and sepsis. At the top of Figure 3D, the sample sizes for each cancer type are displayed. Below, a heatmap uses color coding to represent upregulated and downregulated genes, highlighting the expression patterns across cancer types. These findings underscore the significant influence of exercise on transcriptional patterns associated with burns and sepsis in the context of cancer. The consistent expression changes observed in exercise-influenced genes across various datasets suggest that exercise may be a critical modulator of recovery from both sepsis and burns, with potential implications for cancer prevention and survival.
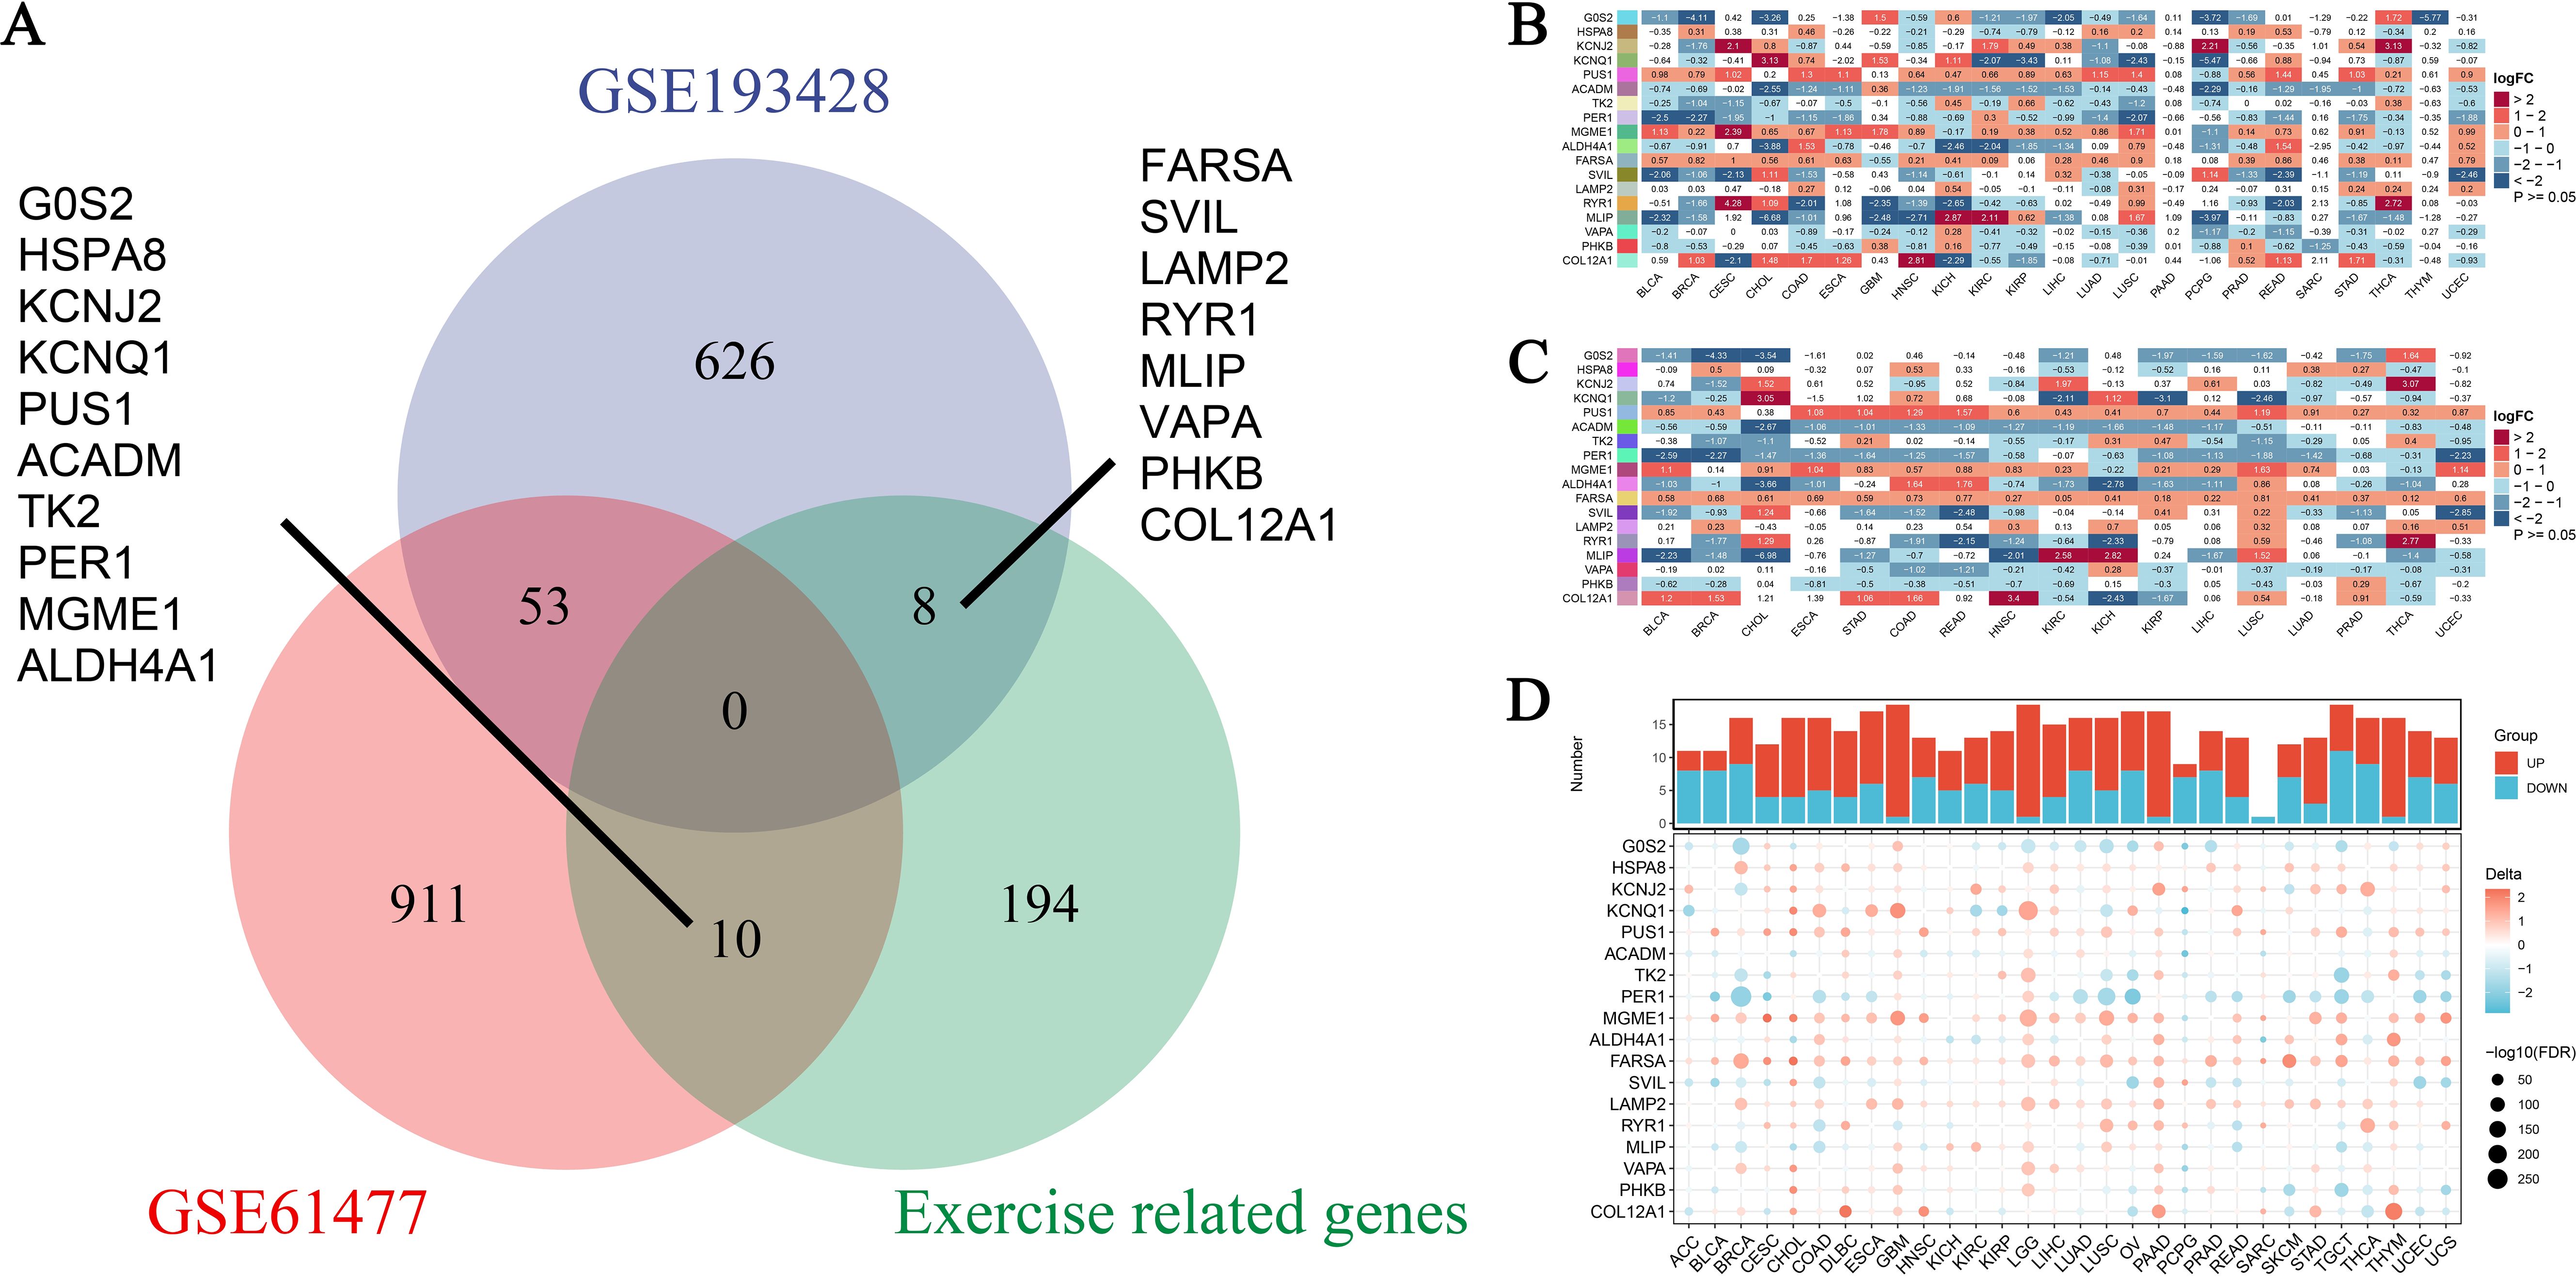
Figure 3. Expression profiles of exercise-modulated genes related to burns and sepsis in pan-cancer analysis. (A) The Venn diagram illustrates the overlap of differentially expressed genes (DEGs) identified from two datasets, GSE193428 and GSE61477, including a subset of genes associated with exercise. This visualization distinguishes DEGs unique to each dataset from those shared between them, underscoring genes commonly modulated by exercise, burns, and sepsis. Specific genes unique to each condition are labeled outside the Venn circles. (B) Differential expression analysis was conducted on exercise-modulated genes linked to burns and sepsis using non-paired samples across multiple cancer types. The resulting heatmap depicts the expression levels of these genes, with color intensity reflecting the extent of expression change. The data, drawn from various cancer types, showcases gene expression variations influenced by exercise, burns, and sepsis. (C) A subsequent differential expression analysis was performed on the same gene set, using paired samples from individual patients. This heatmap presents refined insights into gene expression changes by comparing tumor tissue directly with adjacent normal tissue from the same patient. Analyzing paired samples helps control for individual variability, revealing more consistent gene expression patterns related to exercise influences. (D) Additional differential expression analysis incorporates data from the TCGA-GTEx projects, providing a comprehensive comparison of gene expression across cancerous and normal tissues. This analysis examines exercise’s influence on genes associated with burns and sepsis. At the top, a bar chart details the number of samples analyzed, while the heatmap below indicates shifts in gene expression, with color coding denoting increased or decreased levels.
Analysis of promoter methylation of burn and sepsis-related genes influenced by exerciseFigure 4 provides an in-depth analysis of promoter methylation levels and their impact on mRNA expression in burn- and sepsis-related genes affected by physical activity. Figure 4A presents a heatmap that displays variations in promoter methylation levels for genes such as ACADM, ALDH4A1, COL12A1, FARS2, G6PC, HSP90A, KCNJ2, KCNQ1, PER1, PHKB, PUS1, RYR1, SVIL, TK2, and VAPA. In this heatmap, red represents hypermethylation, blue indicates hypomethylation, and white denotes no significant change. The analysis compares methylation patterns across patient samples, distinguishing those who underwent exercise intervention from those who did not, revealing notable differences that suggest the influence of exercise on the epigenetic regulation of these genes. Figure 4B illustrates the relationship between promoter methylation levels and corresponding mRNA expression levels, employing the same color scheme: red for a negative correlation, blue for a positive correlation, and white for no significant correlation. This heatmap demonstrates how changes in promoter methylation can impact gene expression, with hypermethylation generally associated with reduced mRNA expression and hypomethylation linked to increased expression levels. The analysis was conducted with rigorous statistical evaluations, examining parameters such as distribution, mean, median, standard deviation, and variance to ensure objectivity and precision in data interpretation. These findings highlight the potential regulatory role of exercise in gene expression related to burn and sepsis recovery, emphasizing the significance of considering epigenetic modifications in therapeutic strategies and suggesting the potential benefits of exercise interventions in clinical settings. Future research should aim to further elucidate the mechanisms behind these epigenetic modifications and their implications for recovery in burn and sepsis. Investigating how specific exercise interventions might influence gene methylation pathways and understanding their functional consequences on gene expression will provide deeper insights into the potential therapeutic benefits of exercise. This analysis provides valuable insights into the influence of exercise on promoter methylation and gene expression, making a substantial contribution to the growing field of exercise genomics and its role in medical treatments.
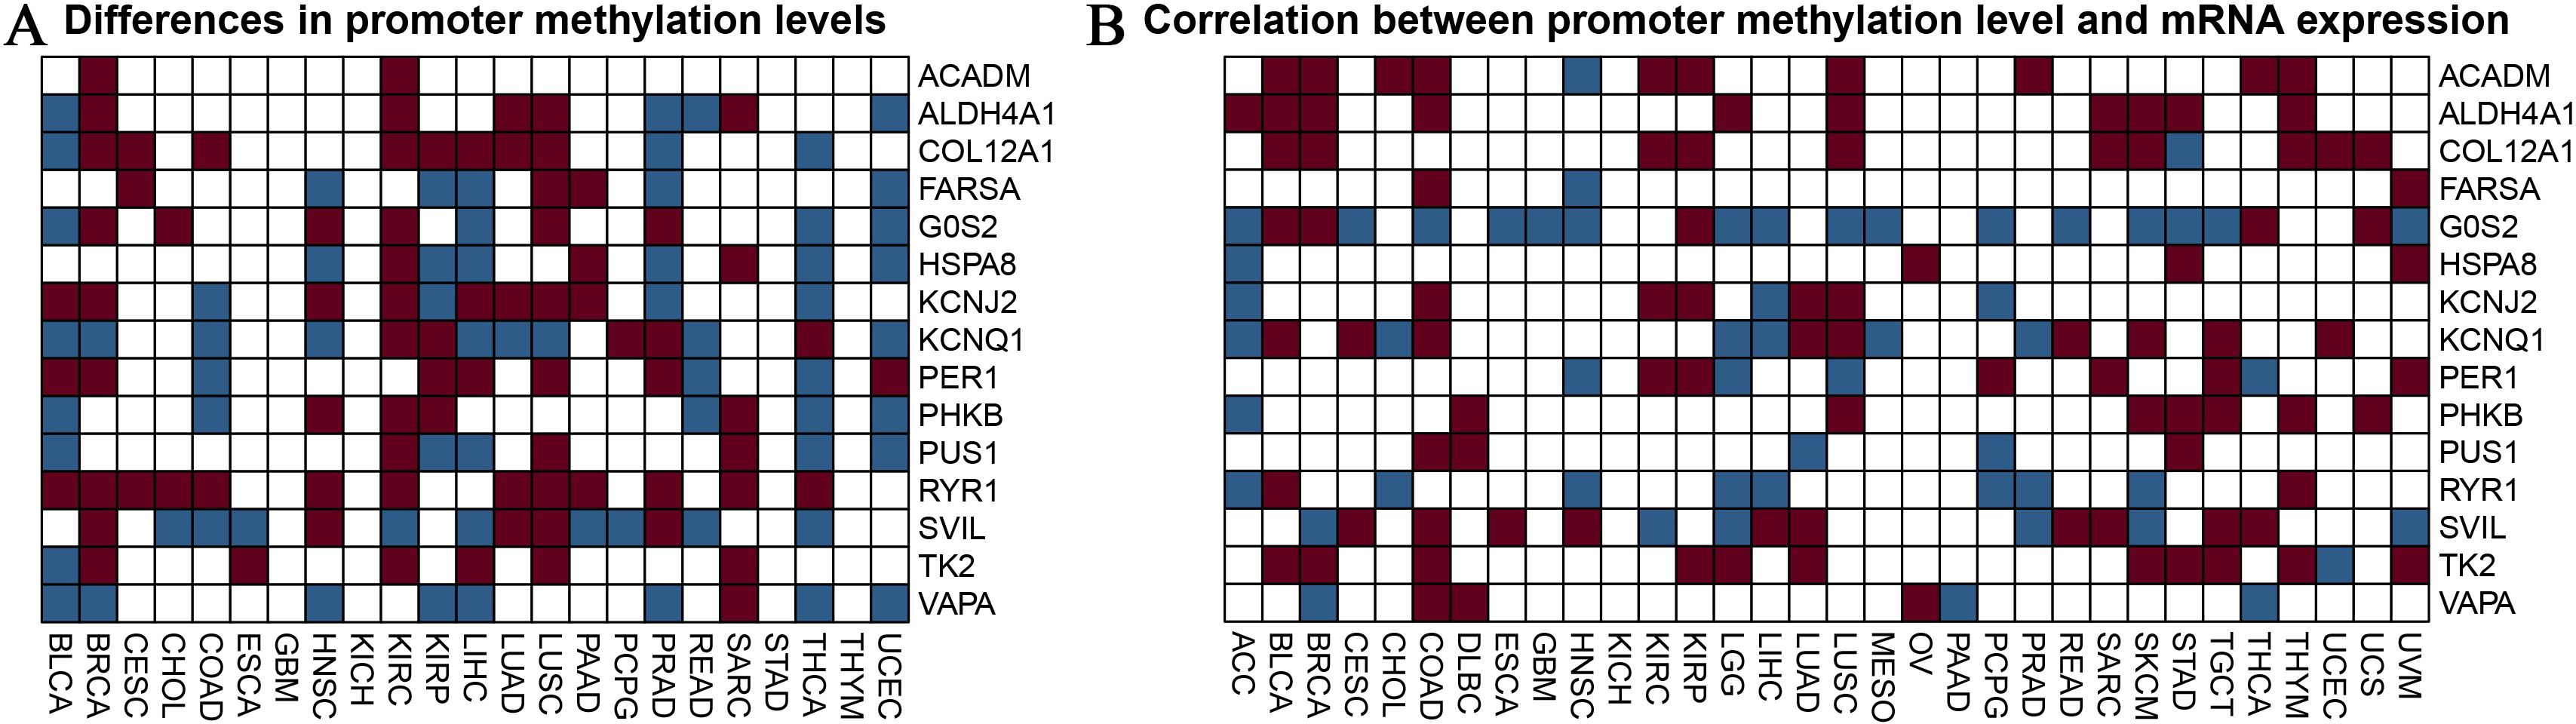
Figure 4. Analysis of promoter methylation in exercise-modulated genes related to nurns and sepsis. (A) The heatmap visualizes differences in promoter methylation for specific genes associated with burns and sepsis, including ACADM, ALDH4A1, COL12A1, FARS2, G6PC, HSP90A, KCNJ2, KCNQ1, PER1, PHKB, PUS1, RYR1, SVIL, TK2, and VAPA. The colors in the heatmap represent methylation levels, with red indicating hypermethylation, blue indicating hypomethylation, and white showing no significant change. This analysis compares samples from patients receiving exercise treatment with those who did not. (B) The heatmap examines the correlation between promoter methylation and mRNA expression levels for the same set of genes. It visually represents the relationship between changes in methylation and mRNA expression, using the same color scheme as in panel (A). Red indicates a negative correlation, blue indicates a positive correlation, and white shows no significant correlation. This analysis seeks to understand how variations in promoter methylation impact gene expression.
Promoter methylation analysis of burn and sepsis-related genes affected by exercisePromoter methylation analysis revealed varying methylation patterns across burn and sepsis-related genes influenced by exercise. ACADM showed mainly unmethylated or low methylation, with variable CpG site methylation (Supplementary Figure 1A). ALDH4A1 had predominantly unmethylated sites (Supplementary Figure 1B), while COL12A1 exhibited low to medium methylation hotspots (Supplementary Figure 1C). FARSA had a balanced methylation pattern with some sites highly methylated (Supplementary Figure 1D). G0S2 showed low methylation levels with specific CpG site variation (Supplementary Figure 1E). HSPA8 and LAMP2 were primarily lowly methylated (Supplementary Figures 1F, I). KCNJ2 and KCNQ1 exhibited medium to high methylation (Supplementary Figures 1G, H). MGME1 and SVIL had balanced methylation with significant site-specific methylation (Supplementary Figures 1J, P). MLIP showed varied methylation, notably high levels (Supplementary Figure 1K), while PER1 and PHKB had low to medium methylation (Supplementary Figures 1L, M). PUS1 had medium to high methylation (Supplementary Figure 1N), and RYR1 was largely unmethylated (Supplementary Figure 1O). TK2 mainly exhibited low methylation (Supplementary Figure 1Q), and VAPA was mostly unmethylated or lowly methylated (Supplementary Figure 1R). These results highlight exercise’s potential role in regulating the epigenetic modification of these genes, providing insight into the underlying molecular mechanisms and potential therapeutic applications.
Correlation of burn and sepsis-related gene expression with tumor prognosisOur study examined the correlation between the expression of burn- and sepsis-related genes and tumor prognosis, specifically focusing on Disease-Free Interval (DFI), Disease-Specific Survival (DSS), Overall Survival (OS), and Progression-Free Interval (PFI) (Figure 5). In the Disease-Free Interval (DFI) panel (Figure 5A), a heatmap displays the relationship between gene expression and DFI in tumor patients. Here, red squares denote genes associated with increased risk, while blue squares indicate protective genes, with significant correlations marked (p < 0.05). Similarly, the Disease-Specific Survival (DSS) panel (Figure 5B) presents a heatmap that illustrates the correlation between gene expression and DSS, maintaining the same color scheme and significance threshold. The Overall Survival (OS) panel (Figure 5C) shows correlations between gene expression and OS, with red indicating risky genes and blue representing protective genes. Only statistically significant correlations (p < 0.05) are displayed to emphasize meaningful relationships. Lastly, the Progression-Free Interval (PFI) panel (Figure 5D) provides a heatmap showing the correlation between gene expression and PFI, using consistent color coding and significance criteria. These findings highlight the significant influence of specific gene expressions on various tumor prognosis metrics, offering valuable insights that could guide the development of potential therapeutic targets. The study emphasizes the importance of considering the molecular landscape shaped by burn and sepsis-related genes, which may provide novel opportunities for personalized treatments in cancer patients, particularly those recovering from burns or sepsis.

Figure 5. Association of burn and sepsis-related gene expression with tumor prognosis indicators (DFI, DSS, OS, PFI). (A) The heatmap shows the correlation between the expression of burn and sepsis-associated genes and the disease-free interval in cancer patients. Red squares represent genes correlated with an increased risk (risky), while blue squares indicate genes with a protective effect. Only significant correlations (p<0.05) are shown. (B) The heatmap illustrates the relationship between gene expression and disease-specific survival in cancer patients, following the same color coding as in panel (A). Red squares denote risky genes, and blue squares indicate protective genes, with only significant associations (p<0.05) included. (C) This panel provides a heatmap that demonstrates the correlation between gene expression and overall survival in cancer patients. Genes associated with a higher risk are shown in red, while those with protective associations are in blue. Only significant correlations (p<0.05) are highlighted. (D) The heatmap examines the correlation between gene expression and progression-free interval in cancer patients. As in the previous panels, red indicates risky genes, and blue represents protective genes. Only statistically significant correlations (p<0.05) are displayed.
Comprehensive analysis of exercise-influenced burn and sepsis-related genes across pan-cancerThis study explores the impact of exercise on genes associated with burns and sepsis across various cancer types, revealing several key findings. Supplementary Figure 2A shows mutation frequencies of these genes in 20 cancer types, with color intensity representing mutation rates. A waterfall plot (Supplementary Figure 2B) highlights mutation variability across categories. Figures 2C, D illustrate the correlation between gene expression and Tumor Mutation Burden (TMB), with bubble sizes indicating correlation significance and colors reflecting the strength and direction. Figures 2E, F categorize samples by copy number amplifications, identifying the most common cancer types. Figure 2G presents cumulative copy number alterations, while Figure 2H compares amplifications and deletions across cancer types. Finally, Figure 2I displays a correlation matrix of gene expression in different cancers, with bubble sizes representing p-values. These findings highlight the heterogeneous genomic effects of exercise on burn- and sepsis-related genes in cancers, offering insights into potential therapeutic targets and informing personalized cancer treatment strategies.
Exercise-influenced gene expression in cancer and microbiomesOur analysis of gene expression following exercise across multiple cancer types revealed notable enrichments in genomic features and microbiome signatures. In Figure 6A, we observed distinctive gene expression patterns associated with burns and sepsis that correlate with CNVs. In this figure, circle sizes denote significance levels, while color gradients indicate delta values, highlighting differential expression. Similarly, Figure 6B shows the relationship between gene expression and promoter methylation, with blue representing negative correlations and red indicating positive correlations. Figures 6C, D explore the expression of these genes within different microbiomes. A heatmap in Figure 6C presents normalized expression levels, while hierarchical clustering in Figure 6D reveals co-regulated gene clusters influenced by microbial presence. Figure 6E provides a GSEA across various cancers, identifying enriched pathways. Bubble sizes correspond to the number of genes involved, and colors reflect enrichment scores, with red indicating higher scores. These findings suggest that exercise modulates gene expression in ways that affect cancer biology and microbial interactions, offering potential insights for therapeutic development. The interaction between exercise, gene expression, and microbiome modulation highlights new avenues for improving cancer treatment strategies through holistic approaches that consider genetic, epigenetic, and microbial factors.
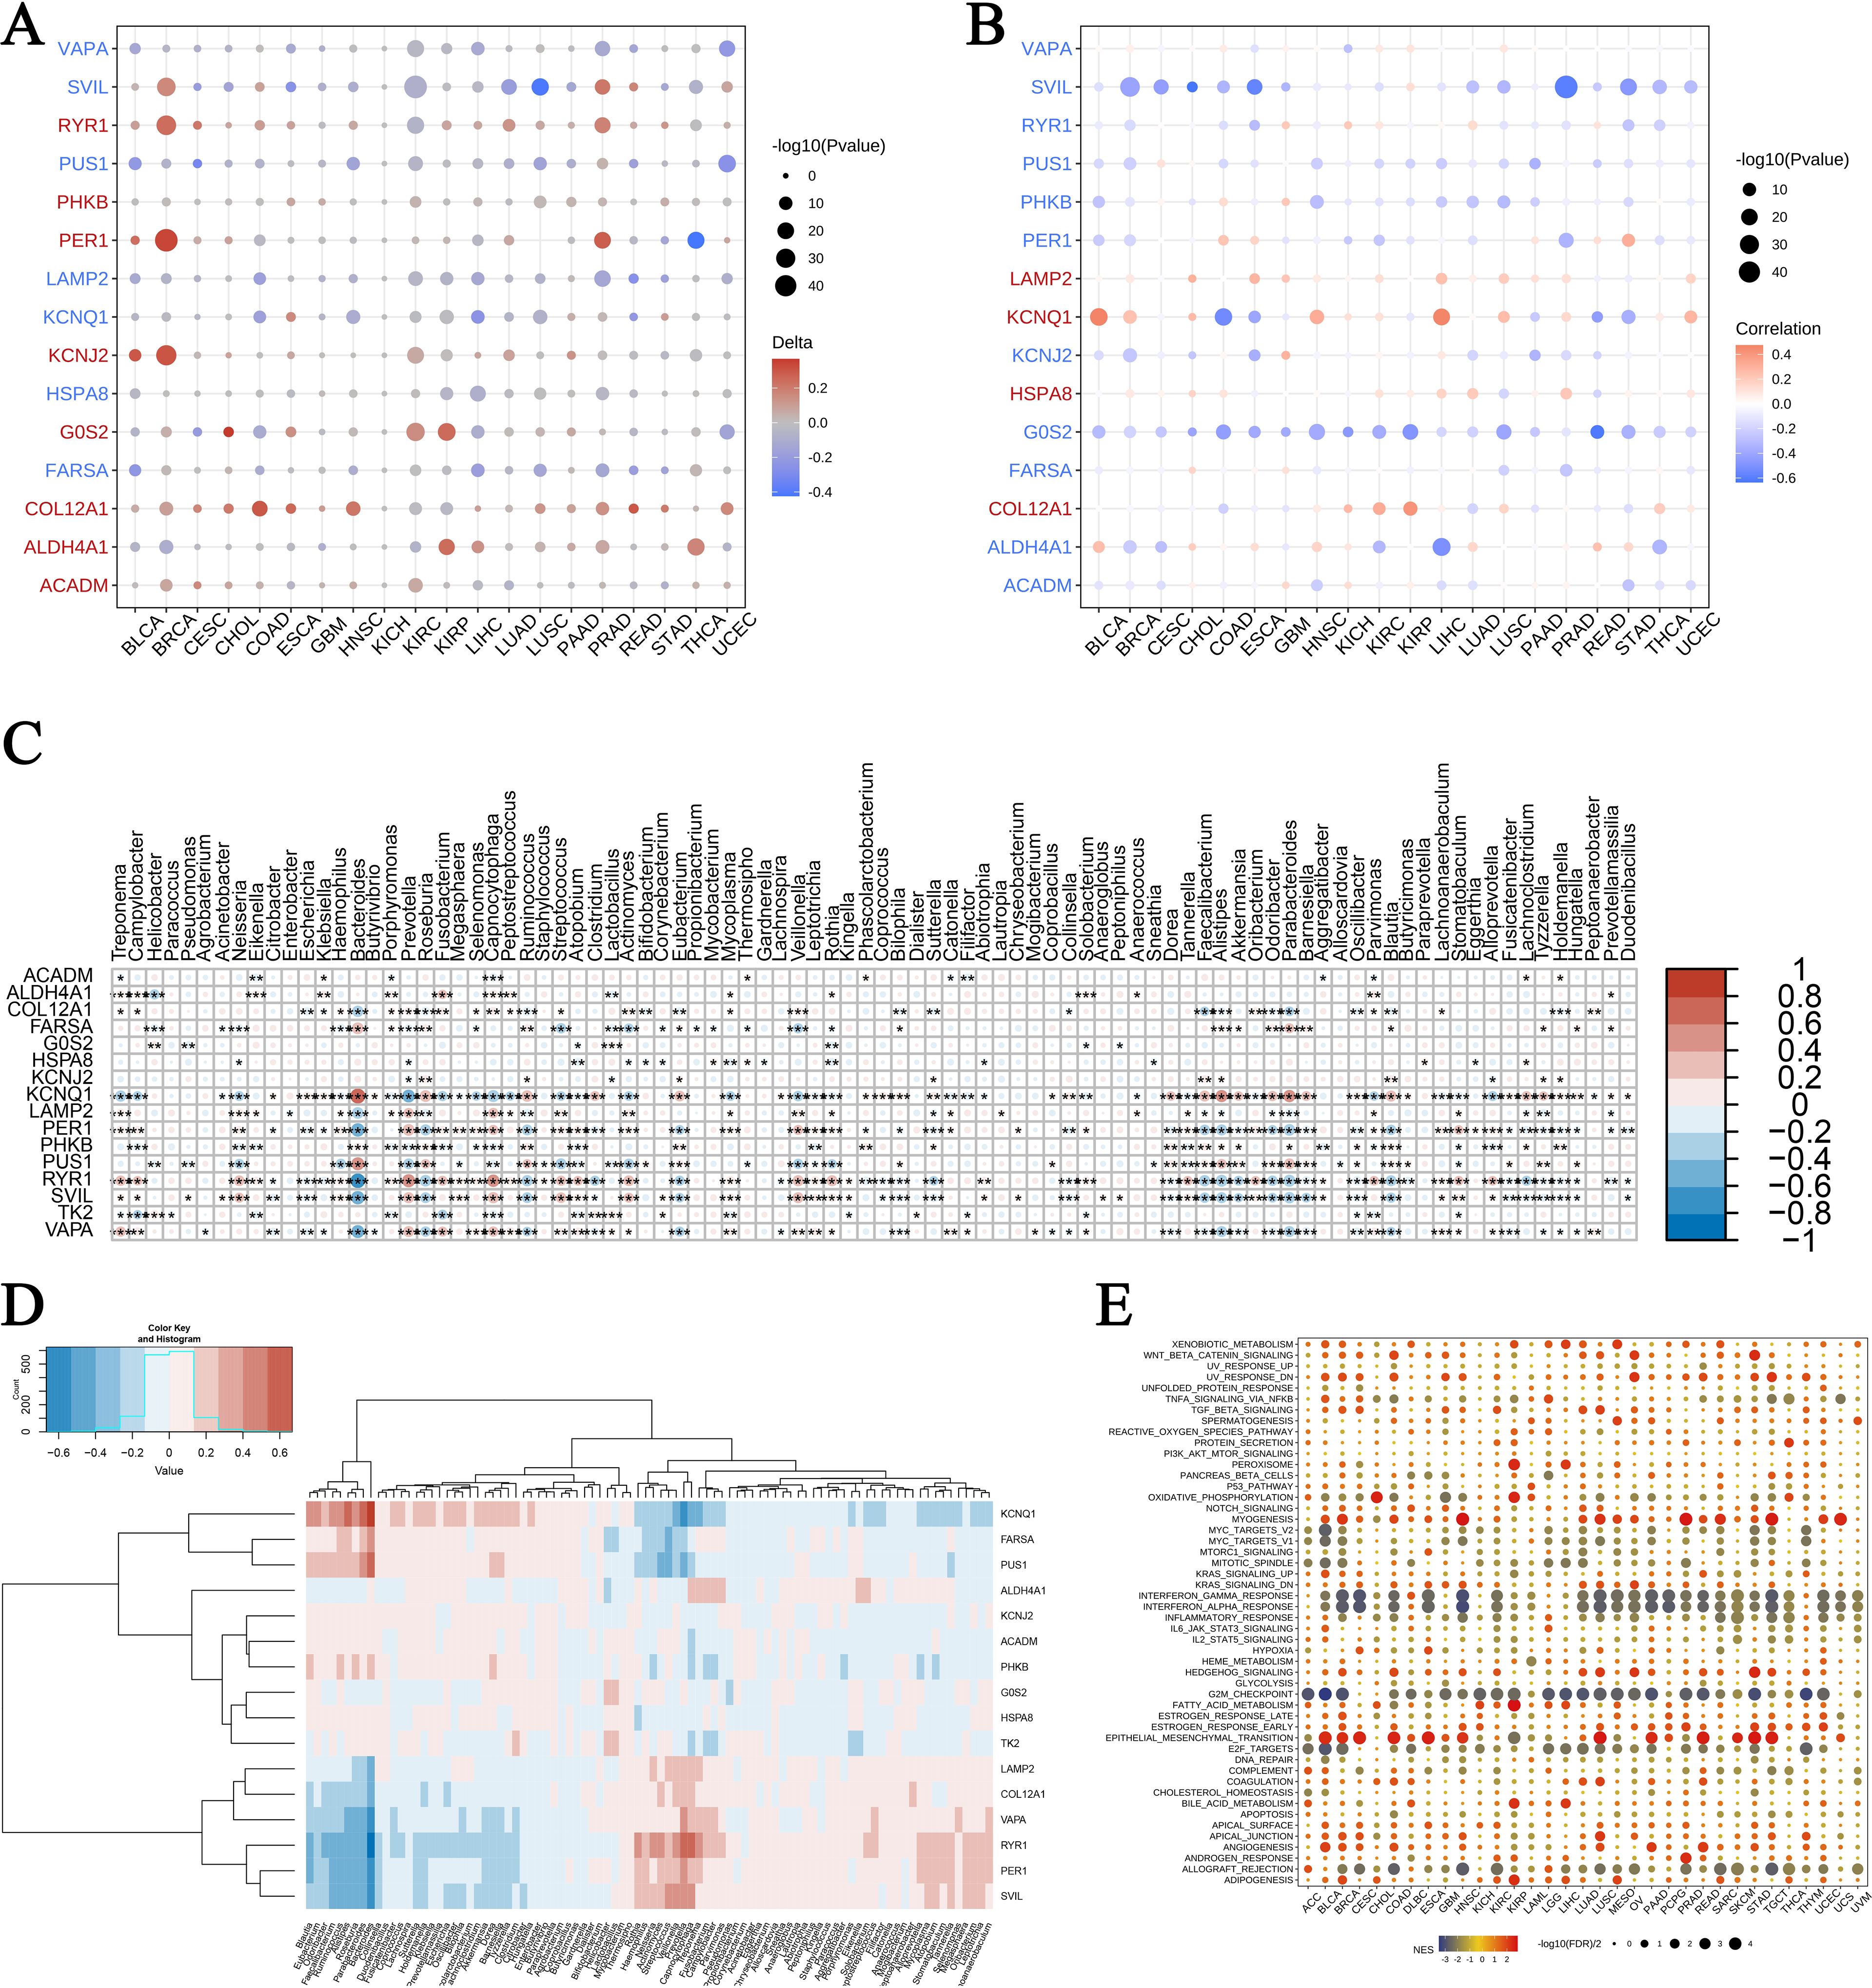
Figure 6. Pan-cancer enrichment analysis and gene expression in microbiomes. (A) Association of exercise-influenced burn and sepsis gene expression with CNV in multiple cancer types: This panel presents the correlation between the expression of exercise-modulated genes associated with burns and sepsis and copy number variations (CNV) across various cancer types. Circle size corresponds to the significance level (-log10 p-value), while the color gradient indicates delta values, with red representing upregulation and blue indicating downregulation. (B) Association of gene expression with promoter methylation across cancer types: This panel displays the correlation between gene expression and promoter methylation levels for exercise-influenced genes related to burns and sepsis across multiple cancers. Circle size reflects the significance level (-log10 p-value), while the color gradient denotes correlation values, with blue indicating negative correlation and red showing positive correlation. (C, D) Expression of exercise-influenced genes in microbiomes: The heatmap in panel (C) illustrates expression levels of these genes across various microbiomes, with color intensity representing normalized expression levels. Panel (D) depicts hierarchical clustering of gene expression data, with a color scale from blue (low expression) to red (high expression), showing distinct clustering patterns. (E) GSEA pathway enrichment analysis in different cancers: This bubble plot illustrates the pathways enriched in different cancers, with bubble size representing the number of genes involved and color indicating the enrichment score—red for a higher enrichment score and blue for a lower score. The symbols *, **, and *** represent statistical significance levels corresponding to p<0.05, p<0.01, and p<0.001, respectively.
Pan-cancer GSVA enrichment analysisThis study performed an extensive pan-cancer analysis of burn- and sepsis-related gene sets influenced by exercise across various cancer types using four scoring methods: combined z-scores, GSVA z-scores, PLAGE z-scores, and ssGSEA z-scores. Results in Supplementary Figure 3 reveal significant differences in gene set enrichment between normal and tumor tissues. Supplementary Figure 3A presents the combined z-scores, showing notable statistical significance in cancers such as KIRC and BLCA, which suggests differential gene expression. Supplementary Figure 3B displays the GSVA z-scores, with marked variations in THCA and KICH, pointing to potential implications for tumor biology. In Supplementary Figure 3C, the PLAGE z-scores highlight significant differences in KIRP and BLCA, underscoring the influence of exercise on gene set activity. Finally, Supplementary Figure 3D shows the ssGSEA z-scores, revealing substantial changes across multiple cancers, suggesting therapeutic potential for exercise-modulated genes in cancer treatment. This analysis provides key insights into the role of exercise-related genes in cancer biology, emphasizing their potential therapeutic applications. It opens avenues for future research, particularly in identifying cancer types that could benefit from exercise-based interventions and exploring the molecular mechanisms underlying exercise-induced gene expression changes in cancer.
MLIP modulates inflammation, oxidative stress, and macrophage polarization in LPS-induced RAW264.7 cellsThis study investigated the role of MLIP in regulating inflammation, oxidative stress, and macrophage polarization in LPS-induced RAW264.7 cells. Figure 7A shows that MLIP overexpression (MLIP-OE) significantly enhanced the expression of target genes, while MLIP knockdown (sh-MLIP) notably reduced expression, highlighting MLIP’s regulatory function. Figure 7B reveals that LPS treatment upregulated TNF-α, IL-6, and IL-1β mRNA levels, indicating an intensified inflammatory response. MLIP-OE attenuated these cytokine levels, suggesting its potential to suppress inflammation, while LPS + sh-MLIP further elevated inflammatory markers, indicating that MLIP inhibition exacerbates inflammation. Figure 7C demonstrates increased ROS production in the LPS group, reflecting heightened oxidative stress. MLIP-OE reduced ROS levels compared to LPS treatment alone, indicating that MLIP mitigates oxidative stress, while sh-MLIP further increased ROS levels. Figure 7D illustrates that superoxide dismutase (SOD) activity, a key antioxidant enzyme, was reduced by LPS but partially restored with MLIP-OE, underscoring the antioxidative role of MLIP. Figures 7E, F explore MLIP’s effects on macrophage polarization. MLIP-OE reduced the expression of the M1 marker CD86 and IL-1β, while increasing the expression of the M2 marker CD206, suggesting MLIP’s role in promoting a balanced macrophage polarization. IL-10 levels remained highest in the LPS group, reflecting the influence of LPS on anti-inflammatory responses. Figure 7G, through immunofluorescence staining, shows reduced IL-6 and IL-1β expression in the MLIP-OE group compared to the LPS and sh-MLIP groups, further supporting MLIP’s anti-inflammatory effects. Finally, Figure 7H presents flow cytometry data showing shifts in macrophage polarization profiles: MLIP-OE promoted a less inflammatory state, while sh-MLIP favored pro-inflammatory polarization. Overall, these results highlight the significant role of MLIP in modulating inflammation, oxidative stress, and macrophage polarization in LPS-induced RAW264.7 cells. These findings suggest that MLIP could serve as a potential therapeutic target for inflammatory diseases, particularly those involving macrophage polarization, such as autoimmune disorders, infections, and chronic inflammatory conditions.
留言 (0)