
記住我
A deficit in the quantity of functional β-cells results in insulin deficiency, elevated blood glucose levels, and the onset of the diabetic condition (1). One of the current research focuses is aimed at artificially generating insulin-producing cells to suppress the need for insulin administration in such cases. Although these cells can be successfully derived from human pluripotent stem cells, the efficiency of the protocols still requires optimization (2). An alternative, more ambitious approach, consists in eliciting β-cell regeneration from other cell types of the body (3). The existence of facultative pancreatic progenitors in the adult pancreas has been a matter of debate for decades (4, 5). The cell of origin in adult tissue has been proposed long ago to reside within the ductal tree (6) and, to date, this remains an intensive field of research, as highlighted by recent reports (7–17). However, the only widely accepted non-β cell source for new insulin producing cells is the interconversion of α- δ- and γ-cells under very specific conditions (18–21). Recently, a new adult progenitor population resident in the mouse pancreatic islets has been described, with the potential to replenish all the endocrine cells (22). This population, originally identified by its single-cell RNA-seq (scRNA-seq) global transcriptional profile, is characterized by the co-expression of epithelial (Epcam, Cldn10) and mesenchymal (Vim, Col3a1) markers, along with the novel progenitor markers Procr, Rspo1 and Upk3b, among others. Procr+ progenitor cells were reported to comprise about 1% of adult pancreatic islet cells, lack expression of Neurog3 or endocrine hormones, and give rise in organ homeostasis to all endocrine cells of the islets. When purified and co-cultured in vitro with endothelial cells, Procr+ progenitors differentiate into all endocrine cell types and create functional micro-islets that are capable of reversing diabetes in streptozotocin-induced mice (22). However, this groundbreaking report did not have the expected impact in the field, as there were no follow-up reports from independent research groups recapitulating these findings.
Notably, the Procr+ progenitor expression profile includes Rspo1, Dcn, Upk3b, and Procr, and displays epithelial-to-mesenchymal transition (EMT) features characterized by combined expression of epithelial and mesenchymal markers. It was suggested that these progenitors partially share their transcriptional profile with a subpopulation of endocrine progenitor (EP) cells present in the E14.5 mouse embryonic pancreas, although the major difference is that while the embryonic progenitors express Neurog3, their adult counterparts lack expression of this marker (22). Despite the expression of genes associated with EMT is a landmark of the well-established Neurog3+ embryonic EP, it should be noted that the embryonic pancreas harbors progenitor cells with diverse transcriptional signatures, many of which are being increasingly characterized through advancements in single-cell RNA sequencing (scRNA-seq) technologies (23–26). Intriguingly, key reported adult Procr+ pancreatic progenitor markers (including Upk3b, Rspo1 and Igfbp5) were identified in a previous study as characteristic of a pancreatic mesothelial cell population co-purified in scRNA-seq transcriptomes profiled from the mouse embryonic pancreas (23). Procr+ progenitors were originally identified from scRNA-seq data profiling both islet-enriched endocrine and non-endocrine cells mixed at a 1:1 ratio (22). Notably, rare progenitor cells of ductal or acinar origin with the potential to give rise to insulin-producing cells have been previously reported (4). Thus, it remains plausible that Procr+ progenitors are part of either the ductal or acinar cell compartments.
Taken together, these observations provide a foundation for raising concerns about the actual origin and role of these progenitors. Notably, adult Procr+ progenitors have been reported to co-express epithelial markers alongside well-known mesenchymal markers, such as Col3a1. While EMT is a prominent feature of EP during pancreas development, cells expressing mesenchymal markers are routinely excluded from integrative analyses tracking developmental trajectories of endocrinogenesis. Consequently, the potential role of rare progenitors with such characteristics remains largely unexplored.
In particular, it is currently unclear whether a Neurog3⁻ cell population equivalent to the adult Procr+ progenitors exists in the mouse embryonic pancreas, whether such a population is preserved as the pancreas develops, and, more intriguingly, whether these progenitors can also be identified in the developing human pancreas.
In this work, we present the results of an in-depth analysis of scRNA-seq and single-cell ATAC-seq (scATAC-seq) datasets aimed at tracking Procr+ progenitor cells in the mouse and human adult islets and in the embryonic pancreas. Our findings reveal that, while these progenitors could not be found in other mouse or human pancreatic islet preparations, in the embryonic pancreas they share an extensive transcriptional profile with a subset of mesothelial cells. Here, we report that these Procr-like mesothelial cells can be identified in the mouse and human embryonic pancreas, they are Neurog3⁻ and display a transcriptional profile resembling that of the recently identified adult islet-resident Procr+ progenitors.
By carefully dissecting the shared gene expression profiles of Procr-like mesothelial cells with the previously reported adult Procr+ progenitors, and with intermediate epithelial pancreatic progenitor stages connected to the endocrinogenesis process, we provide here a comprehensive annotation of genes potentially relating Procr-like mesothelial cells with pancreatic epithelial progenitors during physiological pancreas development in both mice and humans. Notably, we detected these cell clusters in complementary analyses of scRNA-seq datasets obtained from both mouse and human embryonic pancreas samples at several different developmental stages, obtained from separate studies, as well as scATAC-seq data from the mouse embryonic pancreas. Our results suggest a potential developmental lineage relationship: pancreatic bipotent progenitor (BP) → duct→ Procr-like/mesothelial, with the latter being overrepresented in late-stage (E17.5) mouse embryonic samples.
2 Materials and methods2.1 Single-cell RNA-seqAll analyses were performed using R (v4.1.1), with Conos (27) or Seurat (28) primarily employed for preprocessing, integration, and clustering. A summary of the methods is provided below, with further details available in the Supplementary Methods.
2.1.1 Mouse pancreatic islet data integrationData from six different studies [Gene Expression Omnibus (GEO): GSM2230761 (29); Sequence Read Archive (SRA): SRR10096826 (30), SRR14119316 (31), SRR8754575 (32), SRR11866759 (33); National Omics Data Encyclopedia (NODE): OEP000249, OEP000250 (22)] was dowloaded, re-processed and integrated using Conos and Seurat frameworks. Conos integration employed a graph-based approach, using PCA for dimensionality reduction and angular metrics to construct a shared nearest-neighbor graph. The Leiden algorithm revealed consistent clustering patterns that preserved cell identities and inter-dataset relationships, ensuring robust biological comparisons across datasets while minimizing batch effects. Graph embedding was conducted using the ‘largeVis’ method, resulting in an integrated dataset of 41,049 cells and 32,541 features. Seurat’s canonical correlation analysis (CCA) identified shared anchors across datasets, followed by data integration with IntegrateData(). The integrated dataset underwent scaling, PCA, clustering at a resolution of 1, and UMAP visualization, which preserved biological variability while providing a cohesive view of the datasets.
2.1.2 Human pancreatic islet data integrationProcessed datasets from Grün et al. (34), Muraro et al. (35), and Segerstolpe et al. (36) were integrated via Seurat, correcting batch effects with FindIntegrationAnchors(). The final dataset comprised 7,291 cells and 21,329 features.
2.1.3 Human and mouse embryonic pancreas cell data integrationSingle-cell RNA-seq data from human embryonic pancreas (GSA: HRA002757, PCW 4-11) and mouse embryonic pancreas (GEO: GSM3140915-18 and GSM3938451, E12.5-E17.5) were integrated to study pancreatic development. Human data, processed with SCTransform and clustered via PCA and Louvain algorithms, retained 28,368 and 44,734 singlets for PCW 4-6 and PCW 7-11, respectively, after doublet removal. Mouse data were normalized, variable genes identified, and gene names converted to human nomenclature for integration. Conos integration used PCA components and over-dispersed genes to construct a shared nearest-neighbor graph. Leiden clustering identified annotated clusters, with additional subclustering for endocrine hormone-expressing cells. Slingshot trajectory analysis revealed differentiation paths from MesothelialTBX3+ early cells to β-cells, highlighting lineage relationships and developmental dynamics. Visualization with largeVis ensured biological coherence across datasets.
2.1.4 Mouse embryonic pancreas integrationDevelopmental-stage datasets were preprocessed with Seurat, filtering for quality and regressing cell cycle effects. Datasets were integrated and analyzed using Conos to reveal key progenitor and epithelial populations.
2.1.5 Trajectory analysisLineage relationships were inferred using Slingshot (37), identifying potential differentiation dynamics from Procr-like mesothelial cells to mature β-cells.
2.1.6 Organoid scRNA-seq analysisPre-clustered organoid datasets were analyzed without additional processing, focusing on Procr+ progenitor cells and stages of development.
2.1.7 Human in vitro pancreatic progenitor data analysisThe human Day 13 pancreatic progenitor single-cell RNA-seq data (GEO: GSM5127847) was processed with Cell Ranger (v2.01) aligned to the GRCh38 genome. Low-quality cells (high mitochondrial content, low gene count) were filtered, and clusters identified using Seurat’s FindNeighbors and FindClusters. Differential expression was analyzed with Wilcoxon tests. Doublets were removed using scDblFinder. The in vitro Procr-like cells were integrated and analyzed with human embryonic pancreas mesothelial subsets using the Conos package.
2.2 Single-cell ATAC-seqFor single-cell ATAC-seq analysis of the E17.5 mouse embryonic pancreas, data from GEO GSM7244762/63 was processed using Seurat and Signac (38). Quality control metrics, including nucleosome signal and TSS enrichment, were applied to filter low-quality cells. Peak calling was performed independently for each lane and merged using Seurat’s functions. The data were normalized using TF-IDF, followed by dimensionality reduction (SVD) and clustering via the Louvain algorithm. Doublets were excluded using scDblFinder, and peak annotations were assigned using the EnsDb.Mmusculus.v79 database. Integrated data from scRNA-seq and scATAC-seq were visualized with UMAP, with predictions of cell types transferred from scRNA-seq based on gene activity profiles. Motif discovery was conducted using HOMER (39) on key chromatin regions. Additional details on scATAC-seq data processing and analysis can be found in the Supplementary Methods.
2.3 Statistical analysisStatistical significance was assessed using Wilcoxon rank-sum test with P < 0.05 considered significant. All statistical analysis and visualization were done with R and Bioconductor package.
3 Results3.1 Procr+ progenitors are not found in other adult pancreatic islet samplesTo track the presence of Procr+ progenitors originally identified in adult mouse pancreatic islets (22) (hereafter referred to as Procr+ progenitors), we integrated the original dataset generated by Wang et al. with five previously reported adult mouse pancreatic islet scRNA-seq samples (29–33). To unequivocally track the same cells, we retained the cell labels originally reported (data kindly provided by the authors) (22). Since identifying equivalent cell clusters across different datasets can be biased by the data integration strategy, we evaluated two broadly validated scRNA-seq integration approaches in parallel: the Conos and Seurat pipelines (27, 28).
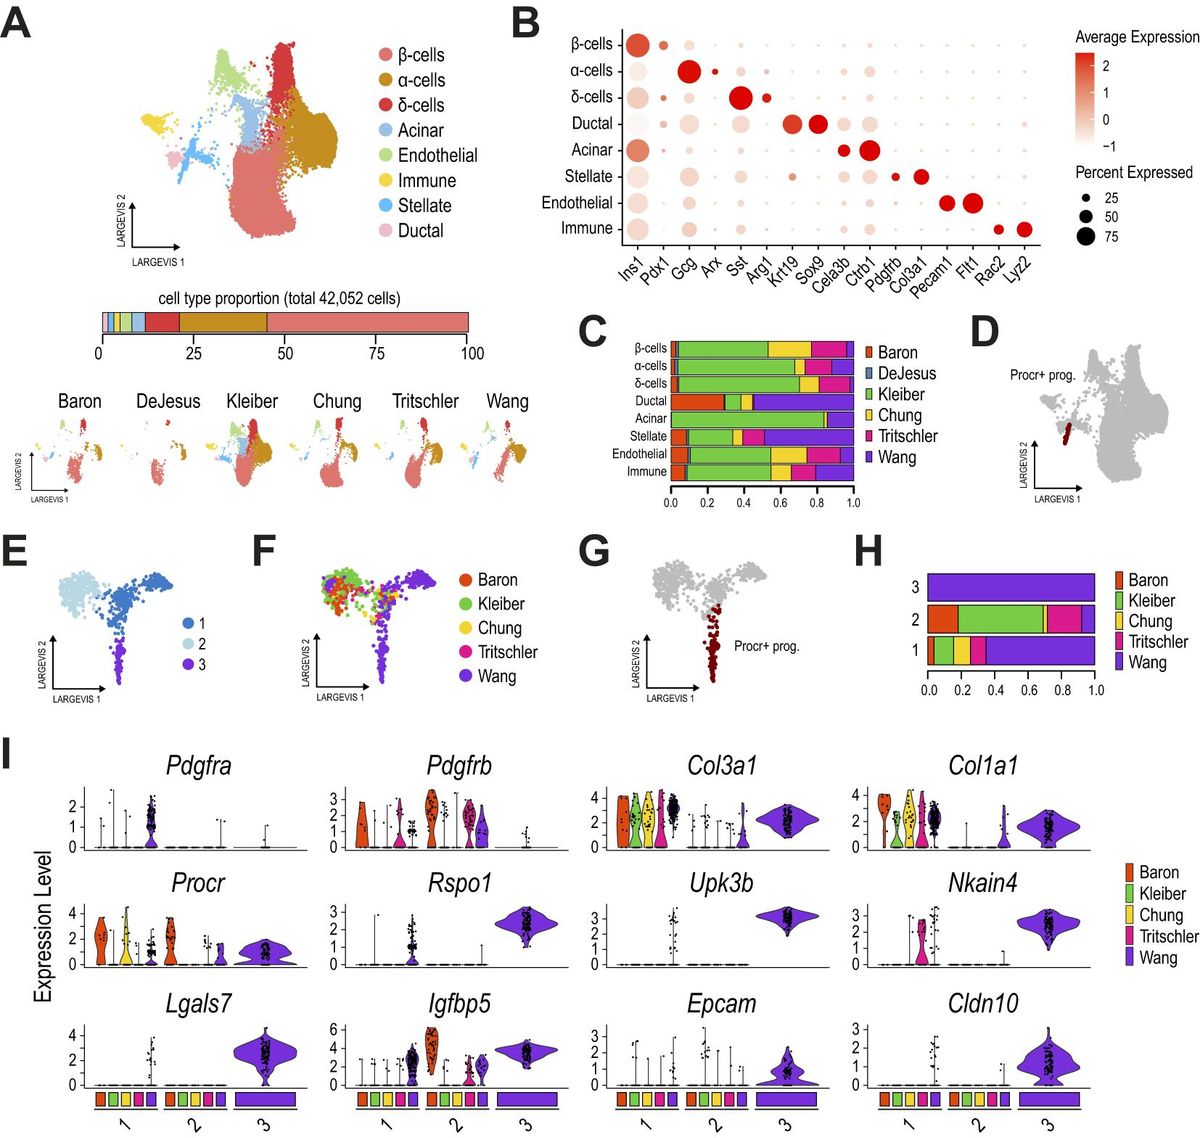
In total, we integrated 41,049 cells using Conos, and the results revealed 8 cell clusters matching most of the expected pancreatic cells in this tissue (Figures 1A, B, Supplementary Table 1), i.e. α- (Gcg+), β- (Ins1+) and δ-cells (Sst+), as well as ductal (Sox9+, Krt19+), acinar (Cela3b+), stellate (Pdgfrb+, Col3a1+), endothelial (Pecam1+) and immune cells (Rac2+). Of note, we could track cells from all samples in most clusters (Figure 1C). The Procr+ progenitors (as originally labeled, Figure 1D) were clustered with pancreatic stellate cells in this global analysis, likely due to the extensive overlap in the expression of mesenchymal/stellate markers.
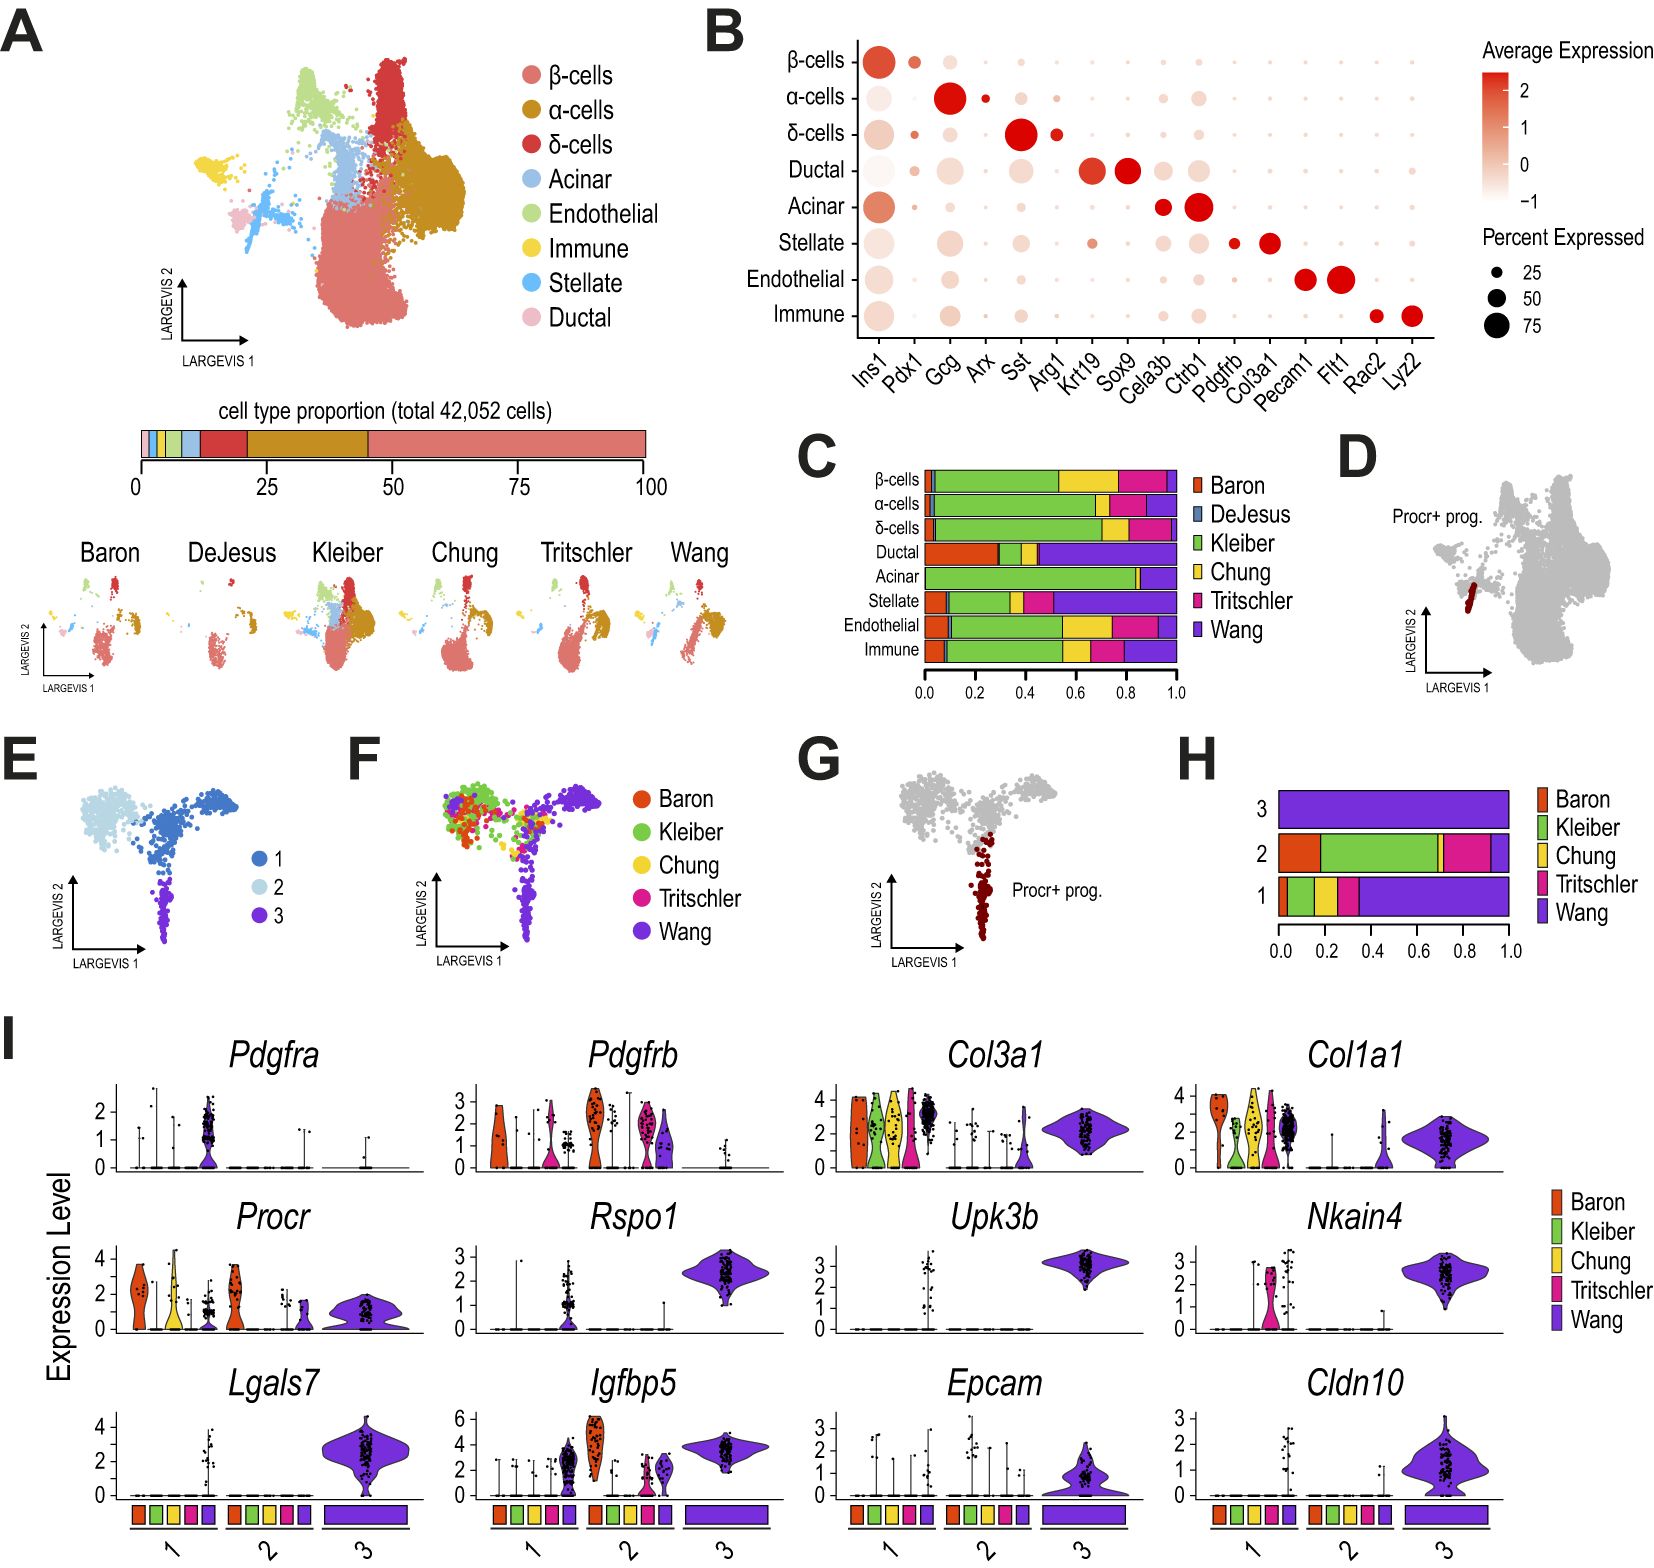
Figure 1. Procr+ progenitors are not found in other adult pancreatic islet samples. (A) Dimension plots of single-cell transcriptomes profiled from six different mouse adult pancreatic islet datasets, integrated with Conos. The bar below the main plot displays the proportion of each cell type relative to the total number of cells analyzed. Dimension plots in the bottom show cell distribution according to the sample of origin. (B) Dot plot showing the expression of key markers for endocrine, ductal, acinar, stellate, immune, and endothelial cell types, used to define clusters. (C) Proportion of cells from each dataset contributing to the cell clusters identified in (A). (D) Dimension plot highlighting the Procr+ progenitor cells originally reported. (E) Dimension plot of pancreatic stellate cells reclustered from (A) and reanalyzed with Conos. (F, G) Dimension plots showing cells colored by the sample of origin (F) and highlighting the Procr+ progenitor cells originally reported (G). The DeJesus dataset was excluded from this analysis as it contributed an extremely small number of cells. (H) Proportion of cells from each dataset contributing to each stellate cell subcluster. (I) Violin plots showing the expression of key activated (Pdgfra, Col3a1, Col1a1) and quiescent (Pdgfrb) stellate markers, along with Procr+ progenitor cell markers (Procr, Rspo1, Upk3b, among others), for each stellate cell subcluster identified in (E), split by the sample of origin. Cluster 3 contains only cells from the Wang et al. dataset.
An in-depth analysis of the stellate cluster identified three subclusters (Figure 1E). While clusters 1 and 2 contained cells from all samples, cluster 3 comprised exclusively Procr+ progenitor cells from the Wang et al. dataset (Figures 1F–H). A detailed analysis of stellate and Procr progenitor markers, split by sample of origin for each cluster, distinguished Procr+ progenitors from quiescent (Pdgfrb+/Col1a1-) and activated (Pdgfra+/Col1a1+) stellate cells (Figure 1I). Interestingly, except for Ifgbp5 and Procr itself, cells in cluster 3 expressed Procr+ progenitor markers at high levels and these were largely undetected in cells of clusters 1 and 2, consisting of quiescent and activated stellate cells (Figure 1I). The scarce number of cells expressing Procr markers at intermediate levels in the stellate subclusters does not entirely exclude the possibility that these could represent Procr-like cells present at extremely low frequencies in other samples. Nevertheless, the unbiased clustering analysis indicates that these cells exhibit a global transcriptional profile more similar to stellate cells than Procr+ progenitors. Importantly, similar results were obtained using the Seurat integration approach (Supplementary Figures 1A–J). Taken together, our results suggest that, despite being transcriptionally similar to pancreatic stellate cells, Procr+ progenitors are not detected in other adult mouse pancreatic islet samples.
The integration of mouse (22) and human pancreatic islet datasets (34–36) allowed the identification of equivalent cell clusters as described above, matching most of the expected pancreatic cells in this tissue (Supplementary Figures 1K–M, Supplementary Table 2). An in-depth analysis of the stellate cluster in this cross-species integrated dataset also yielded similar results, mapping Procr+ progenitors to the stellate cluster (Supplementary Figure 1N). Consistent with our earlier analysis, a detailed inspection of this cluster identified three subclusters associated with quiescent and activated stellate cells (clusters 0 and 1, respectively; Supplementary Figures 1O–T), and Procr+ progenitors (cluster 2). Notably, although cluster 2 contained a small number of cells from the human datasets, expression analysis of stellate and progenitor markers, split by sample of origin, revealed that cells in cluster 2 from human datasets did not express Procr+ markers such as UPK3B, RSPO1 and LGALS7 (Supplementary Figure 1T).
3.2 Mesothelial cells in the mouse embryonic pancreas exhibit a transcriptional profile closely resembling that of adult Procr+ progenitorsWe next interrogated whether Procr+ progenitors could be detected during mouse pancreas development. For this purpose we integrated the original adult islet dataset generated by Wang et al. with mouse embryonic pancreas scRNA-seq datasets profiled at different developmental stages, from E12.5 to E17.5 (23, 40). As described above, we kept the Procr+ progenitor cell labels originally reported. Additionally, to improve the accuracy of our integration analysis, we carefully excluded potential doublets (see Methods).
Since several progenitor cell types in the embryonic pancreas lack counterparts in the adult pancreatic islet sample, we employed a recently reported integration strategy (Conos) to accommodate clusters not present in all samples (27). Integration of the mouse adult islet dataset containing Procr+ progenitors with E12.5, E13.5, E14.5 and E17.5 datasets included in total 36,739 cells after quality filtering and doublet removal. A cell clustering analysis revealed most of the expected cell types in the developing pancreas, including mesenchymal (Col3a1+), endothelial (Pecam1+), immune (Rac2+), erythrocytes (Hba-a1+) and neural-crest-derived/Schwann cells (Sox10+), besides the epithelial cells (Epcam+) accounting for the different progenitor and differentiated pancreatic cell types (Supplementary Figures 2A, B, Supplementary Table 3). Notably, Procr+ progenitors (as labeled by Wang et al.) were mapped to cluster 2 (Supplementary Figure 2C), which also included cells from all other pancreatic embryonic stages (Supplementary Figure 2D). Unlike mesenchymal cells, this cluster, along with the transcriptionally similar cluster 10, expressed epithelial markers (e.g., Krt19, and low levels of Epcam), as well as previously reported Procr+ progenitor marker genes such as Procr, Rspo1, Upk3b and Igfbp5 (Supplementary Table 3). Unexpectedly, these clustered cells expressing Upk3b, Rspo1 and Igfbp5 in the embryonic pancreas have been previously classified as mesothelial cells based on their co-expression with other established mesothelial markers such as Wt1, Krt19 and Msln (23). However, a detailed characterization of the expression pattern of these genes, associated with adult Procr+ progenitors, has not been reported for the developing mouse pancreas. Notably, given that Krt19 is also a well-known epithelial pancreatic ductal marker (41), and that other classic mesenchymal markers, such as Vim, are also expressed in pancreatic epithelial cells undergoing migration during development (42), it remains plausible that low-level expression of Upk3b, Igfbp5, and other Procr+ marker genes is shared among various cell populations within the embryonic pancreas (Supplementary Figure 2E). Supporting a potential role for Upk3b in epithelial pancreatic progenitors, recent findings indicate that Upk3bl1, an important paralog for Upk3b, is upregulated in EP at advanced stages of endocrinogenesis (43).
To further explore the potential lineage relationship of a subset of these mesothelial cells (with the Procr+ progenitor expression pattern) and various pancreatic progenitor cell types, we selectively reanalyzed the pancreatic epithelial cells (red box clusters in Supplementary Figure 2B), the mesothelial cells matching the Procr-like expression profile (clusters 2 and 10), and the adult Procr+ progenitor cells. This approach allowed us to more precisely identify most of the epithelial pancreatic progenitor and differentiated cell types expected at these developmental stages based on established cell type markers (24, 25, 44–46) (Figures 2A, B). These included tip (Ptf1a+, Sox9+, Pdx1+) and trunk/bipotent progenitor (BP; Sox9+, Pdx1+, Dcdc2+) cells, which were additionally subset upon the co-expression of proliferative genes (Top2a+, Aurkb+), as well as acinar (Cela3b+), ductal (Sox9+, Muc1+), EP (Neurog3+), Fev+ progenitors (Fev+), α-cells (Gcg+), β-cells (Ins1+) and δ-cells (Sst+) (Figure 2B, Supplementary Table 4). We also identified two additional clusters that co-expressed epithelial (Krt18+, Krt19+) (41) and mesenchymal (Col3a1+) markers, which were additionally subset upon the co-expression of proliferative genes (Top2a+, Aurkb+). These also co-expressed most of the previously reported Procr+ progenitor markers, including Procr, Rspo1 and Upk3b (Figures 2B, C). Since the cells in these clusters also expressed the mesothelial cell markers Wt1 and Msln, and were previously associated with this cell type, we hereafter refer to these Procr-like clusters as “Mesothelial” and “Mesothelial proliferative” (Mesothelial pr.).
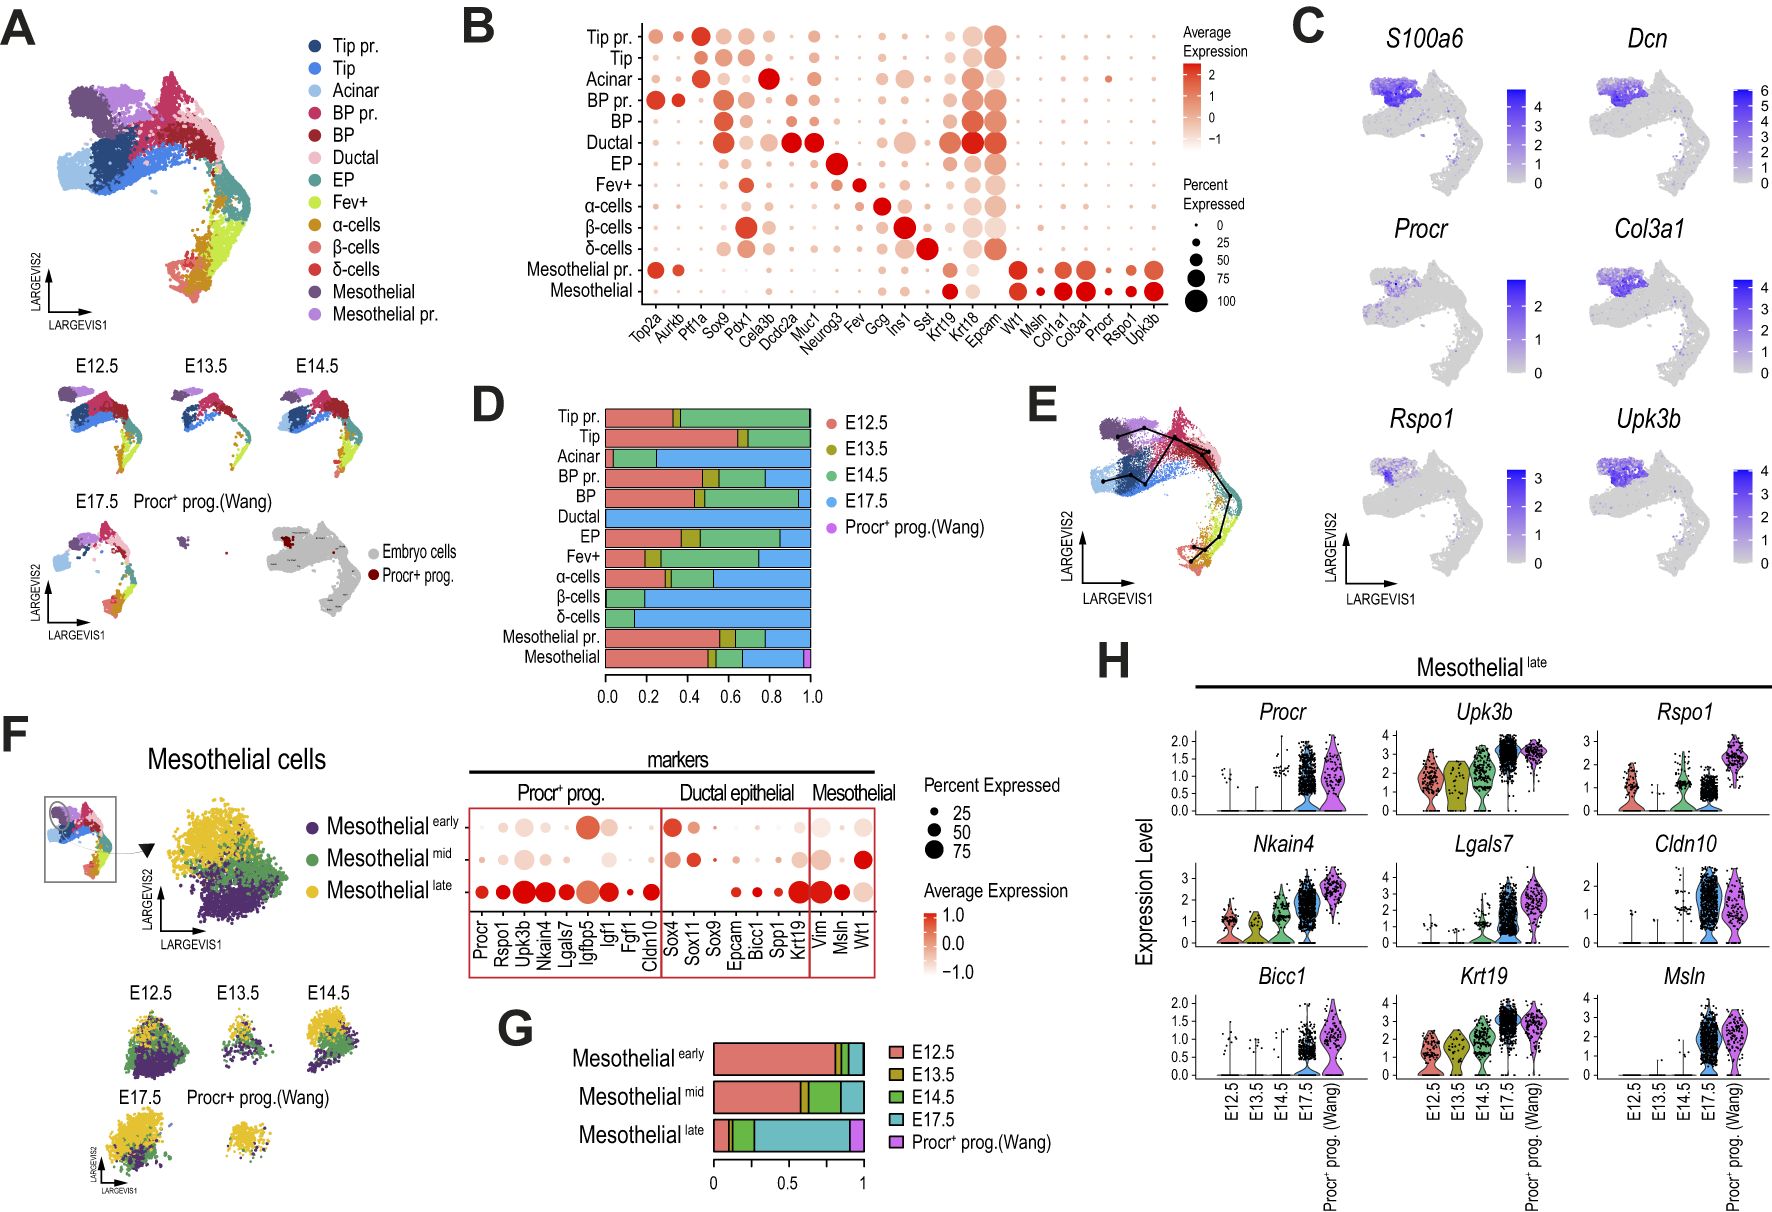
Figure 2. Mesothelial cells in the mouse embryonic pancreas exhibit a transcriptional profile closely resembling that of adult Procr+ progenitors. (A) Dimension plot of single-cell pancreatic epithelial and mesothelial transcriptomes profiled from the E12.5-E17.5 mouse embryonic pancreas, integrated using Conos with the originally reported Procr+ progenitor cells profiled from adult pancreatic islets. Dimension plots in the bottom panel show cell distribution according to sample timepoint. The bottom right dimension plot highlights the location of the originally reported Procr+ progenitors. (B) Dot plot showing the expression of selected pancreatic and Procr+ progenitor markers used to match cell clusters. Cells clustered as in (A). (C) Feature plots showing the expression of selected Procr+ progenitor cell markers. (D) Proportion of cells from each dataset contributing to the cell clusters identified in (A). (E) Trajectory analysis ordering of mesothelial and pancreatic epithelial cells clustered as shown in (A). (F) Dimension (left panels) and dot (right panel) plots showing re clustering of mesothelial cells from (A). Dimension plots in the bottom panel show cell distribution according to sample timepoint. The dot plot shows the expression of selected Procr+ progenitor cell markers, genes with relevant functions in ductal and other pancreatic epithelial cells, and mesenchymal/mesothelial-associated genes, as indicated in the labels. (G) Proportion of cells from each dataset contributing to the cell clusters identified in (F). (H) Violin plots showing the expression of key Procr+ progenitor cell markers in cells of the mesotheliallate cluster (as defined in panel F), split by developmental timepoint.
Of note, Procr+ progenitors from adult pancreatic islets mapped to the Mesothelial cluster, and this cluster also included cells from all embryonic pancreatic stages analyzed (Figure 2D). Thus, the previously reported adult Procr+ progenitor population (22) presents a global transcriptional profile that matches a subset of cells previously associated with mesothelial cells (23), and this subpopulation can be tracked in samples of the E12.5-E17.5 mouse embryonic pancreas profiled from 2 independent studies (23, 40). Although these clusters did not directly overlap with pancreatic epithelial cells (Supplementary Figure 2F), a trajectory analysis associated them with ductal and BP cells (Figure 2E), suggesting the provocative hypothesis that they are transcriptionally related to cells of ductal origin. The genes transcriptionally linking mesothelial clusters with ductal cells included previously reported ductal and BP marker genes such as Anxa2, Spp1, and Bicc1 (25, 47, 48). Interestingly, this also included genes involved in ductal-mediated regenerative processes such as Clusterin (Clu) (49). However, the well-known BP/ductal lineage markers Sox9 and Hnf1b were not expressed in mesothelial cells (Supplementary Figure 2G). Importantly, most of these genes were preferentially expressed in pancreatic epithelial cells rather than mesenchymal cells (Supplementary Figure 2H).
An in-depth analysis of the Mesothelial cluster revealed three interconnected subclusters (Figure 2F), which were named Mesothelialearly, Mesothelialmid and Mesotheliallate, based on their proportion of cells from the early (E12.5/E13.5), mid (E14.5), and late (E17.5) pancreatic developmental stages (Figure 2G). Interestingly, Procr+ progenitors from adult islets mapped to the Mesotheliallate cluster, which was largely composed of E17.5 cells. Further supporting a maturing role during pancreas development, we found that the expression of key Procr+ progenitor markers increased from E12.5 to E17.5 in cells of the Mesotheliallate cluster, with the highest expression levels observed at E17.5, approaching those of bona fide Procr+ progenitors reported by Wang et al. (Figure 2H). Interestingly, we found that Sox4 and Sox11, coding for transcription factors with key previously reported roles in BP and EP commitment (46, 50), were expressed at higher levels in Mesothelialearly and Mesothelialmid clusters, respectively (Figure 2F, dotplot panel). Noteworthy, while Sox9 could be barely detected in Mesothelial cluster cells, other previously reported BP/ductal markers were upregulated in Mesotheliallate cells, following the expression pattern for Epcam. These included Bicc1, Spp1 and Krt19 (24, 41, 48, 51). Finally, we detected upregulation of Vim (a mesenchymal marker also upregulated in the BP→EP transition), Msln, and Wt1 (mesothelial markers) (23) in the Mesothelialmid (Wt1) and Mesotheliallate (Vim, Msln) stages. While Wt1 is also expressed in activated pancreatic stellate cells (PaSCs) and may play key roles in pancreatic regeneration (52), its potential role during pancreas development remains to be explored.
Although we accounted for doublets in cells from the embryonic pancreas (53), cells in the Mesothelial clusters exhibited a combination of markers that play key roles in pancreatic epithelial progenitors (Sox4, Bicc1, Spp1) and mesothelial markers (Msln, Wt1), along with high expression levels of previously reported markers of adult Procr+ progenitors (Procr, Upk3b, and Igfbp5, and others). While some of these factors (e.g., Sox4, Krt19) are expressed and play relevant roles in both pancreatic epithelial and mesenchymal/mesothelial cells (41, 46, 50, 52, 54), others have been primarily reported in the context of pancreatic epithelial BP/ductal lineage commitment (e.g., Bicc1, Spp1). This led us to evaluate the expression of these markers in the original adult pancreatic islet dataset (Supplementary Figure 2I) (22). Interestingly, we found that the originally reported Procr+ progenitors were the only identified cell clusters that expressed Msln and Upk3b, while the expression of other markers in Procr+ progenitors was selectively shared with Stellate and Endothelial (Procr), Ductal (Krt19, Sox4), Stromal (Wt1), or Ductal and Stromal cells (Bicc1, Vim) (Supplementary Figure 2J). Vim was also expressed in Stellate, Endothelial and Immune cells. Taken together, these results suggest that a developmental lineage potentially giving rise to adult Procr+ progenitors is established early in mouse pancreas development.
3.3 The chromatin accessibility landscape of a subset of mesothelial cells supports epithelial pancreatic progenitor competenceOur results suggest that the adult Procr+ progenitor lineage is gradually established during mouse pancreas development, with mesothelial cells from the E17.5 mouse embryonic pancreas exhibiting the closest transcriptional profile. However, while these cells are characterized by co-expression of epithelial and mesenchymal/mesothelial markers, the expression levels of other key pancreatic progenitor markers, such as Pdx1, Sox9, or Ptf1a, remain undetectable. Additionally, these cells, which exhibit a transcriptional profile highly similar to that of adult Procr+ progenitors (Upk3b+, Rspo1+, among other markers), were previously classified as mesothelial cells (23). Thus, the competence of at least a subset of these cells to give rise to epithelial pancreatic progenitors and endocrine cells remains uncertain.
One known limitation of scRNA-seq is the potential misinterpretation of results due to the sequencing of doublets (which we aimed to reduce in our analysis by using a state-of-the-art approach) (53), as well as contamination with ambient RNA (which is most relevant for highly expressed genes). Analysis of chromatin accessibility at the single-cell level (single-cell ATAC-seq) provides a complementary approach that may be more robust to this latter bias. Additionally, it has been reported that epigenetic competence in pancreatic progenitors is acquired prior to changes in their corresponding transcriptional profiles (55). Thus, to investigate whether Procr-like mesothelial cells present accessible chromatin at key epithelial pancreatic genes, we analyzed the single-cell ATAC-seq profiles (scATAC-seq) of the E17.5 mouse embryonic pancreas (56).
To increase the accuracy of downstream analyses, we used the scDblFinder package to remove doublets (53). A global cell clustering analysis allowed us to discriminate most of the expected cell types in the developing pancreas at this stage based on the calculated gene activity profiles (i.e., accessibility regions located within the gene body and promoter region for each gene). Although with less accuracy, due to the more ubiquitous pattern of accessibility regions, we were able to track mesenchymal (Col3a1+), endothelial (Pecam1+), immune (Rac2+), and neural-crest-derived/Schwann cells (Sox10+), in addition to the epithelial cells (Epcam+) accounting for the different progenitor and differentiated pancreatic cell types (Supplementary Figures 3A, B). We also identified a cell cluster matching mesothelial cells with a Procr-like progenitor gene activity profile (cluster 2).
Following the same approach as described for the scRNA-seq analyses, we next selectively reanalyzed the pancreatic epithelial cells (red box clusters in Supplementary Figure 3B) and mesothelial cells matching the Procr-like expression profile (cluster 2). We used the scRNA-seq expression profiles of the E17.5 pancreas (Figure 3A) from our integrated analysis to label the 10 scATAC-seq clusters identified. This approach allowed us to track most of the expected epithelial pancreatic progenitor and differentiated cell types at this developmental stage based on their average gene activity scores at established cell type markers (Figure 3B). Based on their cell type label predicted from the scRNA-seq analysis, we relabeled the scATAC-seq clusters as Duct/Acinar, Acinar, Duct/BP, EP, Fev+, α, β, δ, and 2 subsets of Procr-like mesothelial cells (Figures 3B, C). In contrast with our scRNA-seq classification, the mesothelial clusters identified from the scATAC-seq datasets did not differ in accessibility at cell cycle-associated genes, but rather in their accessibility levels at proper Procr+ progenitor marker genes (e.g., Rspo1, Upk3b). We thus renamed them as MesothelialUpk3b-high and MesothelialUpk3b-low. Notably, while chromatin accessibility at the Upk3b promoter was undetectable in MesothelialUpk3b-low cells, these displayed increased accessibility at key pancreatic epithelial genes, including Neurog3, Pdx1 and Sox9, suggesting that this cell subset could be primed for pancreatic epithelial progenitor competence (Figure 3B, Supplementary Figure 3C).
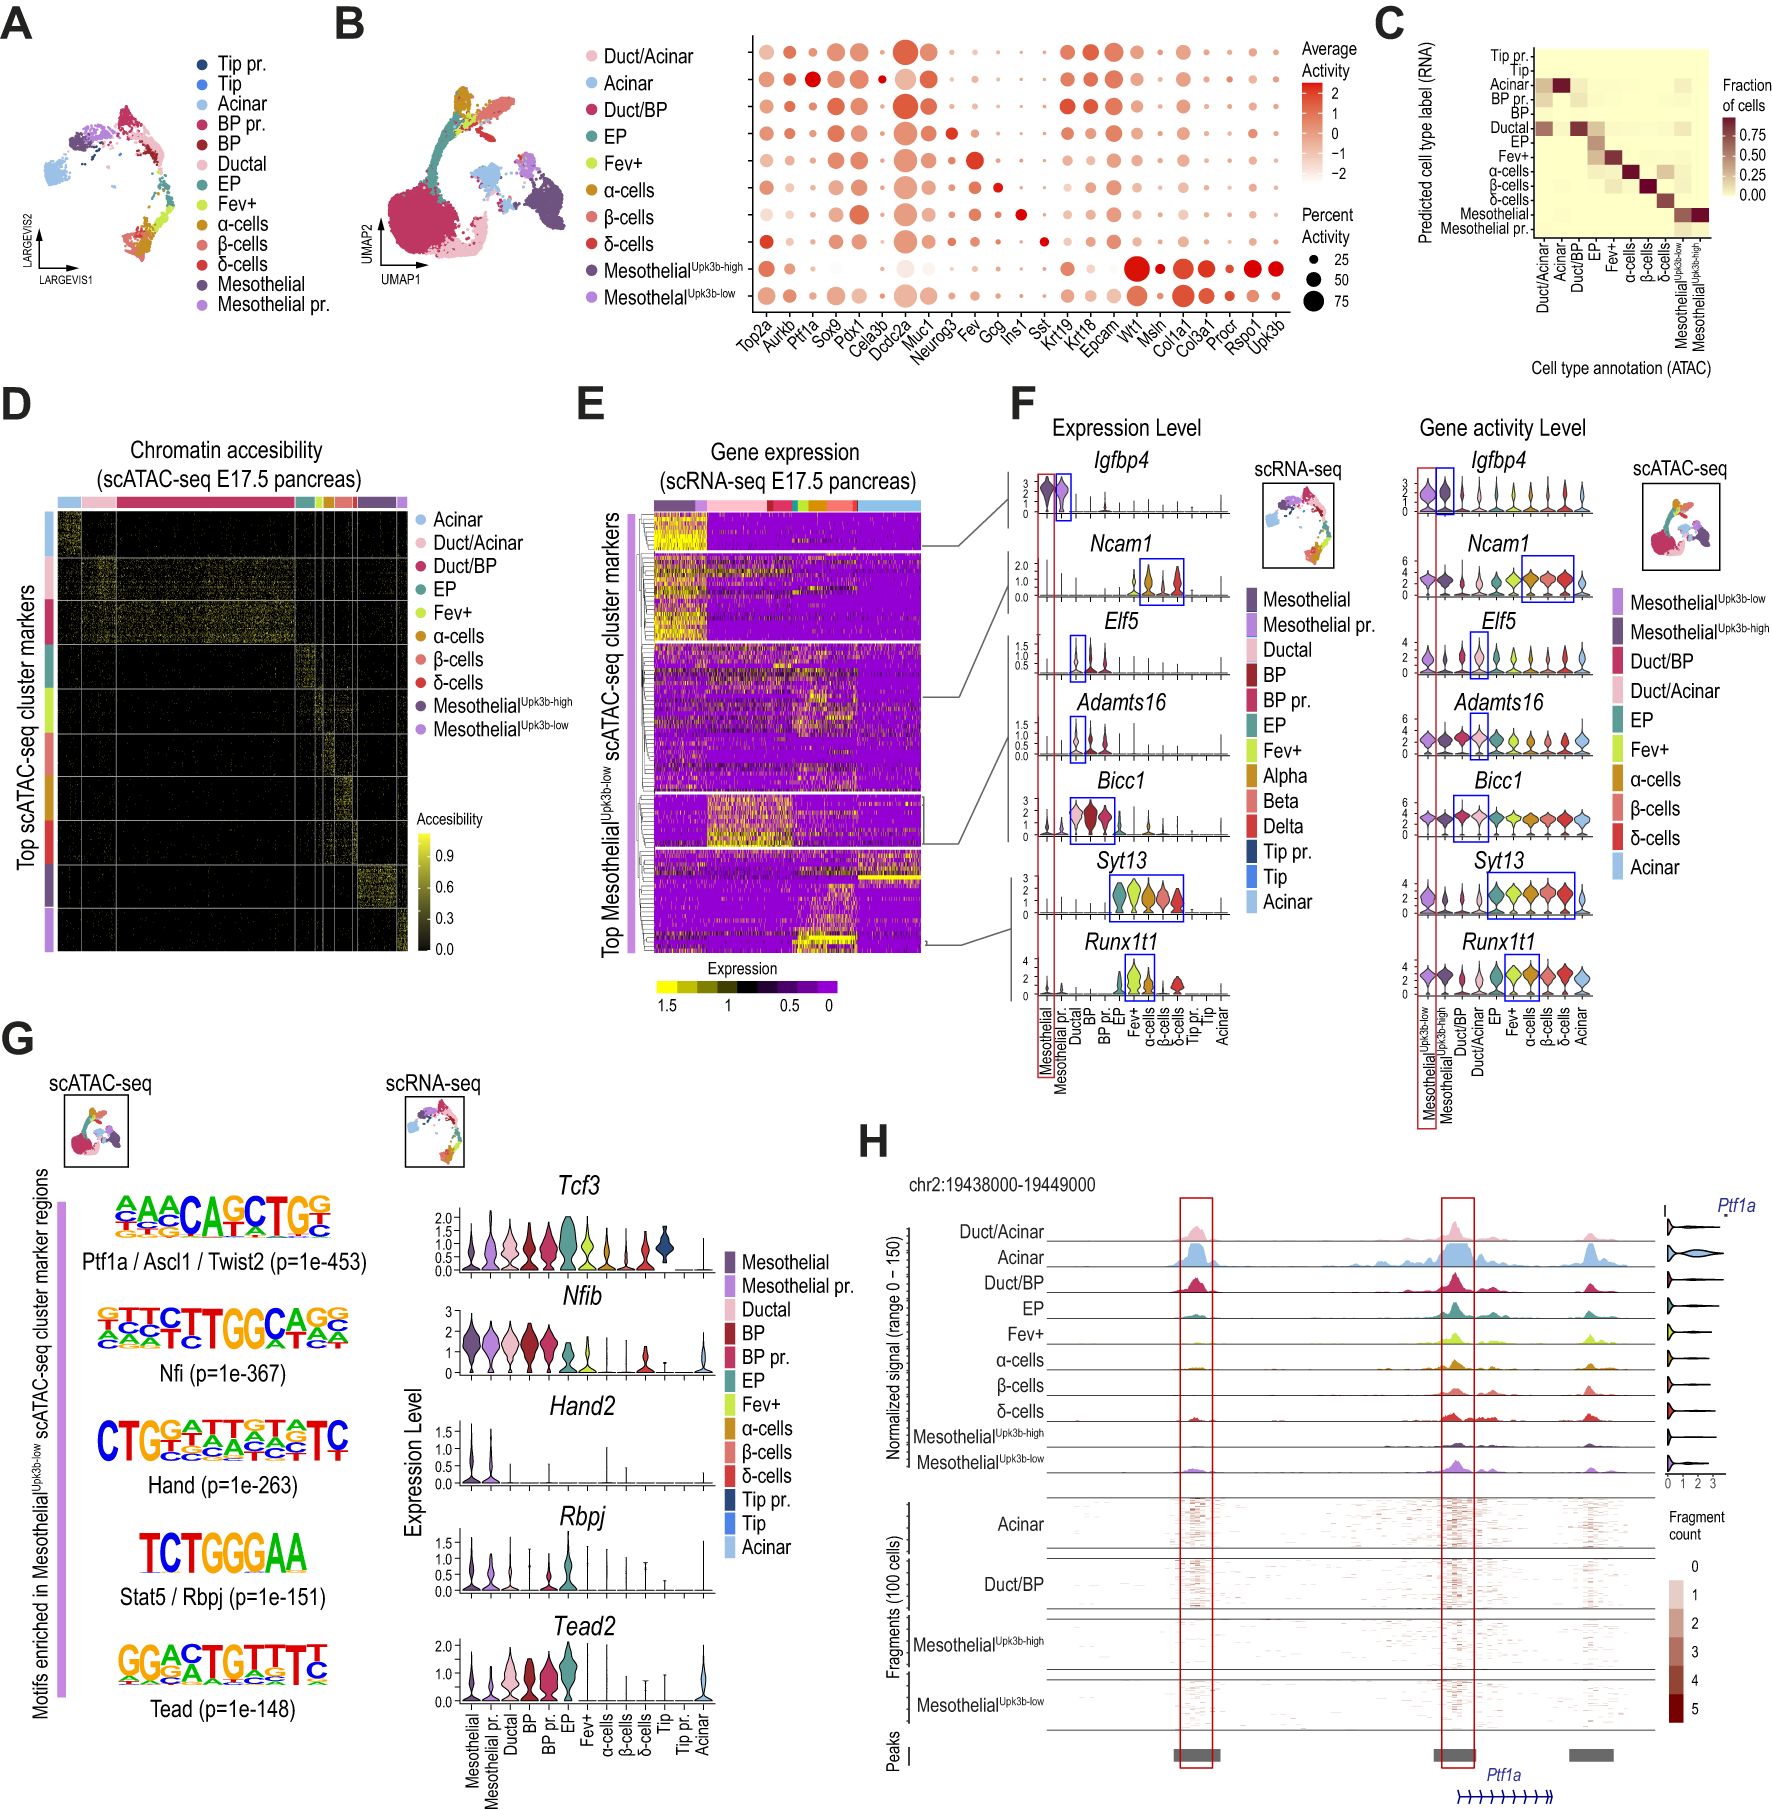
Figure 3. The chromatin accessibility landscape of a subset of mesothelial cells supports epithelial pancreatic progenitor competence. (A) Dimension plot of E17.5 single-cell pancreatic epithelial transcriptomes clustered as in Figure 2A. (B) UMAP (left panel) and dot (right planel) plots of single-cell accessibility profiles obtained for the epithelial and mesothelial cells of the E17.5 mouse embryonic pancreas. The dot plot shows the gene activity scores of selected pancreatic, mesothelial, and Procr+ progenitor markers. (C) Heatmap showing the fraction of cells from each predicted ATAC cell type (x-axis) corresponding to RNA cell type annotations (y-axis, scRNA-seq analysis presented in A). The color scale represents the fraction of cells for each combination of RNA annotation and predicted ATAC label. (D) Heatmap showing chromatin accessibility for the top 50 marker regions across pancreatic epithelial and mesothelial cells of the E17.5 mouse embryonic pancreas, clustered as shown in (B). Each row represents a marker region, and each column represents a cell in the scATAC-seq clusters (Acinar, Duct/Acinar, Duct/BP, EP, Fev+, α-cells, β-cells, δ-cells, MesothelialUpk3b-high, and MesothelialUpk3b-low), with color intensity indicating the level of chromatin accesibility. (E) Heatmap showing the scaled expression values for genes associated with the top 1,000 MesothelialUpk3b-low cluster marker regions recovered from the scATAC-seq analysis. Each row represents a marker region, and each column represents a cell in the scRNA-seq clusters. Color intensity indicates gene expression levels corresponding to pancreatic epithelial and mesothelial cells of the E17.5 mouse embryonic pancreas, clustered as shown in (A). The dendrogram on the y-axis highlights subsets of MesothelialUpk3b-low cluster marker regions that share expression with specific clusters of the E17.5 scRNA-seq samples. (F) Violin plots showing the expression level (left panel) and gene activity score (right panel) of selected genes from each subset of MesothelialUpk3b-low cluster marker regions identified in (E). (G) Highly enriched motifs recovered de novo from the MesothelialUpk3b-low cluster marker genomic accesible regions (left panels). The enrichment p-value along with the top factors matching each motif are displayed below. Violin plots on the right display the expression pattern in cells of the E17.5 embryonic pancreas for selected genes coding for the top transcription factors matching the de novo DNA binding motifs shown. (H) Chromatin accessibility landscape in the vicinity of Ptf1a for E17.5 pancreatic epithelial and mesothelial cells clustered as in (B). The bottom tracks display the fragment count for selected clusters, and the accessibility regions with enrichment over background (peaks). The violin plots on the right display the gene activity score for Ptf1a at each cell cluster.
Subclustering restricted to the MesothelialUpk3b-low cells identified several subsets, all of which exhibited gene activity at pancreatic epithelial genes (e.g., Ptf1a, Sox9, Pdx1, Neurod1) and Procr progenitor markers (e.g., Procr, Rspo1, Upk3b), further supporting a gradual transition in the chromatin accessibility profiles in the vicinity of these genes (Supplementary Figures 3D, E). Importantly, top cluster marker regions, considered without any proximity restriction to annotated genes, displayed a strikingly cluster-exclusive accessibility pattern, further supporting that these are bona fide distinct cell subtypes and arguing against potential contamination with doublets (Figure 3D).
We next examined in closer detail the accessibility pattern of MesothelialUpk3b-low cells. We followed two approaches for downstream analyses. On one hand, we evaluated the expression profile of genes associated (either overlapping or located within 10Kb of the gene body) with the top 1,000 accessibility marker regions in pancreatic progenitor and differentiated cells as clustered from our scRNA-seq analysis (Figure 3A). Out of the 783 genes associated with the top 1,000 MesothelialUpk3b-low cluster marker regions, 583 were detected in cells of the pancreatic epithelial and/or Mesothelial scRNA-seq clusters of the E17.5 pancreas. We focused on the subset of these which presented a strong and consistent expression, thus retaining 102 genes that presented robust associations between the accessibility regions and its expression in any specific cluster. Noteworthy, while almost one third of these were selectively expressed at high levels in Mesothelial and Mesothelial pr. cells, the remaining genes were expressed at low/undetectable levels in these clusters, and presented expression profiles that were enriched either at Ductal/BP, EP/endocrine and/or Tip/Acinar clusters (Figure 3E, Supplementary Table S5). Thus, while two-thirds of the genes associated with the top cluster marker regions accessible in MesothelialUpk3b-low cells are expressed in different subsets of pancreatic epithelial progenitors and/or differentiated cells, they exhibit accessibility at their promoter or potential nearby regulatory regions but are not expressed in Mesothelial cells (Figures 3E, F). This finding suggests that chromatin at a subset of Procr-like MesothelialUpk3b-low cells might be primed for activation, thus allowing eventual expression of genes associated with BP/ductal (e.g. Elf5, Adamts16, Bicc1) or EP/endocrine (Ncam1, Syt13, Runx1t1) lineage commitment (43, 48, 56–59), in agreement with the developmental trajectory inferred from our integrated scRNA-seq analysis (Figure 2E). The genes with accessible chromatin and expression consistently enriched in mesothelial cells included Igfbp4, previously associated with cell proliferation and IGF1 signaling (60).
Given the uncertainty in the association of distal regulatory regions to their regulated genes, the analysis presented above was restricted to accessible regions located within or nearby gene bodies, thus increasing the accuracy of the associations. As a complementary approach, we performed a de novo motif analysis on all high confidence (p adj.<0.005, average log2 fold change>1) MesothelialUpk3b-low cluster marker regions. The results revealed a significant enrichment for 28 DNA binding motifs. Interestingly, the top enriched sequence was a bHLH motif that matched with extremely high similarity (HOMER Score>0.9) to either Ptf1a, Twist2 or Ascl1, among others, suggesting that these regions could be bound by transcription factors that are expressed in pancreatic epithelial progenitors (Ptf1a), mesenchymal (Twist2) or neural-crest-derived/Schwann cells (Ascl1, Figure 3G). While neither of these factors is expressed in mesothelial cells from our integrated scRNA-seq analysis (Supplementary Figure 3F), we found that these cells expressed other suitable candidates whose recognition sequence also matched this bHLH motif with high affinity (e.g. Tcf3, Tcf12, Figure 3G, Supplementary Figure 3F). However, expression of these factors could be also detected in both pancreatic epithelial and mesenchymal cells (red and blue boxes in Supplementary Figure 3G). On the other hand, consistently with its potential activation, we found mild accessible chromatin enrichment at the Ptf1a promoter and some of its distal regulatory regions in MesothelialUpk3b-low cells (red boxes in Figure 3H). Of note, these regions present modest accessibility in progenitor cells (Duct/Acinar, Duct/BP), which is importantly increased in Acinar cells.
Other highly enriched motifs matched those recognized by Nfi (Nfix, Nfia, Nfib, Nfic), Tead and Rbpj transcription factors that, despite playing relevant roles in epithelial pancreatic progenitors (44, 61–63), are also expressed in mesenchymal/mesothelial cells (Figure 3G, Supplementary Figures 3F, G). Noteworthy, Nfib expression is selectively shared among mesothelial and BP/ductal cells, and it is downregulated in EP upon commitment to the endocrine lineage (Figure 3G). Conversely, Tead2 is expressed in mesothelial cells and selectively upregulated in BP/ductal cells, its expression peaks in EP cells to be then silenced from the Fev+ stage and on in endocrinogenesis (Figure 3G). We have previously shown that TEAD and YAP are key components of the enhancer network in pancreatic progenitors (62), and this signaling axis finely tunes progenitor cell commitment along the endocrine fate (64, 65). Tead motif enrichment in mesothelial cells is consistent with a progenitor role for these cells. Thus, Nfib and Tead2 transcription factors support the developmental trajectory inferred from out integrated scRNA-seq analysis between mesothelial and BP/ductal cells (Figure 2E).
Interestingly we found the Hand2 DNA recognition sequence enriched among the top scoring motifs, and the gene encoding for this TF is expressed in mesothelial cells of the embryonic pancreas (Figure 3G). Consistently with our analyses so far, Hand2, as well as most factors expressed in mesothelial cells, are also expressed in adult Procr+ progenitors of the original dataset (Supplementary Figure 3H). Hand2, in particular, is also expressed in pancreatic stellate and mesenchymal cells (Supplementary Figures 3G, H). Noteworthy, this factor has previously described functions in mesenchymal/mesothelial, neuronal and cardiac development (66).
Taken together, these results identified transcription factors with a shared expression profile supporting a mesothelial-ductal/BP lineage relationship, as well as other factors with genomic regulatory regions that could be primed for activation in Procr-like mesothelial cells.
3.4 Islet-like organoids differentiated in vitro from adult Procr+ progenitors mimic the transcriptional profile of the mesothelial and ductal/BP clusters in mouse pancreas developmentOur results suggest that the originally described adult Procr+ progenitors globally share its transcriptional profile with mesothelial cells. This includes the expression of genes coding for transcription factors (e.g. Sox4, Sox11, Nfib, Tead2, Rbpj) and other regulators (e.g. Bicc1, Spp1, Runx1t1) that play important roles in epithelial pancreatic progenitors (Figures 2F, 3F, G). Additionally, a subset of these present accessible chromatin at genes coding for transcription factors with crucial roles in epithelial pancreatic progenitors (e.g. Ptf1a, Pdx1, Figure 3H, Supplementary Figure 3C). These findings, combined with a developmental trajectory analysis inferred from the scRNA-seq data (Figure 2E), suggest that adult Procr+ progenitors could engage in endocrinogenesis through a ductal/BP intermediate stage. To further explore this possibility, we interrogated the global expression profile of adult Procr+ progenitors co-cultured in vitro with endothelial cells and differentiated into islet-like organoids, which contained functional β-cells after 28 days of culture (scRNA-seq data kindly provided by the authors) (22).
The original report identified six intermediate organoid stages (Org.1-6) between Procr+ progenitors and β-cells (22). For our downstream analyses, we merged organoid stages 1 and 2 (Org. 1-2), and stages 3 to 5 (Org.3-5), due to their closely related global transcriptional profiles (Figures 4A, B). We initially evaluated the expression of a selected gene subset previously reported to be sequentially activated upon Procr+ progenitor commitment to the β-cell lineage (Figure 4C, top dotplot). Notably, most of the transitional genes that were switched off in Procr+ progenitors and activated in the Org1-2 and Org3-5 intermediate stages were also highly and selectively expressed in Ductal and BP cells of the mouse embryonic pancreas (Figure 4C, bottom dotplot and red box). Supporting their priming for activation, several of these genes displayed accessible profiles (summarized as gene activity scores) in mesothelial cells of the E17.5 mouse embryonic pancreas (Supplementary Figures 4A, B). Additionally, supporting their link between MesothelialUpk3b-high and ductal/BP cells, MesothelialUpk3b-low cells exhibited increased gene activity scores for most of these genes.
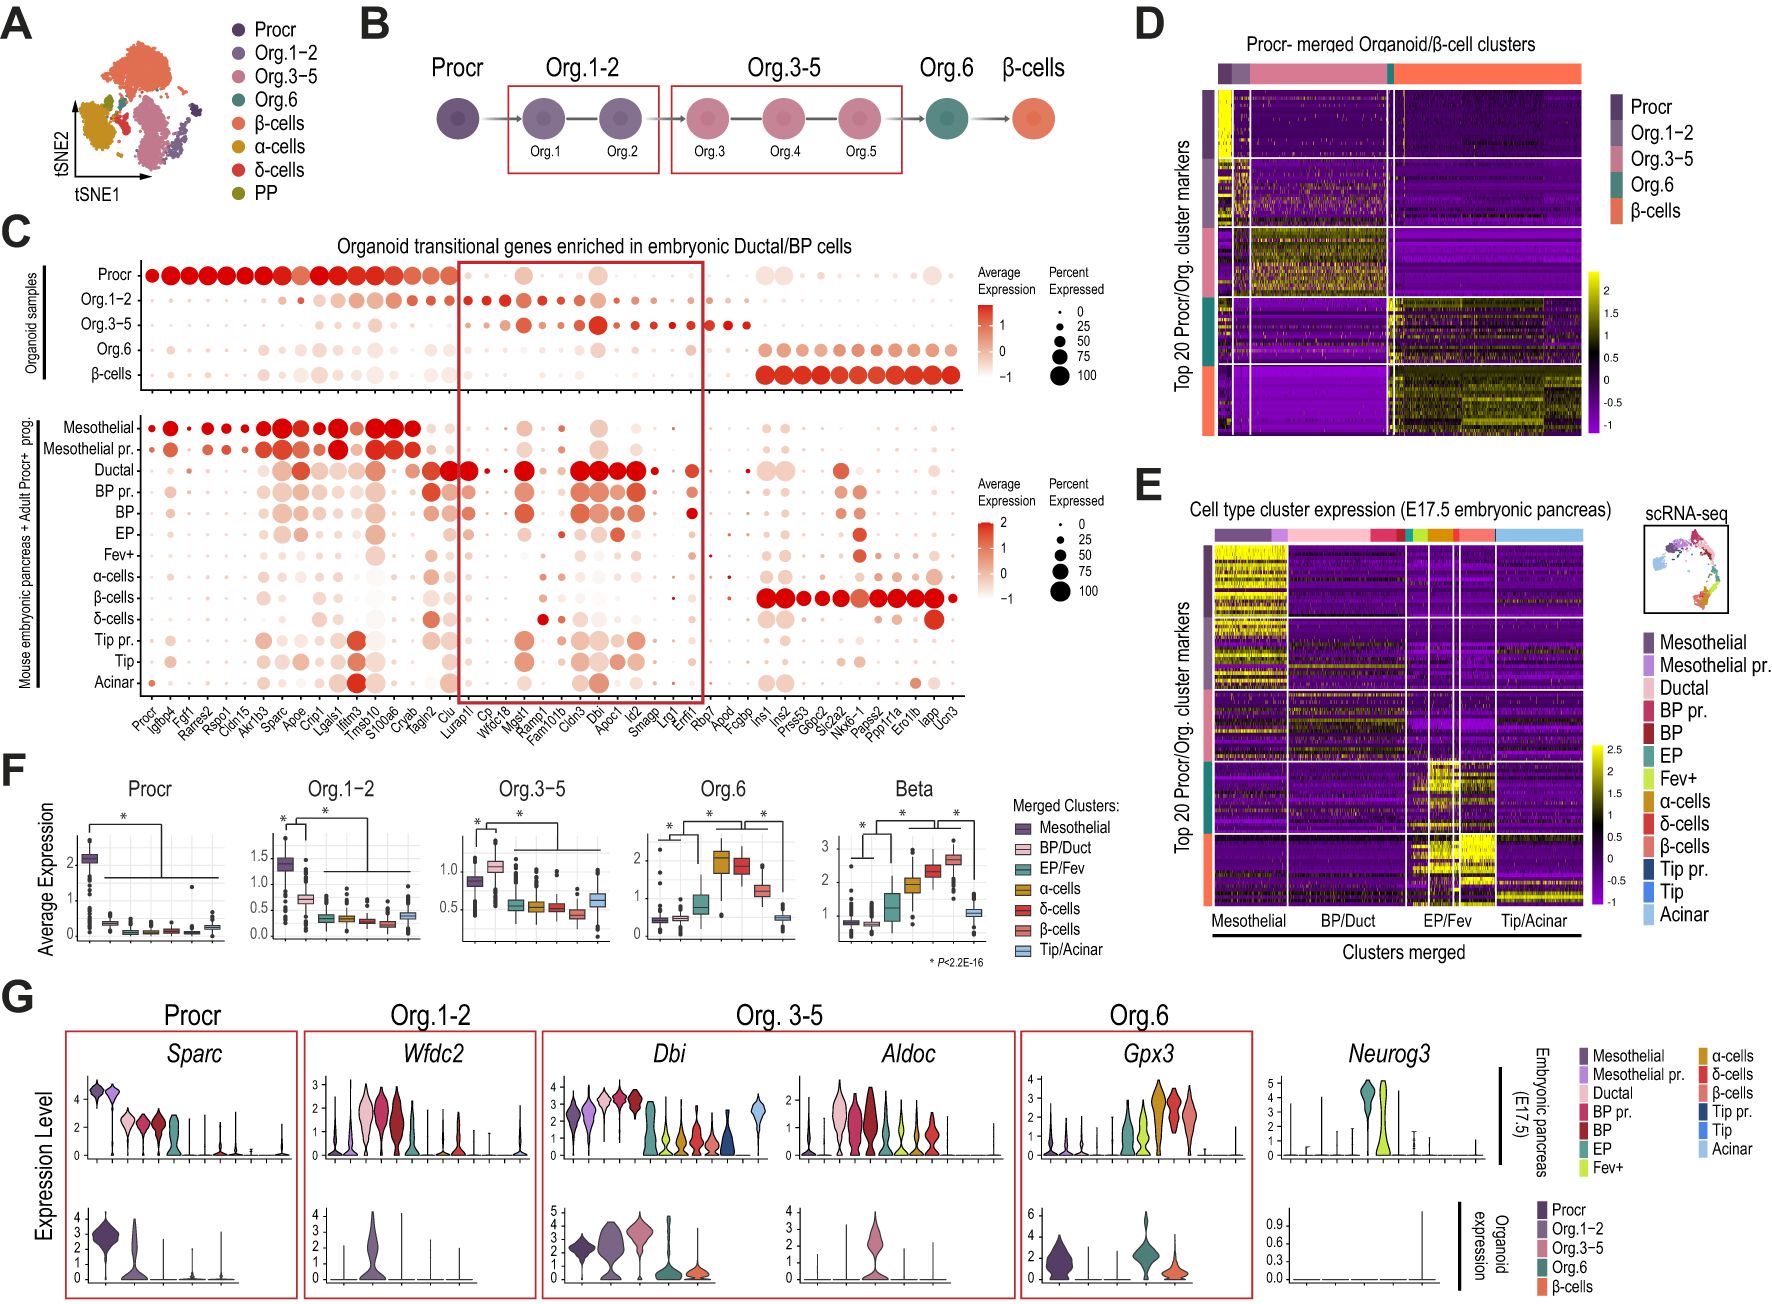
Figure 4. Islet-like organoids differentiated in vitro from adult Procr+ progenitors mimic the transcriptional profile of the mesothelial and ductal/BP clusters in mouse pancreas development. (A) tSNE plot of organoid single-cell transcriptomes differentiated in vitro as originally described (22). (B) Schematic depicting organoid sample merging for downstream analyses. (C) Dot plots showing the expression of a selected gene subset previously reported to be sequentially activated upon Procr+ progenitor commitment to the β-cell lineage. Gene expression is shown for cell clusters of the organoid dataset (top), and the pancreatic epithelial and mesothelial cells of the mouse embryonic pancreas (bottom) as clustered in Figure 2A. (D) Heatmap showing the scaled gene expression values for the top 20 cluster marker genes recovered from the Procr organoid analysis. Gene expression data corresponding to Procr, organoid stages and β-cells from the organoid dataset clustered as in (A). (E) Heatmap showing the scaled gene expression values for the top 20 cluster marker genes recovered from the Procr organoid analysis (same subset as in D). Gene expression data corresponding to pancreatic epithelial and mesothelial cells of the E17.5 mouse embryonic pancreas clustered as in Figure 3A. (F) Boxplots depicting the average expression for the top 20 organoid cluster markers in cells of the E17.5 mouse embryonic pancreas, clustered and labeled as in Figure 3A. Based on the shared expression patterns in this analysis, cell clusters were further merged into broader categories as indicated in (E) and described next: Mesothelial (including Mesothelial and Mesothelial pr. cells), Duct/BP (Ductal, BP, and BP pr.), EP/Fev (EP and Fev+ cells) and Tip/acinar (Tip, Tip pr. and acinar cells). The P-value was calculated with the Wilcoxon rank-sum test. (G) Violin plots depicting the expression of selected Procr, Org. 1-2, Org. 3-5 and Org. 6 top marker genes for the pancreatic epithelial and mesothelial cells of the E17.5 mouse embryonic pancreas (top), clustered as in Figure 3A, and for the different Procr, organoid and β-cell stages (bottom) clustered from the organoid dataset as in (A).
To further extend these findings, we next focused the analysis on the initial timepoint of the previously reported in vitro differentiation protocol (day 7), which contained the largest number of intermediate organoid stages, as well as a small fraction of endocrine cells (22). As expected, the top 20 cluster marker genes for each organoid stage revealed a highly selective expression pattern (Figure 4D). Thus, we defined sets of 20 genes that were highly enriched in Procr+ progenitors, Org.1-2, Org. 3-5, Org.6 and β-cells. Globally, these genes displayed a transitional expression pattern among consecutive stages. We next examined whether these set of genes were expressed in the pancreatic progenitor and differentiated cell clusters identified in our previous analysis for the E17.5 mouse embryonic pancreas, the stage at which we detected mesothelial cells with the transcriptional profile most closely resembling adult Procr+ progenitors. As expected, Procr+ markers from the organoid study were expressed at higher levels in Mesothelial and Mesothelial pr. clusters profiled from the E17.5 pancreas (Figure 4E). Strikingly, Org. 1-2, Org. 3-5 and Org. 6 cluster markers exhibited a decreasing expression pattern, on average, in mesothelial clusters, and a gradually increasing expression pattern sequentially in BP and ductal (BP/Duct) cells, EP and Fev+ (EP/Fev), α-, δ- and β-cell clusters of the embryonic pancreas (Figures 4E, F). Illustrative examples following this transitional trend include: 1) Sparc, an adult Procr+ progenitor marker that is highly expressed in mesothelial cells of the mouse embryonic pancreas, gradually downregulated in ductal, BP, EP, and finally silenced in Fev+ and endocrine cells; 2) Wfdc2 and Dbi, Org. 1-2 and Org. 3-5 markers that are upregulated in ductal/BP and EP cells; and 3) Gpx3, an Org. 6 marker that is upregulated in Fev+ cells and expressed at higher levels in α-, δ- and β-cells (Figure 4G).
Collectively, these findings suggest that in vitro differentiation of adult Procr+ progenitors (co-cultured with endothelial cells as described previously) (22) recapitulates a transcriptional pattern that mimics the sequential activation of at least some BP/ductal lineage enriched genes, whose downregulation is followed by expression of EP/Fev, α and δ cell markers, and finally β-cell genes in cells of the mouse embryonic pancreas. These genes, however, do not include Neurog3 (Figure 4G).
3.5 Procr-like mesothelial cells are also identified in the human embryonic pancreasWe have previously reported that a Procr-like subpopulation was spontaneously specified from human induced pluripotent stem cells (iPSCs) differentiated in vitro to pancreatic progenitor cells (67). To gain further insights into whether mesothelial cells with a Procr-like transcriptional profile, as identified in the mouse embryonic pancreas, have counterparts in the developing human organ, we integrated the mouse datasets used in the analyses described above with recently reported scRNA-seq data from the 4 to 11 weeks post-conception human pancreas (W4–11) (Supplementary Figure 5A, C) (68). An initial analysis on the human samples, grouped by stages W4-6 and W7-11 as originally reported, identified mesenchymal (COL3A1+), endothelial (PECAM1+), immune (RAC2+), erythrocytes (HBA1+), neural crest-derived/Schwann cells (SOX10+), pancreatic epithelial cells (EPCAM+; red boxes in Supplementary Figure 5B, D) as well as mesothelial cell clusters with Procr-like expression profile in both groups of samples (PROCR+, UPK3B+, IGFBP5+; purple boxes in Supplementary Figure 5B, D). We also found cells with a transcriptional profile corresponding to liver progenitors (AFP+) in the human embryonic datasets, as described (68).
We next integrated the pancreatic epithelial cells and those clusters matching the Procr+ progenitor transcriptional signature from the embryonic mouse and human pancreas datasets to interrogate in more detail their potential lineage relationship. This analysis allowed discriminating the same cell subpopulations described above for the mous
留言 (0)