
記住我
Adolescence marks a critical window of physical development, during which dramatic changes in body composition and muscular capabilities occur (1). During this period, various physiological factors orchestrate musculoskeletal development, with serum uric acid (sUA) emerging as an intriguing yet understudied mediator (2). While traditionally linked to metabolic disorders, mounting evidence suggests that uric acid may play broader roles in human physiology, particularly in body composition regulation and muscle function (3, 4).
As the predominant antioxidant in human serum, uric acid accounts for approximately 60% of free radical scavenging activity (5). This property could theoretically protect muscle tissue and influence its development (6). Moreover, sUA interacts with key metabolic pathways affecting insulin sensitivity and glucose homeostasis, potentially impacting both muscle and fat tissue dynamics (7, 8). However, the relationship between sUA and body composition parameters in adolescents remains unclear - a significant concern given rising rates of youth obesity and hyperuricemia (9, 10).
Evidence linking sUA to muscle mass and strength has been inconsistent. Some studies report positive associations (11–13), while others show no protective effects (14, 15). These contradictions underscore the need to better understand sUA’s role during adolescent development. Despite extensive research on traditional factors like exercise and nutrition in adolescent musculoskeletal health, sUA’s influence during this critical period remains largely unexplored.
To address this knowledge gap, we sought to elucidate the relationships between sUA and key indicators of musculoskeletal health and body composition in adolescents aged 12-19 years. Leveraging a large sample from the National Health and Nutrition Examination Survey (NHANES), we conducted a comprehensive analysis of the correlations of sUA with appendicular lean mass index (ALMI), appendicular fat mass index (AFMI), and grip strength.
MethodsStudy design and populationWe conducted a cross-sectional analysis of data from NHANES 2011-2014 cycles. NHANES, administered biennially by the National Center for Health Statistics (NCHS), provides comprehensive health and nutritional data on the U.S. population. The study protocol was approved by the NCHS Research Ethics Review Board, and all participants or their legal guardians provided written informed consent.
Our initial sample comprised 2,705 adolescents aged 12-19 years. After excluding individuals with incomplete sUA data (n=393), ALMI and AFMI measurements (n=265), and combined grip strength assessments (n=44), the final analytical sample consisted of 2,003 subjects.
Exposure and outcome variablesThe exposure variable was sUA, which was measured using the Beckman Coulter UniCel® DxC800 system during the 2011-2014 survey cycles. The outcome variables included ALMI, AFMI, and combined grip strength. ALMI and AFMI were derived from dual-energy X-ray absorptiometry (DXA) scans performed using a Hologic QDR-4500A fan-beam densitometer (Hologic, Inc., Bedford, MA). These indices were calculated as appendicular lean/fat mass [kg] divided by height squared [m²]. Grip strength was assessed using a Takei Digital gripper force gauge (model T.K.K.5401), following a standardized protocol. Our analysis utilized the combined grip strength, representing the sum of the largest reading from each hand.
Confounding variablesWe identified potential confounders based on clinical insights and prior research (12, 16, 17): age (12-15 and 16-19 years), sex, race/ethnicity, family income-to-poverty ratio, moderate activity, body mass index (BMI), nutritional parameters (dietary protein, vitamin D, calcium intake), and serum markers (blood urea nitrogen, total protein, serum calcium). Moderate activity was assessed through self-reported moderate-intensity activities, and dietary intakes were obtained from two 24-hour dietary recall interviews.
Statistical analysesWe stratified subjects by age and sex groups, presenting baseline characteristics as means ± standard deviations for continuous variables and percentages for categorical variables. Inter-group differences were assessed using appropriate statistical tests: χ² for categorical variables, one-way ANOVA for normally distributed continuous variables, and Kruskal-Wallis H tests for skewed distributions.
To evaluate associations between sUA and ALMI, AFMI, and grip strength, we employed multivariate linear regression models. Following STROBE statement recommendations (18), we constructed three models: unadjusted, partially adjusted (for age, sex, and race), and fully adjusted (for all screened covariates). Subgroup analyses stratified by age, sex, and race/ethnicity were further performed using stratified linear regression models to explore potential effect modifications, with interaction terms tested using likelihood ratio tests.
To explore and confirm potential non-linear associations, we employed smooth curve fitting techniques and generalized additive models, allowing for the detection of nuanced relationships that might not be captured by linear models alone.
All statistical analyses were conducted using R software (version 3.4.3) and EmpowerStats (X&Y Solutions, Inc., Boston, MA). Statistical significance was set at P < 0.05 (two-sided).
ResultsDemographic and clinical characteristicsThe characteristics of 2,003 adolescents aged 12-19 years stratified by age and sex are presented in Table 1. Significant inter-group variations were observed in race/ethnicity distribution and engagement in moderate activities. Older adolescents exhibited higher BMI, while boys demonstrated greater dietary intakes compared to girls. Serum biomarkers showed significant variations among groups. Notably, boys displayed higher ALMI and combined grip strength (both P < 0.001), whereas girls had higher AFMI (P < 0.001).
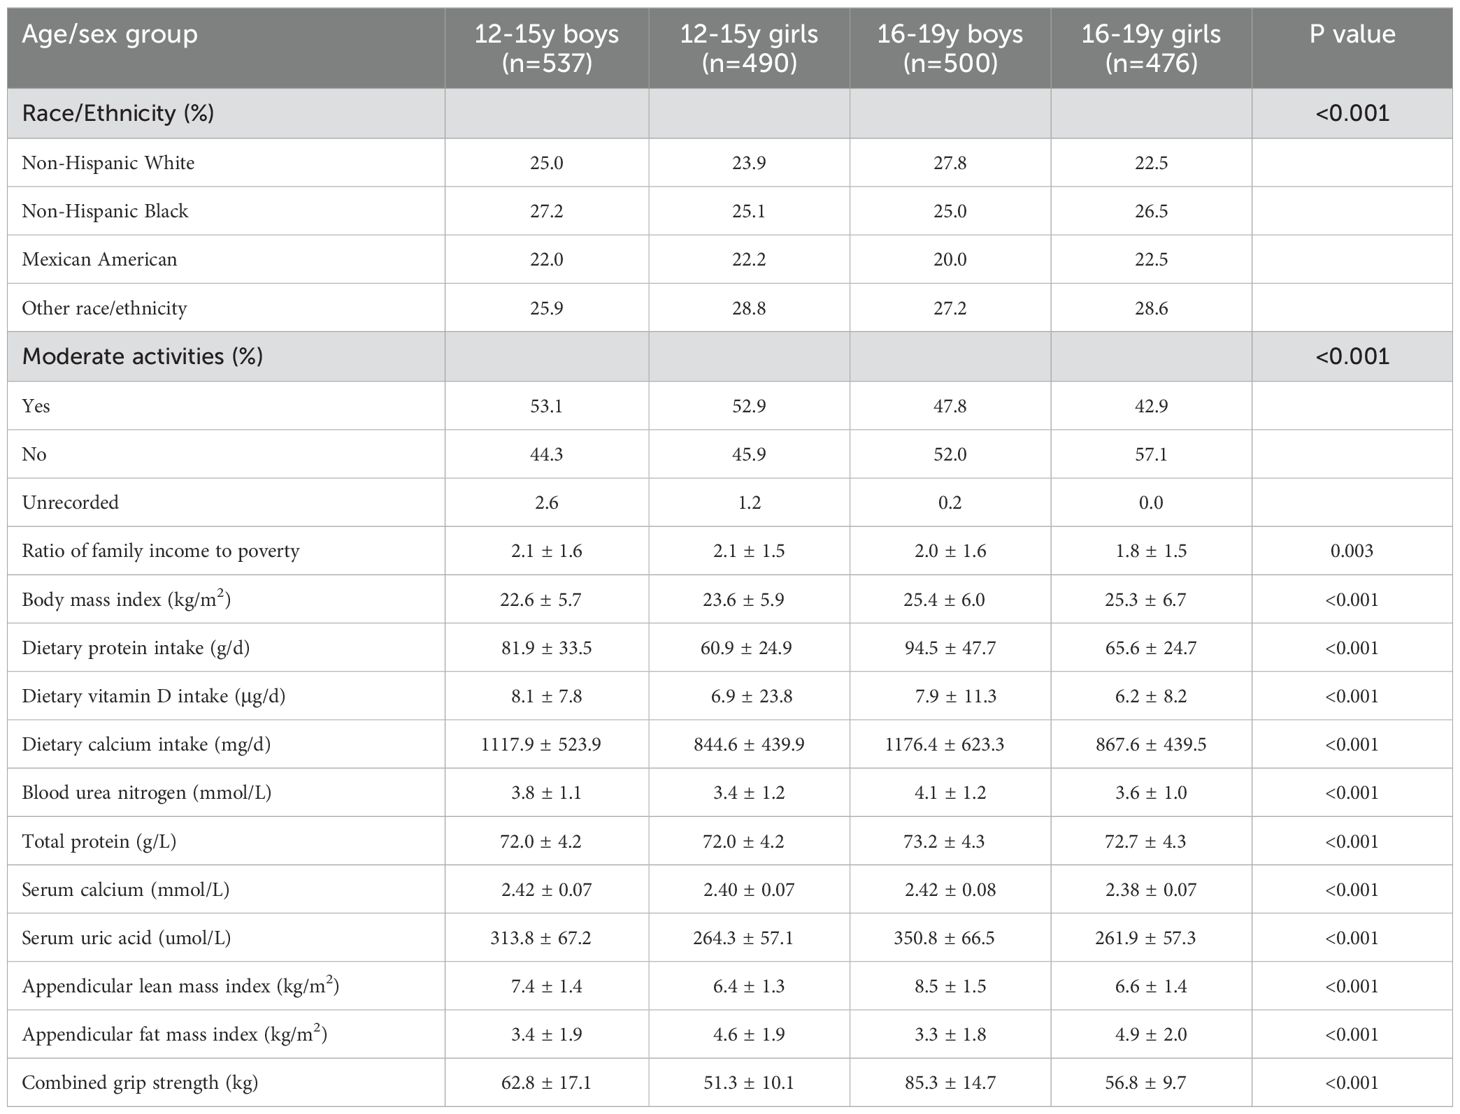
Table 1. Characteristics of study population based on age and sex group.
Correlations of sUA with ALMI, AFMI, and combined grip strengthMultivariate regression analyses revealed complex relationships between sUA and musculoskeletal health and body composition parameters (Table 2). SUA demonstrated a robust positive association with ALMI across all models (β = 0.002, 95% CI: 0.001-0.002, P < 0.001 in fully adjusted model). For AFMI, initial positive associations in minimally adjusted models shifted to a negative association in the fully adjusted model (β = -0.002, 95% CI: -0.003 to -0.002, P < 0.001). Combined grip strength exhibited a consistent positive association with sUA (β = 0.035, 95% CI: 0.025-0.045, P < 0.001 in fully adjusted model). Comparing the highest (Q4) to lowest (Q1) quartile of sUA revealed significant increases in ALMI and combined grip strength, with a concomitant decrease in AFMI in the fully adjusted model (all P for trend < 0.001).
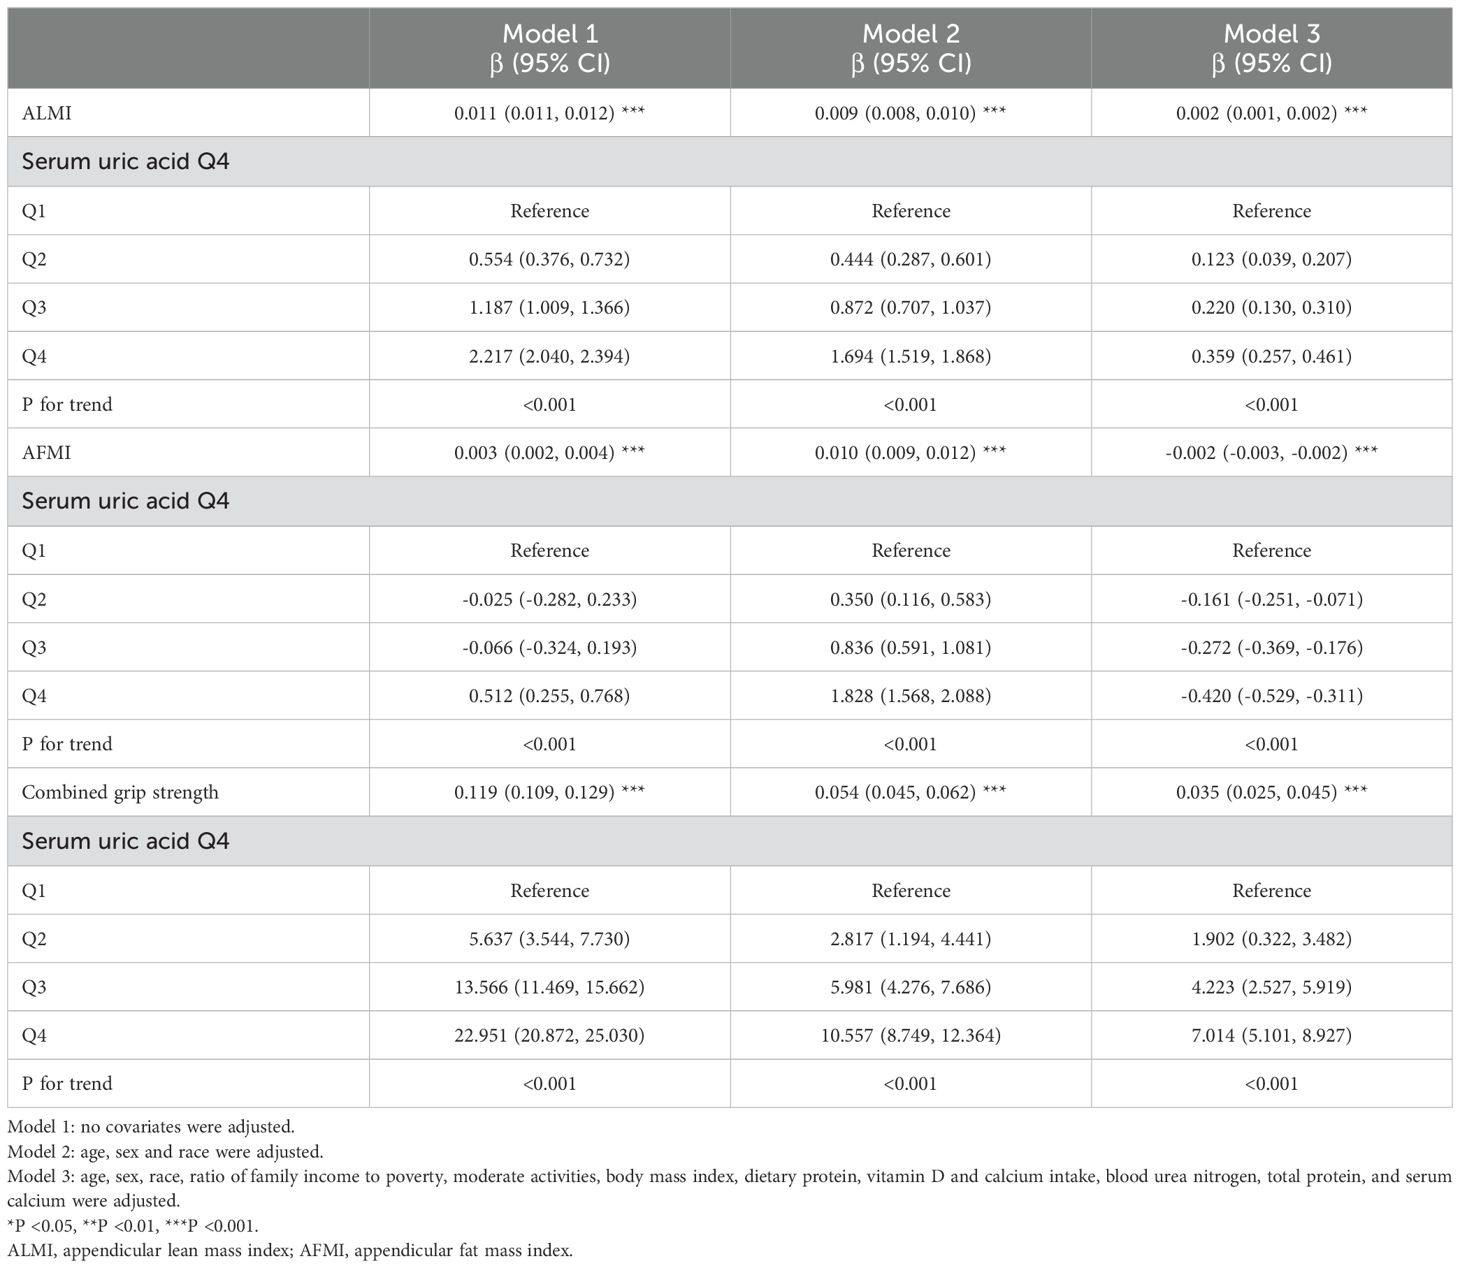
Table 2. Association of serum uric acid (umol/L) with ALMI (kg/m2), AFMI (kg/m2), and combined grip strength (kg).
Non-linear relationships and subgroup analysesFigure 1 illustrates the relationships between sUA and musculoskeletal health and body composition parameters in adolescents. Positive, non-linear relationships were observed between sUA, ALMI, and combined grip strength, while a negative association was evident with AFMI.
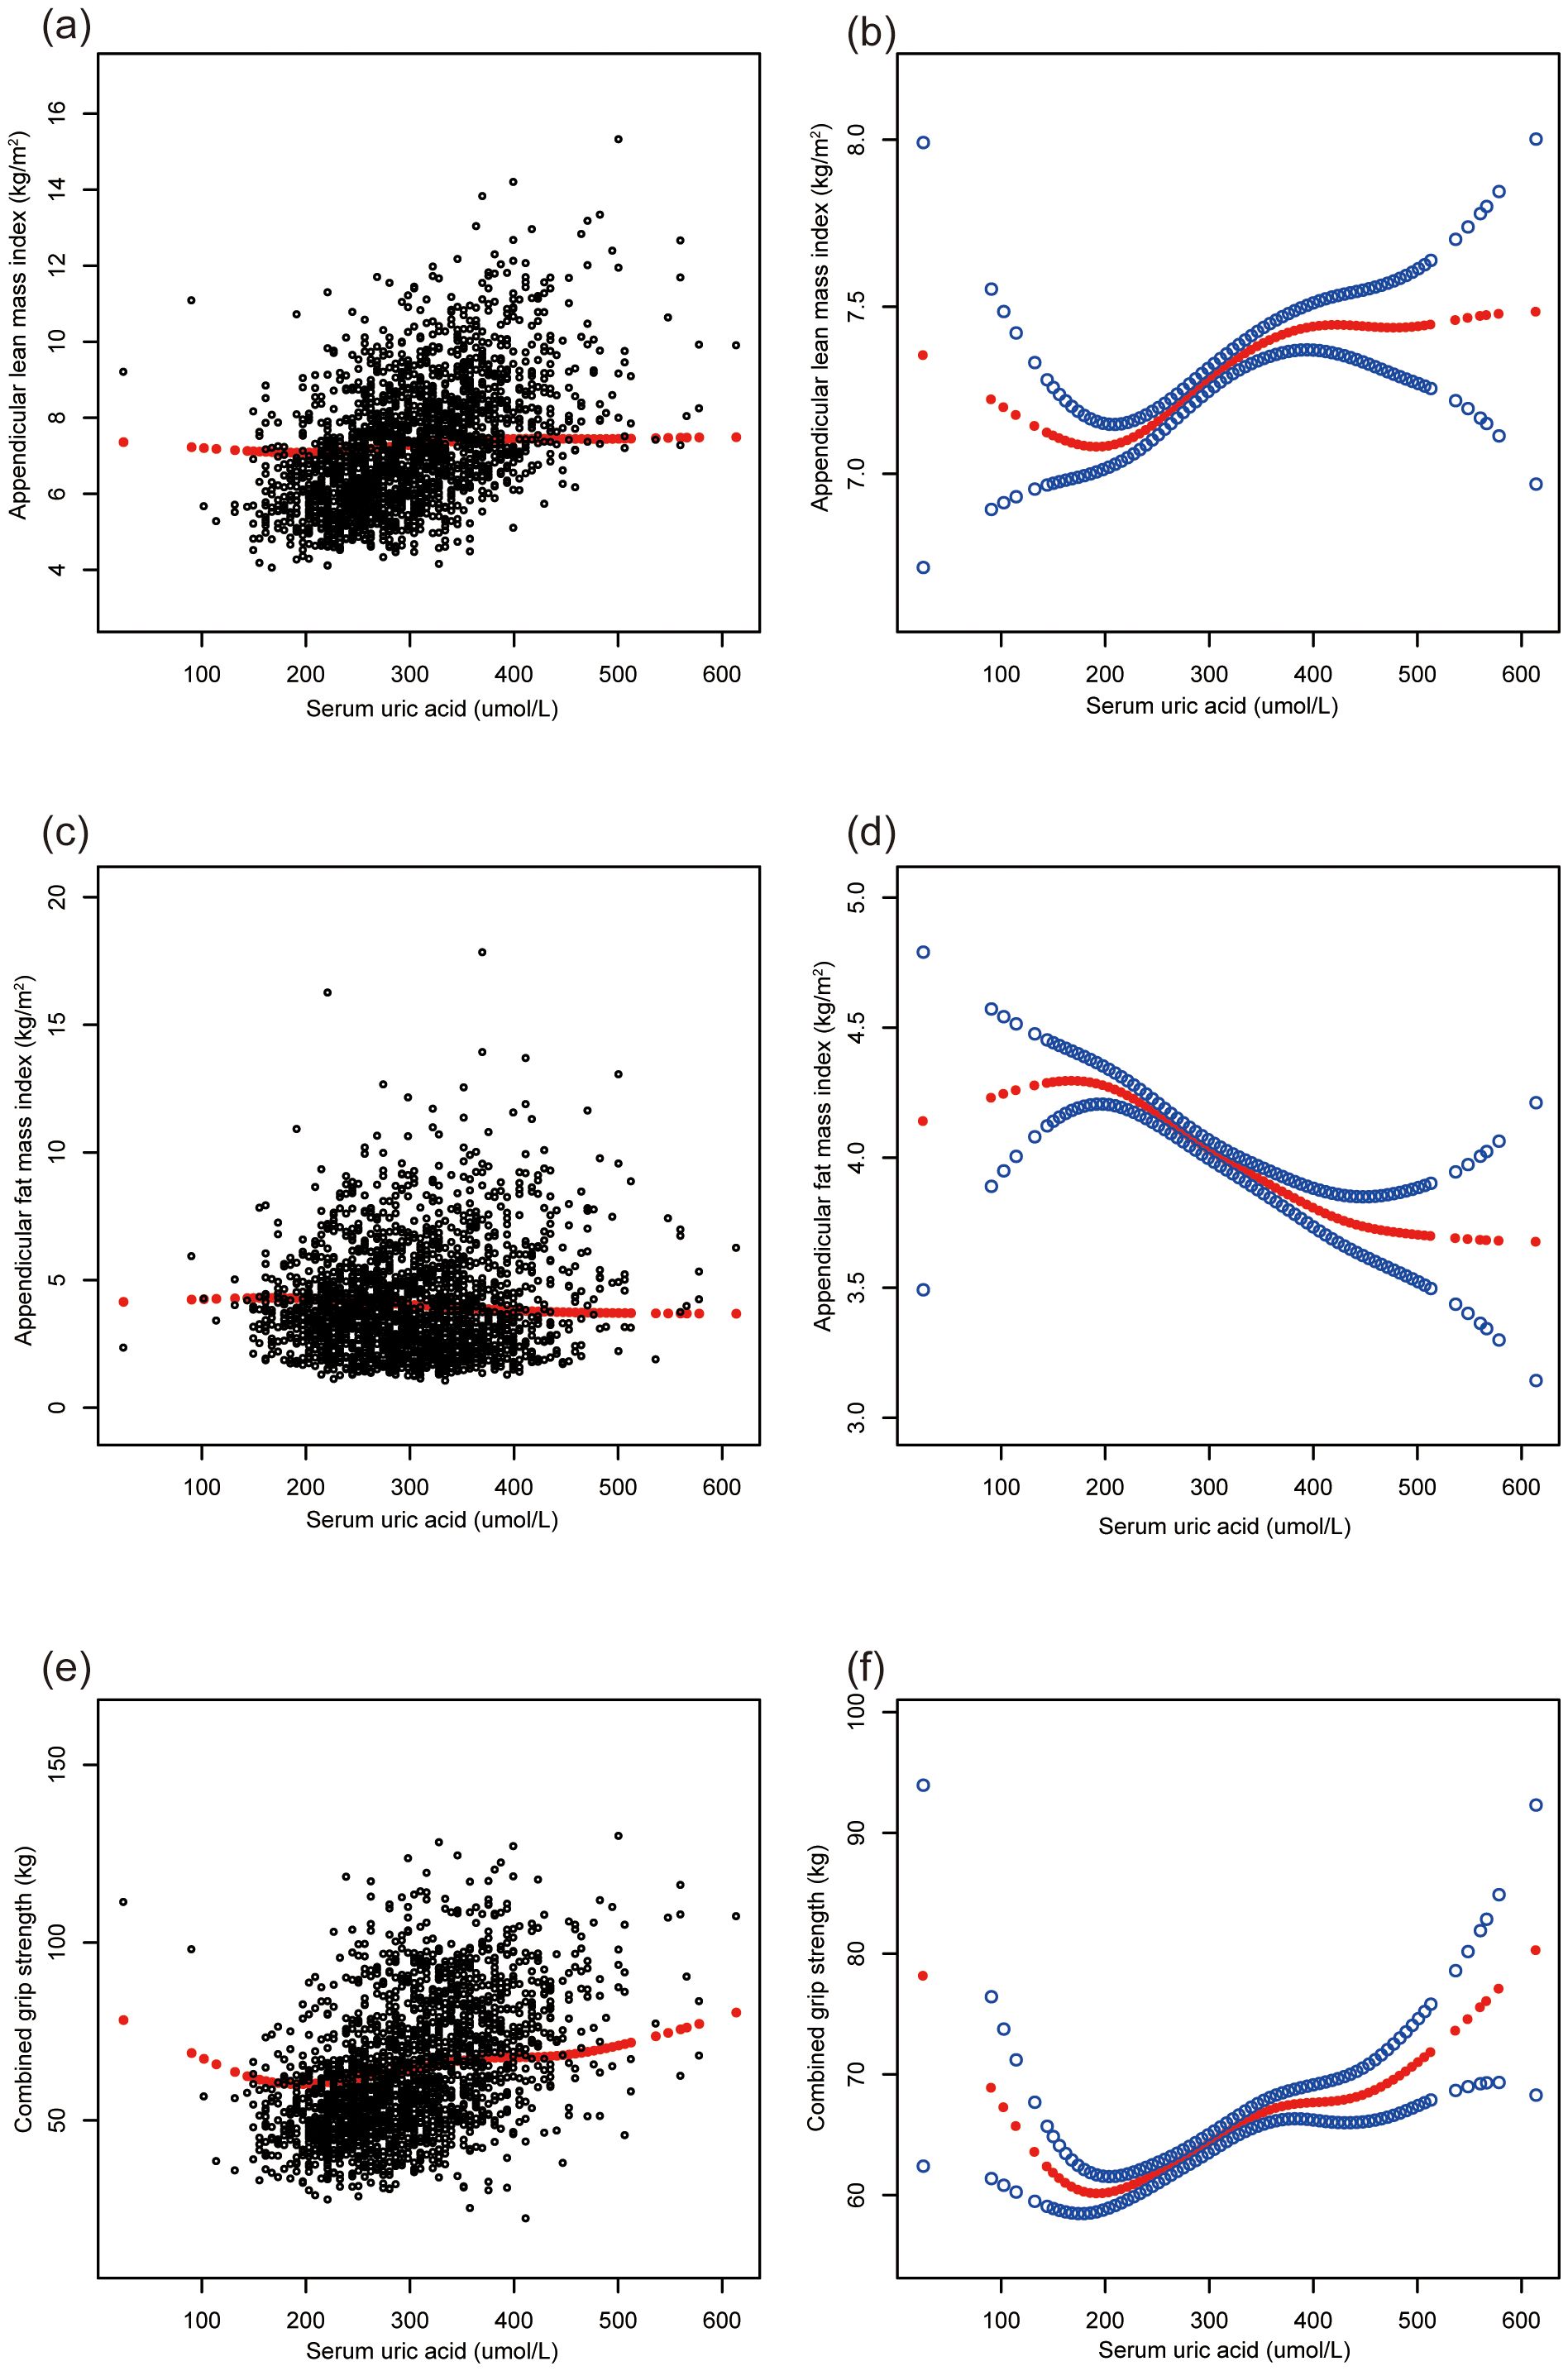
Figure 1. The association of serum uric acid with ALMI, AFMI and combined grip strength. (A, B) ALMI; (C, D) AFMI; (E, F) combined grip strength. ALMI, appendicular lean mass index; AFMI, appendicular fat mass index. Age, sex, race, ratio of family income to poverty, moderate activities, body mass index, dietary protein, vitamin D and calcium intake, blood urea nitrogen, total protein, and serum calcium were adjusted.
Subgroup analyses (Table 3) uncovered heterogeneous associations across age, sex, and race/ethnicity groups. ALMI showed positive associations in 12-15y boys, non-Hispanic White, and non-Hispanic Black groups. AFMI demonstrated negative associations in 12-15y boys, 16-19y girls, and all race/ethnicity groups. Combined grip strength showed positive associations in 12-15y boys, non-Hispanic White, and non-Hispanic Black groups.
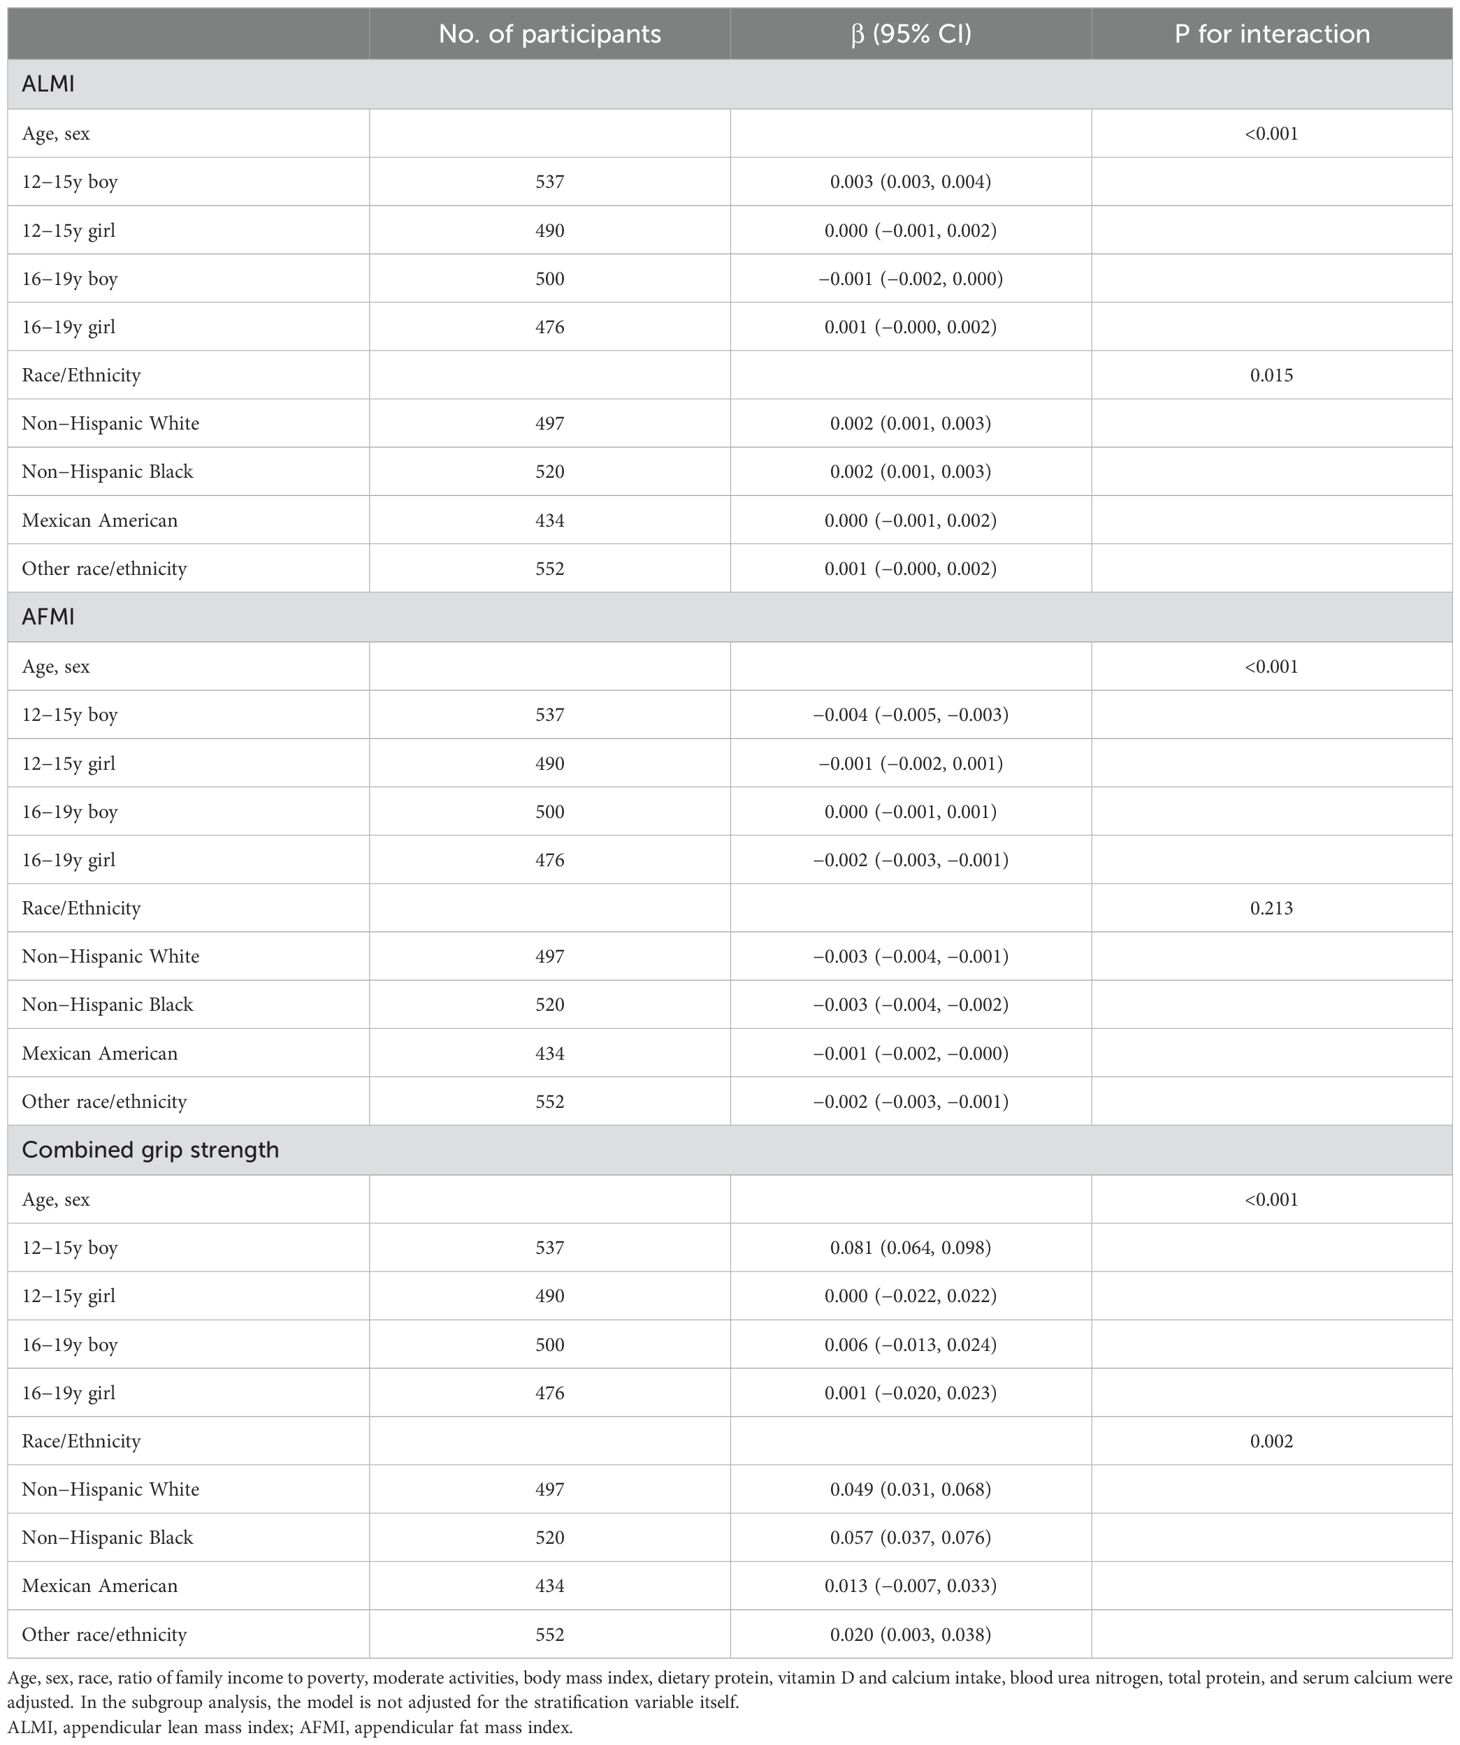
Table 3. Subgroup analysis of the associations between serum uric acid (umol/L), ALMI (kg/m2), AFMI (kg/m2) and combined grip strength (kg).
Smooth curve fittings (Figures 2, 3) further corroborated these stratified associations between sUA and body composition parameters, elucidating complex, non-linear relationships.
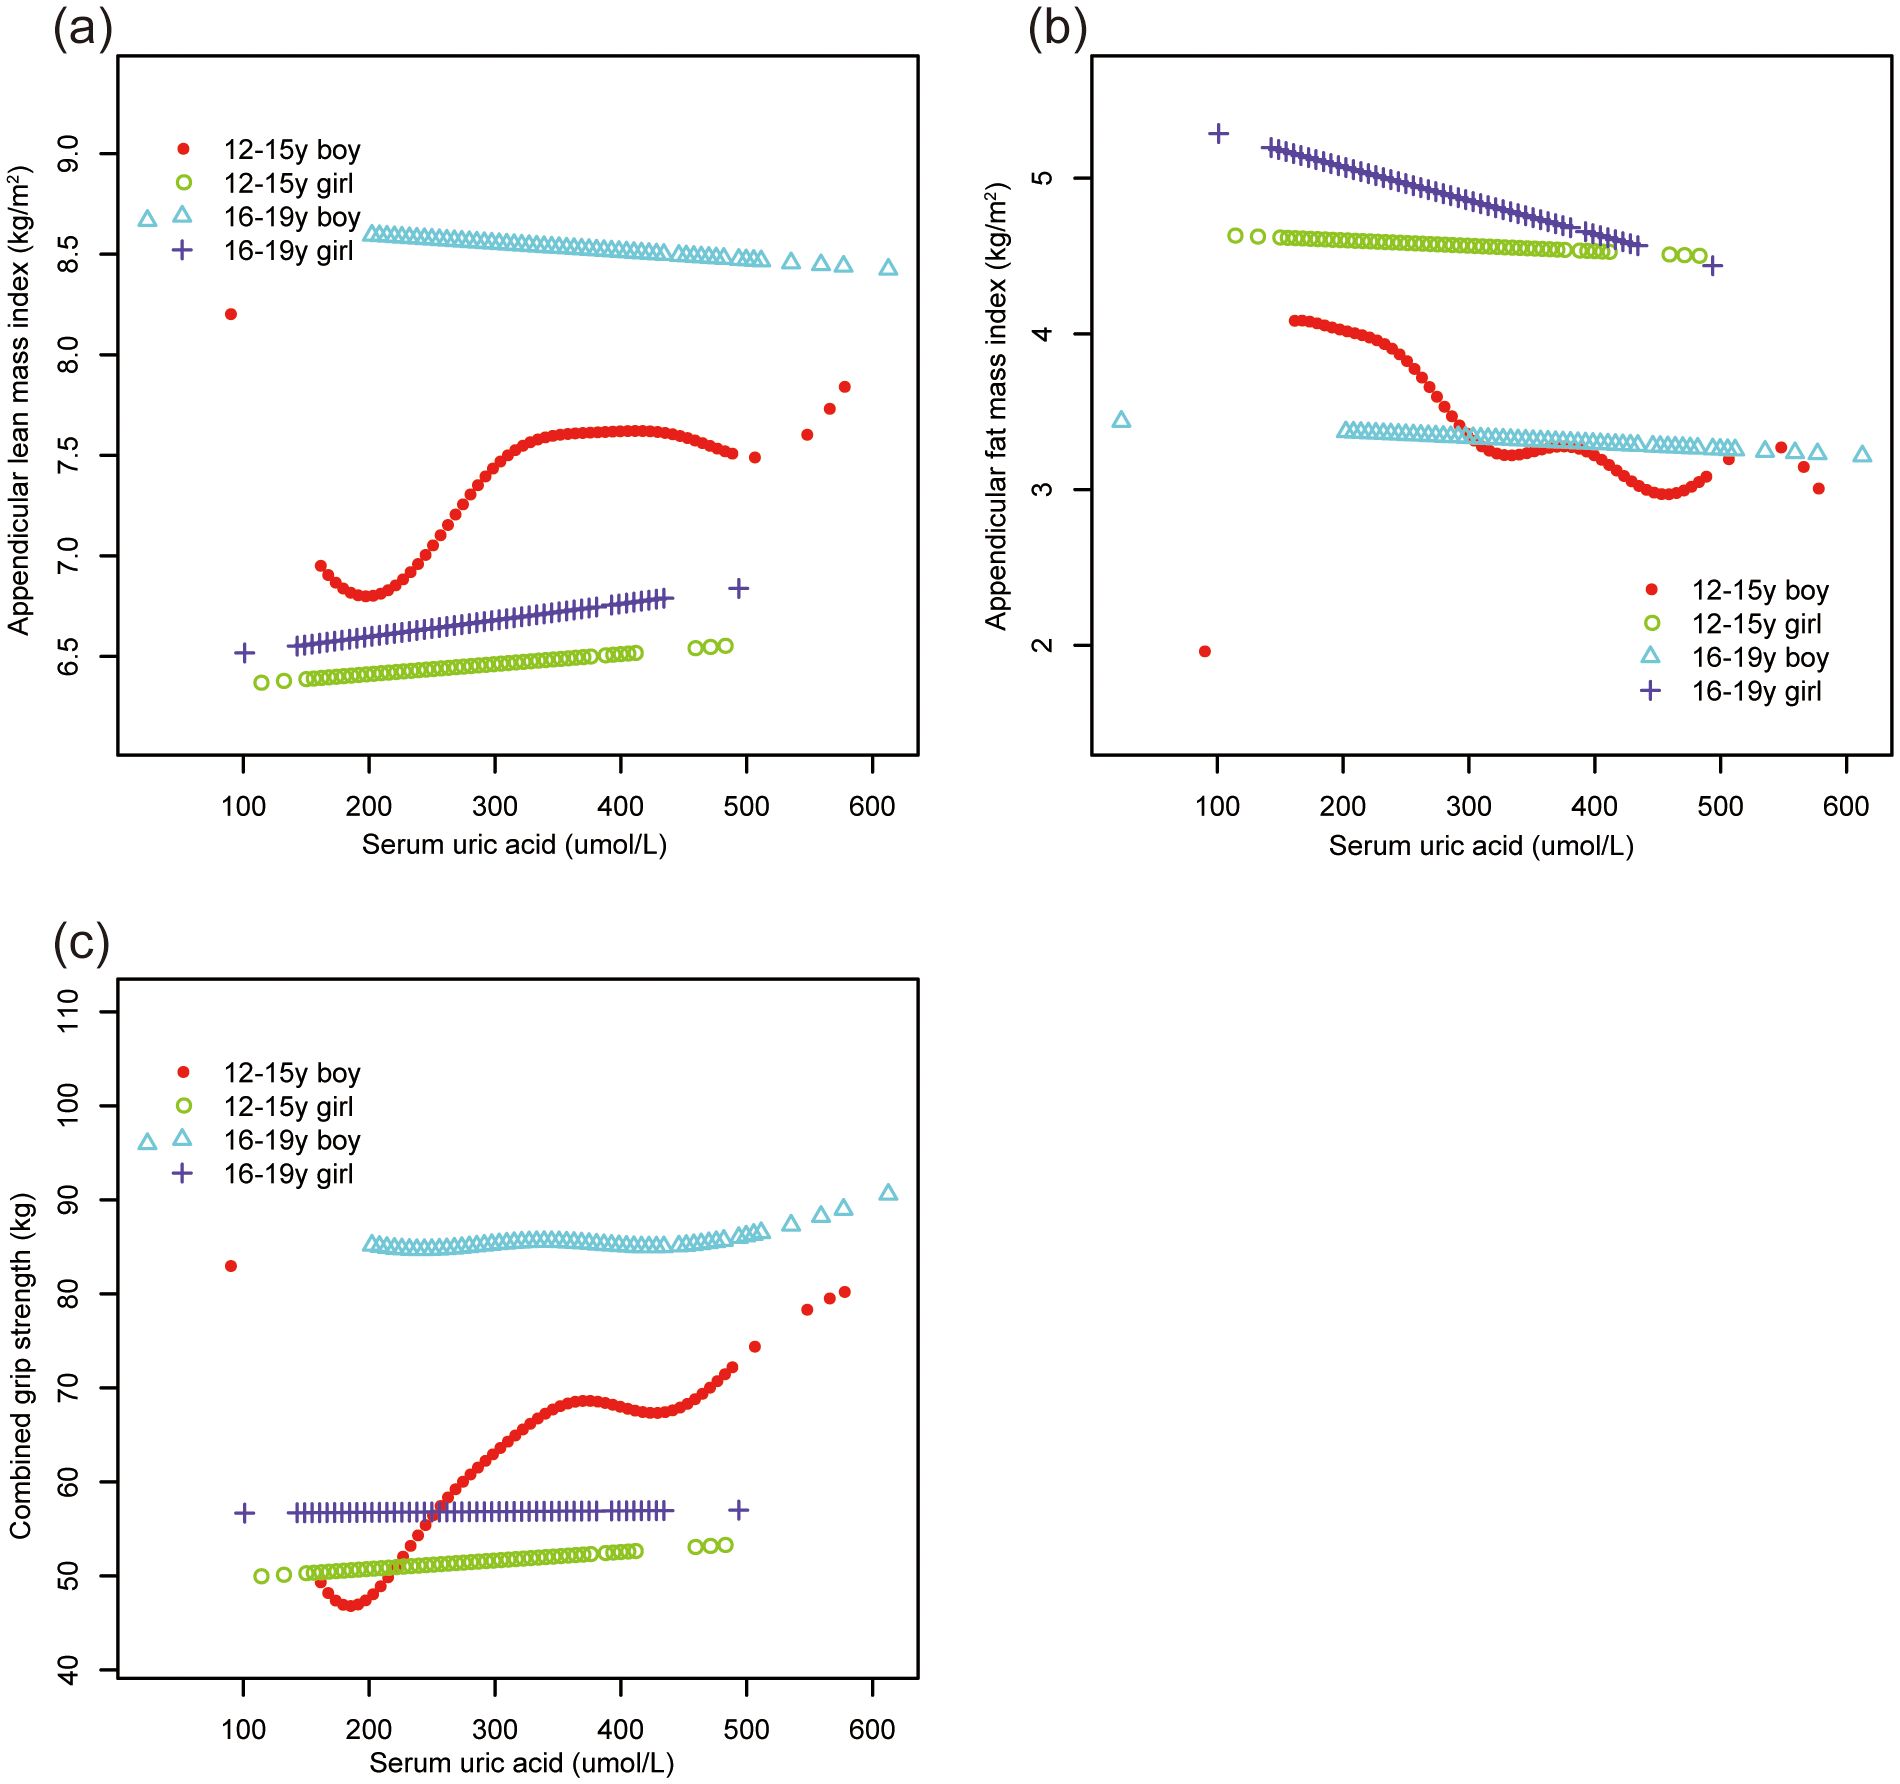
Figure 2. The association of serum uric acid with ALMI, AFMI and combined grip strength, stratified by age/sex. (A) ALMI; (B) AFMI; (C) combined grip strength. ALMI, appendicular lean mass index; AFMI, appendicular fat mass index. Race, ratio of family income to poverty, moderate activities, body mass index, vitamin D intake and calcium intake were adjusted.
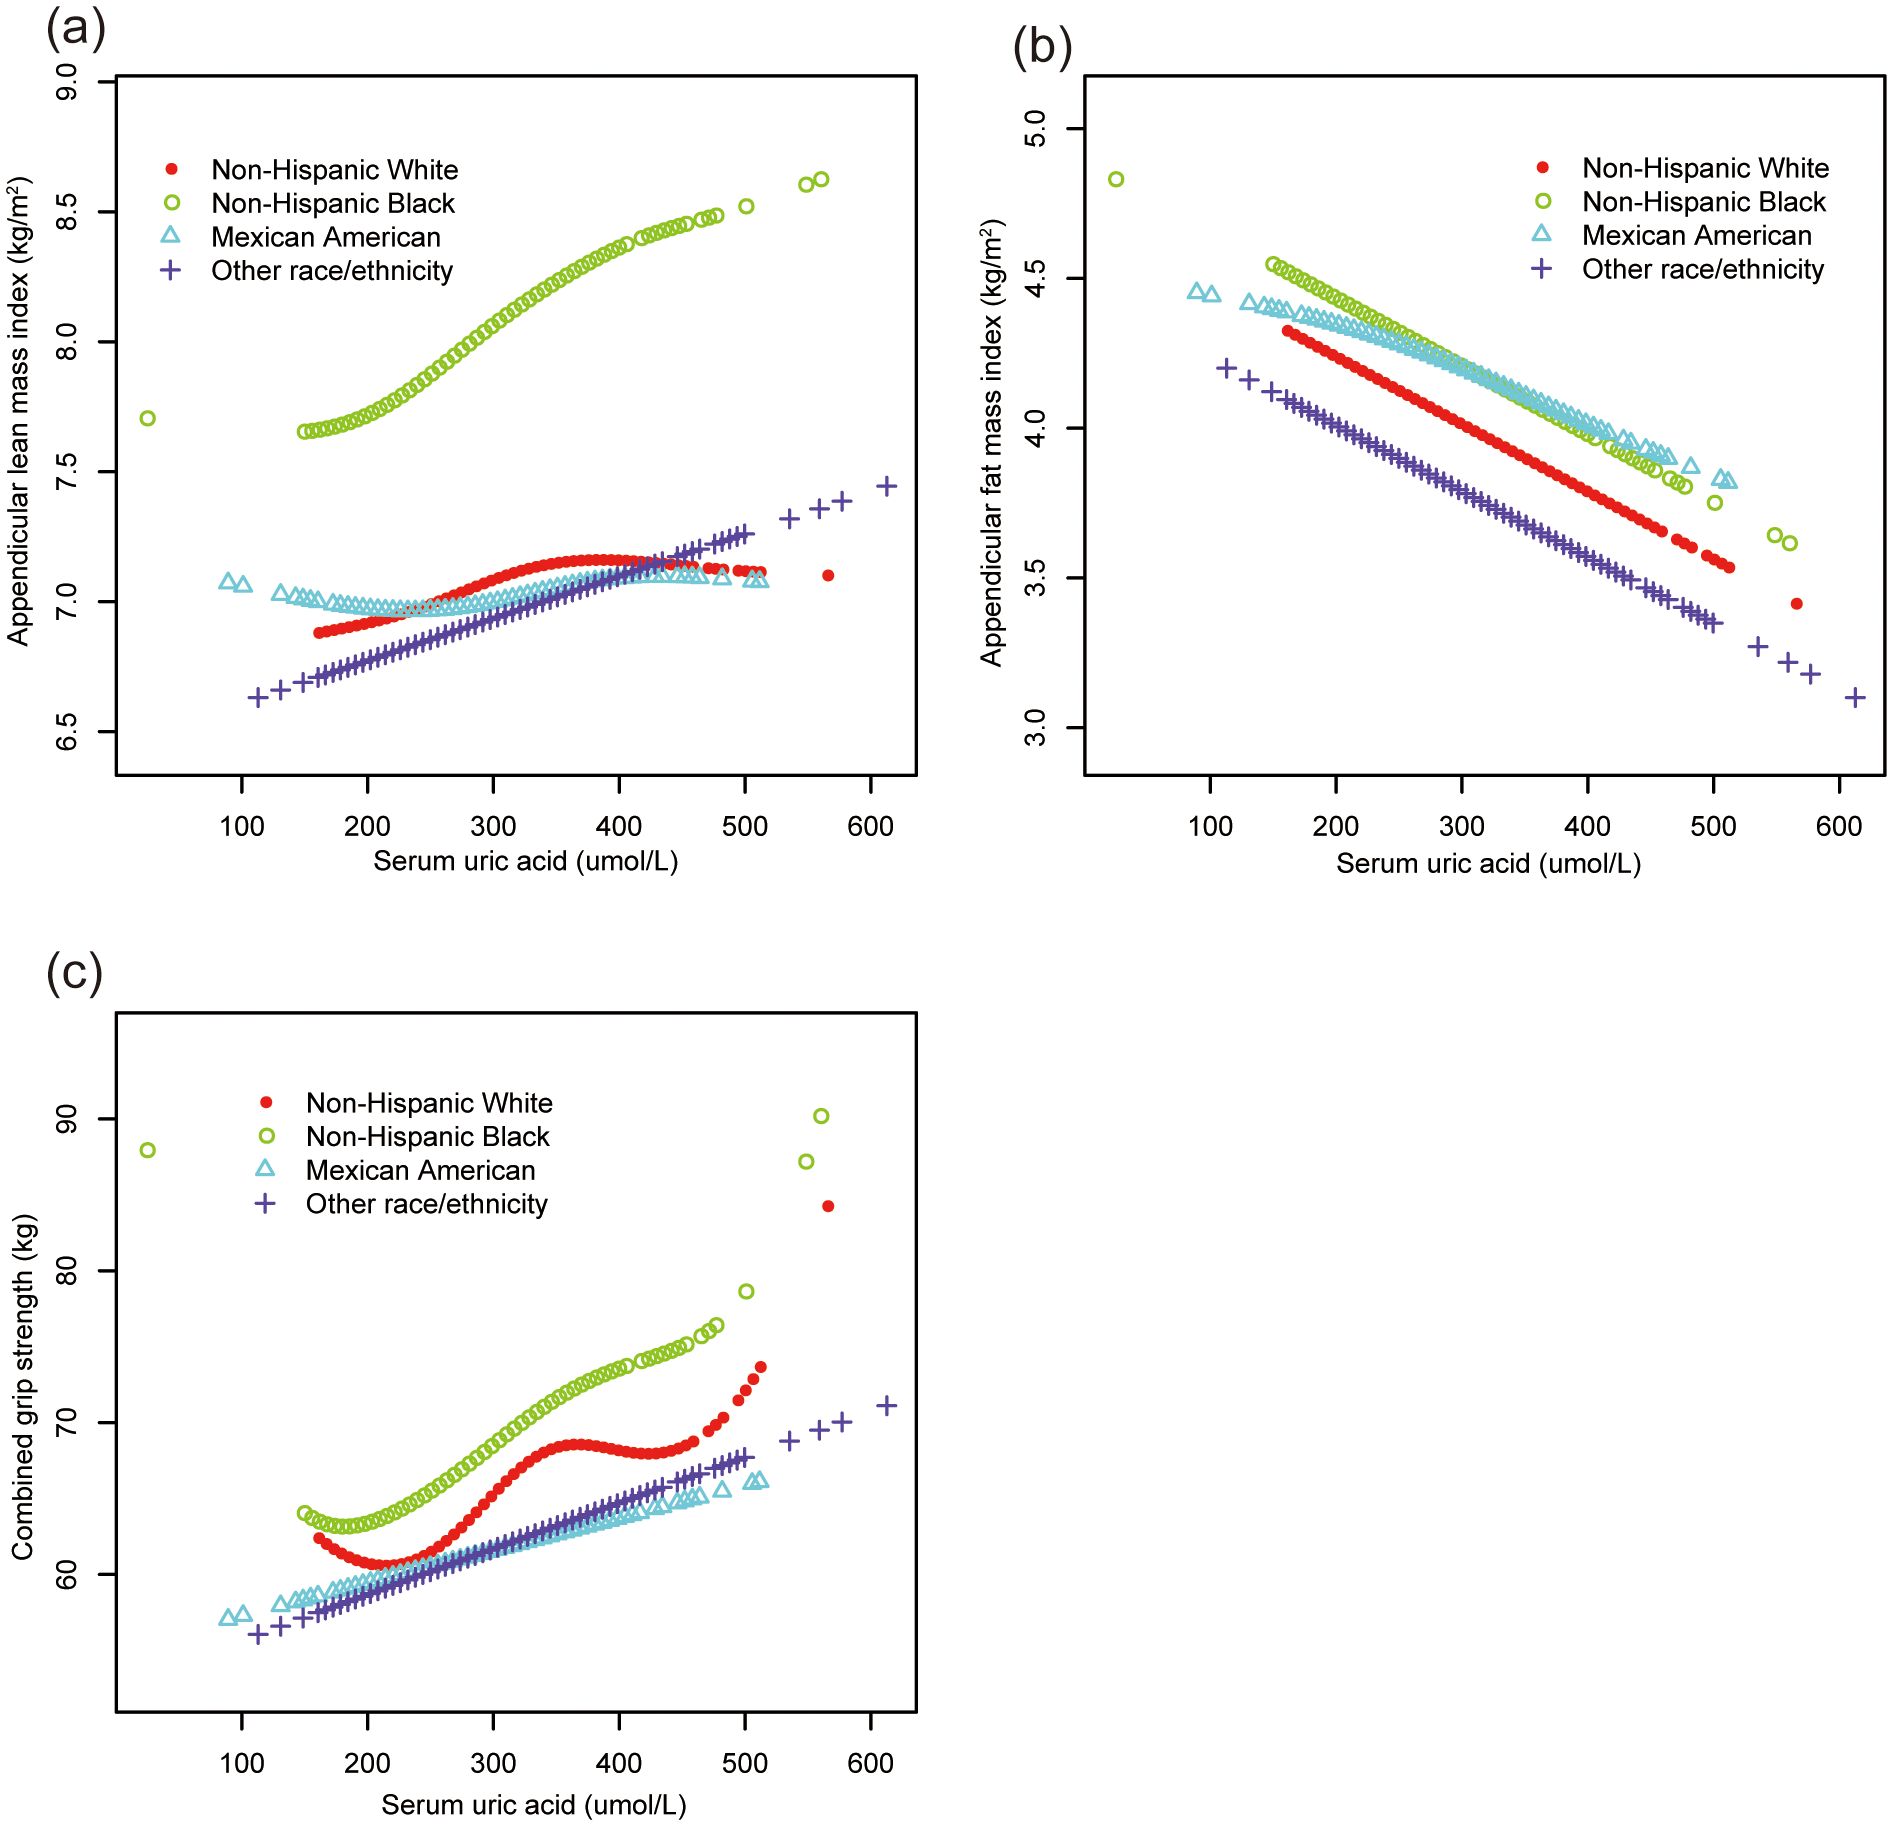
Figure 3. The association of serum uric acid with ALMI, AFMI and combined grip strength, stratified by race. (A) ALMI; (B) AFMI; (C) combined grip strength. ALMI, appendicular lean mass index; AFMI, appendicular fat mass index. Age, sex, ratio of family income to poverty, moderate activities, body mass index, vitamin D intake and calcium intake were adjusted.
DiscussionOur analysis of 2,003 adolescents aged 12-19 years revealed complex associations between sUA and key indicators of musculoskeletal health and body composition. We found significant correlations between sUA and ALMI, AFMI, and grip strength, with distinct patterns across demographic subgroups.
Previous studies have reported conflicting relationships between sUA and muscle parameters. While positive correlations between sUA and muscle mass were observed in kidney transplant recipients (19), elevated sUA predicted reduced muscle mass in men with type 2 diabetes (20). Similarly divergent findings emerged in Chinese populations, with both positive (13) and negative (21) associations reported, suggesting demographic and health-specific modulation of these relationships.
The sUA-muscle strength relationship shows comparable complexity. Studies have reported positive correlations in elderly Japanese women (22), inverted J-shaped associations in Chinese adults (23) and Japanese men (24), and inverse correlations in Korean women (15). Health status further influences this relationship, as evidenced by strength improvements despite increased sUA in diabetic patients undergoing resistance training (25).
Notably, our analysis revealed a negative association between sUA and AFMI in fully adjusted models, contrasting with previous adult studies linking elevated sUA to increased adiposity (26–28). This finding suggests age-specific dynamics in uric acid metabolism and body composition regulation during adolescence.
Subgroup analyses unveiled marked demographic variations. The positive associations between sUA and both ALMI and grip strength were most pronounced in boys aged 12-15 years and non-Hispanic White and Black participants. The varying patterns across racial groups suggest potential genetic and environmental modifiers, including differences in dietary patterns, physical activity levels, and genetic variants affecting uric acid metabolism. Sex emerged as a crucial modifier, consistent with recent findings showing sex-specific associations between sUA and sarcopenia risk (29). This highlights the need for age, sex, and race specific reference ranges when considering sUA as a clinical marker.
The differential associations between sUA and musculoskeletal health and body composition parameters may be explained by several physiological mechanisms unique to adolescent development. The positive association between sUA and lean mass may be attributed to uric acid’s antioxidant properties (30), which could protect developing muscle tissue from oxidative stress during rapid growth. Additionally, sUA’s potential influence on protein synthesis regulation may be particularly relevant during adolescence, when muscle protein turnover is enhanced. Conversely, the inverse relationship between sUA and fat mass may reflect the intricate interplay between uric acid metabolism and adipose tissue function, potentially mediated through inflammatory pathways and adipokine signaling that are distinctively active during adolescent growth (31). Future research should focus on establishing causality through longitudinal studies and examining whether maintaining optimal sUA levels during adolescence could promote healthy musculoskeletal development.
This study analyzed data from 2,003 adolescents aged 12-19 years, enhancing the generalizability of our findings. Methodologically, DXA scans for body composition assessment and standardized grip strength measurements were employed in this study, ensuring reliable and accurate outcome measures. Despite these strengths, several limitations warrant consideration. Primarily, the cross-sectional design precludes the establishment of causal relationships between sUA and musculoskeletal health parameters. Additionally, despite adjusting for numerous confounders, the possibility of residual confounding persists; factors such as pubertal stage, unavailable in the NHANES dataset, could potentially modulate the observed associations. Third, our study focused exclusively on adolescents aged 12-19 years from the general population. While this provides valuable insights into the relationships of sUA with musculoskeletal health and body composition during this critical developmental period, our findings may not be generalizable to populations outside this age range or those with specific medical conditions. Lastly, the single time-point assessment of sUA and related parameters may inadequately capture their dynamic nature, particularly during the rapidly evolving period of adolescence, underscoring the need for longitudinal investigations.
ConclusionOur analysis demonstrated significant associations between sUA levels and various parameters of musculoskeletal health and body composition, suggesting sUA’s potential utility as a developmental biomarker. The differential associations observed across age, sex, and race groups indicated the need for demographic-specific reference ranges when considering sUA as a clinical indicator. Future research should focus on specific topics such as the influence of physical activity and dietary factors on sUA levels, as well as longitudinal studies to establish potential causal relationships and elucidate the temporal dynamics of these associations.
Data availability statementThe datasets presented in this study can be found in online repositories. The data of this study are publicly available on the NHANES website (https://www.cdc.gov/nchs/nhanes/index.htm).
Ethics statementThe studies involving humans were approved by the National Center for Health Statistics. The studies were conducted in accordance with the local legislation and institutional requirements. Written informed consent for participation in this study was provided by the participants’ legal guardians/next of kin.
Author contributionsFX: Formal analysis, Methodology, Software, Writing – original draft. JS: Validation, Writing – original draft. ZZ: Formal analysis, Investigation, Software, Validation, Writing – original draft, Writing – review & editing.
FundingThe author(s) declare that no financial support was received for the research, authorship, and/or publication of this article.
AcknowledgmentsThe authors appreciate the time and effort given by participants during the data collection phase of the NHANES project.
Conflict of interestThe authors declare that the research was conducted in the absence of any commercial or financial relationships that could be construed as a potential conflict of interest.
Generative AI statementThe author(s) declare that no Generative AI was used in the creation of this manuscript.
Publisher’s noteAll claims expressed in this article are solely those of the authors and do not necessarily represent those of their affiliated organizations, or those of the publisher, the editors and the reviewers. Any product that may be evaluated in this article, or claim that may be made by its manufacturer, is not guaranteed or endorsed by the publisher.
References2. Dutra DM, Zaniqueli D, Alvim RO, Baldo MP, Morra EA, Faria ER, et al. A sex-related mediating effect of uric acid in the association between body composition and blood pressure in children and adolescents. Appl Physiol Nutr Metab. (2021) 15:1–7. doi: 10.1139/apnm-2021-0360
PubMed Abstract | Crossref Full Text | Google Scholar
3. Wen S, Arakawa H, Tamai I. Uric acid in health and disease: From physiological functions to pathogenic mechanisms. Pharmacol Ther. (2024) 256:108615. doi: 10.1016/j.pharmthera.2024.108615
PubMed Abstract | Crossref Full Text | Google Scholar
5. Ames BN, Cathcart R, Schwiers E, Hochstein P. Uric acid provides an antioxidant defense in humans against oxidant- and radical-caused aging and cancer: a hypothesis. Proc Natl Acad Sci U S A. (1981) 78(11):6858–62. doi: 10.1073/pnas.78.11.6858
PubMed Abstract | Crossref Full Text | Google Scholar
6. Werdyani S, Aitken D, Gao Z, Liu M, Randell EW, Rahman P, et al. Metabolomic signatures for the longitudinal reduction of muscle strength over 10 years. Skelet Muscle. (2022) 12:4. doi: 10.1186/s13395-022-00286-9
PubMed Abstract | Crossref Full Text | Google Scholar
7. Di Bonito P, Valerio G, Licenziati MR, Campana G, Del Giudice EM, Di Sessa A, et al. Uric acid, impaired fasting glucose and impaired glucose tolerance in youth with overweight and obesity. Nutr Metab Cardiovasc Dis. (2021) 31(2):675–80. doi: 10.1016/j.numecd.2020.10.007
PubMed Abstract | Crossref Full Text | Google Scholar
8. Yuan H, Hu Y, Zhu Y, Zhang Y, Luo C, Li Z, et al. Metformin ameliorates high uric acid-induced insulin resistance in skeletal muscle cells. Mol Cell Endocrinol. (2017) 443:138–45. doi: 10.1016/j.mce.2016.12.025
PubMed Abstract | Crossref Full Text | Google Scholar
9. Zhang X, Liu J, Ni Y, Yi C, Fang Y, Ning Q, et al. Global prevalence of overweight and obesity in children and adolescents: A systematic review and meta-analysis. JAMA Pediatr. (2024) 178(8):800–13. doi: 10.1001/jamapediatrics.2024.1576
PubMed Abstract | Crossref Full Text | Google Scholar
10. Rao J, Ye P, Lu J, Chen B, Li N, Zhang H, et al. Prevalence and related factors of hyperuricaemia in Chinese children and adolescents: a pooled analysis of 11 population-based studies. Ann Med. (2022) 54(1):1608–15. doi: 10.1080/07853890.2022.2083670
PubMed Abstract | Crossref Full Text | Google Scholar
11. Nahas PC, Rossato LT, de Branco FMS, Azeredo CM, Rinaldi AEM, de Oliveira EP. Serum uric acid is positively associated with muscle strength in older men and women: Findings from NHANES 1999-2002. Clin Nutr. (2021) 40(6):4386–93. doi: 10.1016/j.clnu.2020.12.043
PubMed Abstract | Crossref Full Text | Google Scholar
12. Huang YC, Chen SL, Dong Y, Shi Y. Association between elevated serum uric acid levels and high estimated glomerular filtration rate with reduced risk of low muscle strength in older people: a retrospective cohort study. BMC Geriatr. (2023) 23(1):652. doi: 10.1186/s12877-023-04374-3
PubMed Abstract | Crossref Full Text | Google Scholar
13. Dong XW, Tian HY, He J, Wang C, Qiu R, Chen YM. Elevated serum uric acid is associated with greater bone mineral density and skeletal muscle mass in middle-aged and older adults. PLoS One. (2016) 11(5)::e0154692. doi: 10.1371/journal.pone.0154692
PubMed Abstract | Crossref Full Text | Google Scholar
14. Nahas PC, de Branco FMS, Azeredo CM, Rinaldi AEM, de Oliveira EP. Serum uric acid is not associated with appendicular muscle mass index in young and middle-aged adults: Results from NHANES 2011-2012. Clin Nutr ESPEN. (2022) 52:262–9. doi: 10.1016/j.clnesp.2022.08.034
PubMed Abstract | Crossref Full Text | Google Scholar
15. Yi D, Lee MJ, Khang AR, Kang YH. Association between serum uric acid and relative hand grip strength in comparison with metabolic syndrome components. Osteoporos Sarcopenia. (2022) 8(4):158–64. doi: 10.1016/j.afos.2022.10.001
PubMed Abstract | Crossref Full Text | Google Scholar
16. Wen H, Li X, Tan N. Inverse association between uric acid levels and muscle quality index in adults: a cross-sectional analysis of NHANES 2011-2014. BMC Public Health. (2024) 24(1):3109. doi: 10.1186/s12889-024-20559-w
PubMed Abstract | Crossref Full Text | Google Scholar
17. Schafmeyer L, Linden T, Wunram HL, Semmelweis A, Schoenau E, Duran I. Interaction between fat- and muscle development in children and adolescents. Anthropol Anz. (2024) 81(1):1–8. doi: 10.1127/anthranz/2023/1612
PubMed Abstract | Crossref Full Text | Google Scholar
18. von Elm E, Altman DG, Egger M, Pocock SJ, Gøtzsche PC, Vandenbroucke JP. The Strengthening the Reporting of Observational Studies in Epidemiology (STROBE) statement: guidelines for reporting observational studies. Lancet. (2007) 370(9596):1453–7. doi: 10.1016/S0140-6736(07)61602-X
PubMed Abstract | Crossref Full Text | Google Scholar
19. Floriano JP, Nahas PC, de Branco FMS, Dos Reis AS, Rossato LT, Santos HO, et al. Serum uric acid is positively associated with muscle mass and strength, but not with functional capacity, in kidney transplant patients. Nutrients. (2020) 12(8):2390. doi: 10.3390/nu12082390
PubMed Abstract | Crossref Full Text | Google Scholar
20. Tanaka KI, Kanazawa I, Notsu M, Sugimoto T. Higher serum uric acid is a risk factor of reduced muscle mass in men with type 2 diabetes mellitus. Exp Clin Endocrinol Diabetes. (2021) 129(1):50–5. doi: 10.1055/a-0805-2197
PubMed Abstract | Crossref Full Text | Google Scholar
21. Chen L, Wu L, Li Q, Hu Y, Ma H, Lin H, et al. Hyperuricemia associated with low skeletal muscle in the middle-aged and elderly population in China. Exp Clin Endocrinol Diabetes. (2022) 130(8):546–53. doi: 10.1055/a-1785-3729
PubMed Abstract | Crossref Full Text | Google Scholar
22. Kawamoto R, Ninomiya D, Kasai Y, Kusunoki T, Ohtsuka N, Kumagi T, et al. Serum uric acid is positively associated with handgrip strength among Japanese community-dwelling elderly women. PLoS One. (2016) 11(4):e0151044. doi: 10.1371/journal.pone.0151044
PubMed Abstract | Crossref Full Text | Google Scholar
23. Xu L, Jing Y, Zhao C, Yang Y, Yang J, Zhou W, et al. Cross-sectional analysis of the association between serum uric acid levels and handgrip strength among Chinese adults over 45 years of age. Ann Transl Med. (2020) 8(23):1562. doi: 10.21037/atm-20-2813a
PubMed Abstract | Crossref Full Text | Google Scholar
24. Huang C, Niu K, Kobayashi Y, Guan L, Momma H, Cui Y, et al. An inverted J-shaped association of serum uric acid with muscle strength among Japanese adult men: a cross-sectional study. BMC Musculoskelet Disord. (2013) 14:258. doi: 10.1186/1471-2474-14-258
PubMed Abstract | Crossref Full Text | Google Scholar
25. Sousa MS, Saavedra FJ, Neto GR, Novaes GS, Souza AC, Salerno VP, et al. Resistance training in type 2 diabetic patients improves uric acid levels. J Hum Kinet. (2014) 43:17–24. doi: 10.2478/hukin-2014-0085
PubMed Abstract | Crossref Full Text | Google Scholar
26. Li S, Feng L, Sun X, Ding J, Zhou W. Association between serum uric acid and measures of adiposity in Chinese adults: a cross-sectional study. BMJ Open. (2023) 13(5):e072317. doi: 10.1136/bmjopen-2023-072317
PubMed Abstract | Crossref Full Text | Google Scholar
27. Zong J, Sun Y, Zhang Y, Yuan J, Wang X, Zhang R, et al. Correlation between serum uric acid level and central body fat distribution in patients with type 2 diabetes. Diabetes Metab Syndr Obes. (2020) 13(5):2521–31. doi: 10.2147/DMSO.S260891
PubMed Abstract | Crossref Full Text | Google Scholar
28. Wang HP, Xu YY, Xu BL, Lu J, Xia J, Shen T, et al. Correlation between abdominal fat distribution and serum uric acid in patients recently diagnosed with type 2 diabetes. Diabetes Metab Syndr Obes. (2023) 16:3751–62. doi: 10.2147/DMSO.S430235
PubMed Abstract | Crossref Full Text | Google Scholar
30. He J, Hu F, Wang Y, Mei Y. Potential protective effects of increased serum uric acid concentration in sarcopenia: A meta-analysis and systematic review. Med (Baltimore). (2024) 103(9):e37376. doi: 10.1097/MD.0000000000037376
PubMed Abstract | Crossref Full Text | Google Scholar
31. Baldwin W, McRae S, Marek G, Wymer D, Pannu V, Baylis C, et al. Hyperuricemia as a mediator of the proinflammatory endocrine imbalance in the adipose tissue in a murine model of the metabolic syndrome. Diabetes. (2011) 60(4):1258–69. doi: 10.2337/db10-0916
留言 (0)