
記住我
Hypothyroidism is a common pathological state associated with thyroid hormone deficiency and includes subclinical hypothyroidism (SCH) and overt hypothyroidism. SCH is defined as elevated serum thyroid-stimulating hormone (TSH) and free thyroxine (FT4) levels within the lower limit of the normal range. Numerous studies have indicated that SCH is an independent risk factor for cardiovascular diseases (1–6). Some studies have indicated (7–9) that thyroid hormones are associated with various metabolic abnormalities, even at the lower end of the normal range, suggesting that it is crucial to identify the potential factors affecting thyroid function early. Although autoimmune diseases are commonly recognized causes of thyroid dysfunction, the risk factors that trigger hypothyroidism are not well understood. Therefore, further research on the etiology of SCH is warranted. Jankovic et al. (10) observed that obese patients with hypertriglyceridemia exhibit elevated TSH levels, which significantly decrease after serum triglyceride (TG) levels decrease following bariatric surgery. A previous study (11) showed a positive correlation between hyperlipidemia and the risk of SCH. In a prospective study, an exploratory analysis of the relationship between the components of metabolic syndrome and decreased thyroid function in participants with and without metabolic syndrome showed that metabolic syndrome increased the risk of developing SCH. An analysis of the individual components of metabolic syndrome revealed that high TG levels were associated with an increased risk of SCH (12). These studies suggest that thyroid function in patients with hypertriglyceridemia may be adversely affected by lipotoxicity. In populations with abnormal lipid metabolism, lipids have long-term effects, and exploring the relationship between abnormal lipid metabolism and the risk of developing SCH is crucial for the prevention and effective management of SCH. In recent years, many studies have shown that postprandial TG levels are closely associated with type 2 diabetes and cardiovascular disease (13–15). An increasing number of researchers are focusing on the importance of postprandial TG. However, previous studies have been based on the effect of fasting TG levels on thyroid function. Research has also indicated that, in normal individuals, TSH levels decrease 2 hours after a meal (16–18). It is unclear whether postprandial serum TG levels are related to postprandial serum TSH levels and whether postprandial TSH levels differ in different lipid tolerance populations. Therefore, this study aimed to observe the relationship between postprandial TG levels and postprandial TSH levels by performing a lipid tolerance test in volunteers with normal fasting TG and thyroid hormone levels. This study also aimed to compare postprandial TSH levels between participants with normal lipid tolerance and those with reduced lipid tolerance.
Materials and methodsStudy sampleThis study included volunteers aged 25–70 years from the endocrinology outpatient department of Hebei General Hospital from May 2018 to December 2019. This study was approved by the Ethics Committee of Hebei General Hospital (Approval No.: 2018 No. 2, Date: February 26, 2018) and registered with the Chinese Clinical Trial Registration Center (Registration No.: ChiCTR1800019514). All volunteers signed informed consent forms and completed questionnaires as required.
Exclusion criteriaVegetarians; individuals with hyperthyroidism and hypothyroidism, diabetes, heart disease, kidney disease, malignant tumours, acute or chronic blood diseases, and infectious diseases; those with a family history of endocrine-related diseases, such as familial hypercholesterolaemia; individuals currently taking medications that affect glucose and lipid metabolism or inflammation (fish oil, contraceptives, hormones, beta-blockers, diuretics, hypoglycaemic drugs, and lipid-lowering drugs); and those who had experienced stroke, pregnancy, mental disorders, surgery, trauma, or weight changes >3 kg within the past 3 months.
Oral fat tolerance testAll participants were instructed to follow a normal diet for 1 week and abstain from foods high in fat and protein (a list of foods to avoid was provided to all participants 1 week before the test). The participants began fasting at 22:00 on the day before the oral fat tolerance test (OFTT) and continued until 08:00. Participants were asked to consume a high-fat meal within 10 minutes, and during the 8-hour test period, they were allowed to drink water freely but were prohibited from smoking, eating, or engaging in strenuous exercise. Blood samples were collected before the high-fat meal and 2, 4, 6, and 8 hours after the meal. The high-fat meal had a total caloric content of 1500 kcal, with fat accounting for 60% (900 kcal) (monounsaturated fatty acids, polyunsaturated fatty acids: saturated fatty acids ratio = 2:2:1), carbohydrates for 20% (300 kcal), and protein for 20% (300 kcal). The production of the high-fat meal was completed by the nutrition department of our hospital.
Laboratory assaysBody mass index (BMI), systolic blood pressure(SBP), and diastolic blood pressure(DBP) of the participants were uniformly measured by the same physician. The serum levels of fasting blood glucose (FBG), TG, total cholesterol (TC), high-density lipoprotein cholesterol (HDL-C), low-density lipoprotein cholesterol (LDL-C), triiodothyronine (T3), thyroxine (T4), TSH and the postprandial serum levels of TG, T3, T4 after a high-fat meal were measured by a fully automated biochemical analyser.
Definitions of clinical conditionsDefinition of normal fasting TG level: According to the “Guidelines for the Prevention and Treatment of Dyslipidemia in Chinese Adults (Revised 2016)”, a fasting TG level<1.7 mmol/L is defined as normal fasting triglycerides (19).
Definition of postprandial TG elevation: Based on the consensus recommendations of the 2011 Greek Conference, a TG level >2.5 mmol/L 4 hours after a high-fat meal load was defined as postprandial hypertriglyceridaemia (20).
Grouping of subjectsParticipants were divided into two groups: normal fat tolerance group (NFT): (Fasting TG <1.7 mmol/L, postprandial 4-hour TG ≤2.5 mmol/L) and impaired fat tolerance group (IFT): (Fasting TG <1.7 mmol/L, postprandial 4-hour TG >2.5 mmol/L).
Statistical analysisStatistical analysis was performed using SPSS 25.0 software. Normally distributed continuous data were expressed as mean ± standard deviation, and non-normally distributed continuous data were expressed as median (interquartile range). The trapezoidal rule was used to calculate the AUC. The change in TG (△TG) was defined as the difference between the postprandial 4-hour value and the fasting value, and the change in TSH (△TSH) was defined as the difference between the postprandial 6-hour value and the fasting value. Two-way multilevel repeated-measures analysis of variance was used to analyse the data between groups. One-way repeated-measures analysis of variance was used to analyse the data within each group. Between-group comparisons were performed using the t-test for normally distributed data with equal variance; otherwise, non-parametric tests were used. Pearson’s correlation analysis was used to assess the strength of the association between normally distributed variables; otherwise, Spearman’s correlation analysis was used. Statistical significance was set at P < 0.05. Multiple linear regression analysis of the relationship between TGAUC and TSHAUC. We used PASS 2021 (v21.0.3) software to test the sample size and analysis a power.
ResultsComparison of baseline data between two groupsA total of 81 volunteers met the inclusion criteria. There were 45 participants (21 men and 24 women) in the NFT group and 36 (14 men and 22 women) in the IFT group. We used PASS 2021 (v21.0.3) software with a significance level of α =0.05. The sample size of the NFT group was 45, and that of the IFT group was 36 (4 h, 6 h, and 8 h). The minimum difference between the values was input into the software for calculation. The results showed that the sample size of this study achieved a power of 91.40%, which is higher than the required 90%. Therefore, our sample size was sufficient.
BMI, SBP, DBP, FBG, TG, 4-hour postprandial triglycerides (4hTG), HDL-C and TSH levels were significant differences in two groups (P < 0.05). We did not observe any significant differences in age, sex, TC, LDL-C, T3, T4, triiodothyronine area under the curve (T3AUC), and thyroxine area under the curve (T4AUC) between the two groups (P > 0.05) (Table 1).
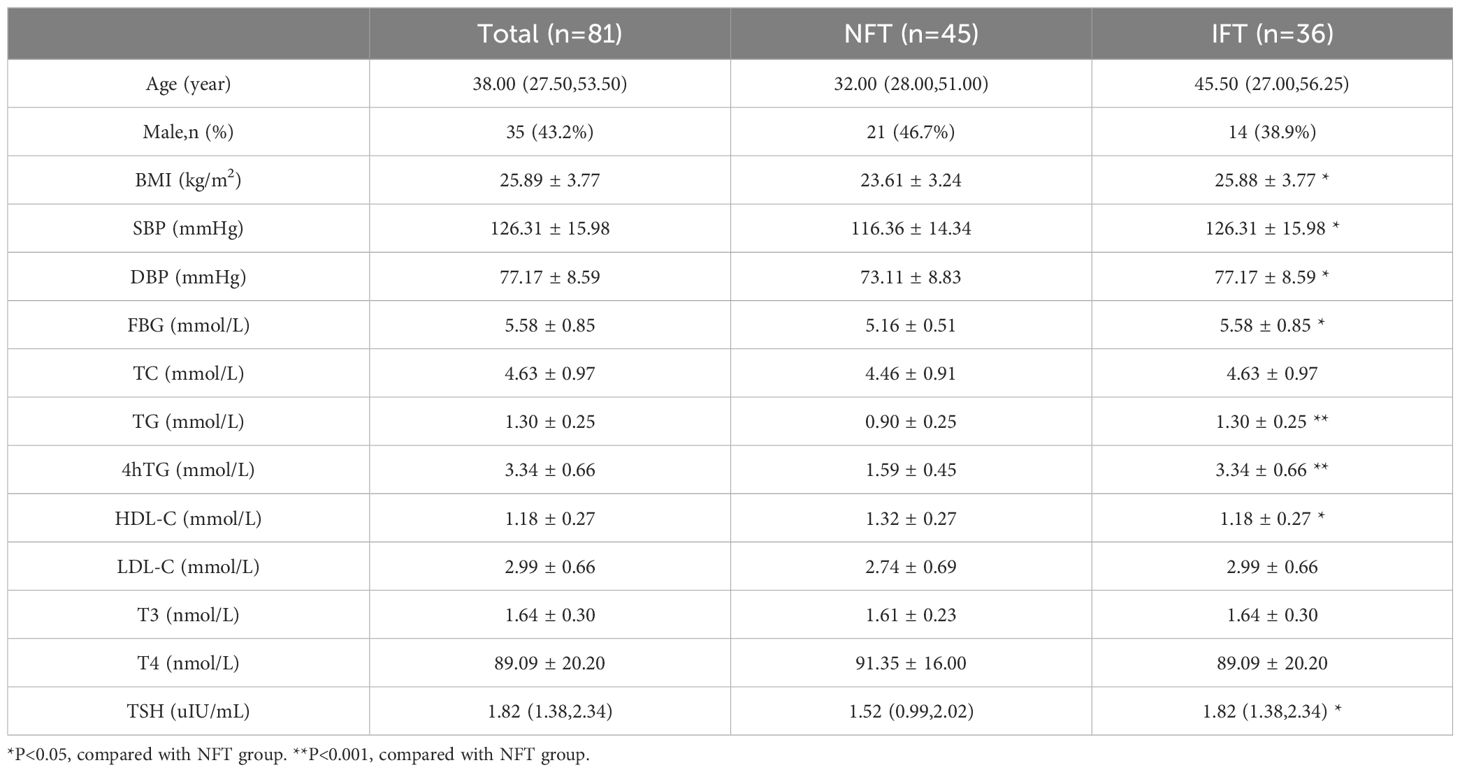
Table 1. Comparison of baseline data between two groups.
Comparison of the Serum TG levels between two groups during the OFTTPostprandial TG levels in the NFT and IFT groups increased over time. The NFT group reached peak TG levels at 2 hours postprandially, while the IFT group reached peak TG levels at 4 hours postprandially. There were statistically significant differences in TG levels between the two groups at all time points (P < 0.001). The TGAUC were also significantly different between the two groups (P < 0.001). Repeated-measures analysis of variance showed that the changes in postprandial TG levels over time were statistically different between the two groups (P < 0.001), and there were statistically significant differences between the two groups (P < 0.05). △TG and TGAUC in the IFT group were higher than those in the NFT group, with statistical significance (P < 0.001). Individuals with reduced fat tolerance exhibit a delayed peak time and higher peak values of postprandial TG after consuming a high-fat meal than those with normal fat tolerance (Table 2, Figure 1A).
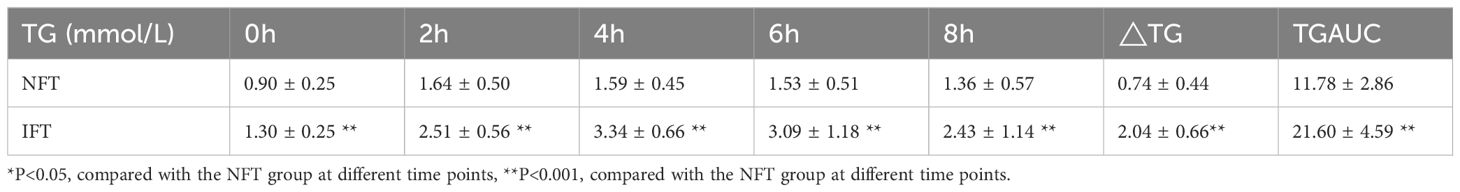
Table 2. Comparison of the Serum TG levels between two groups during the OFTT.
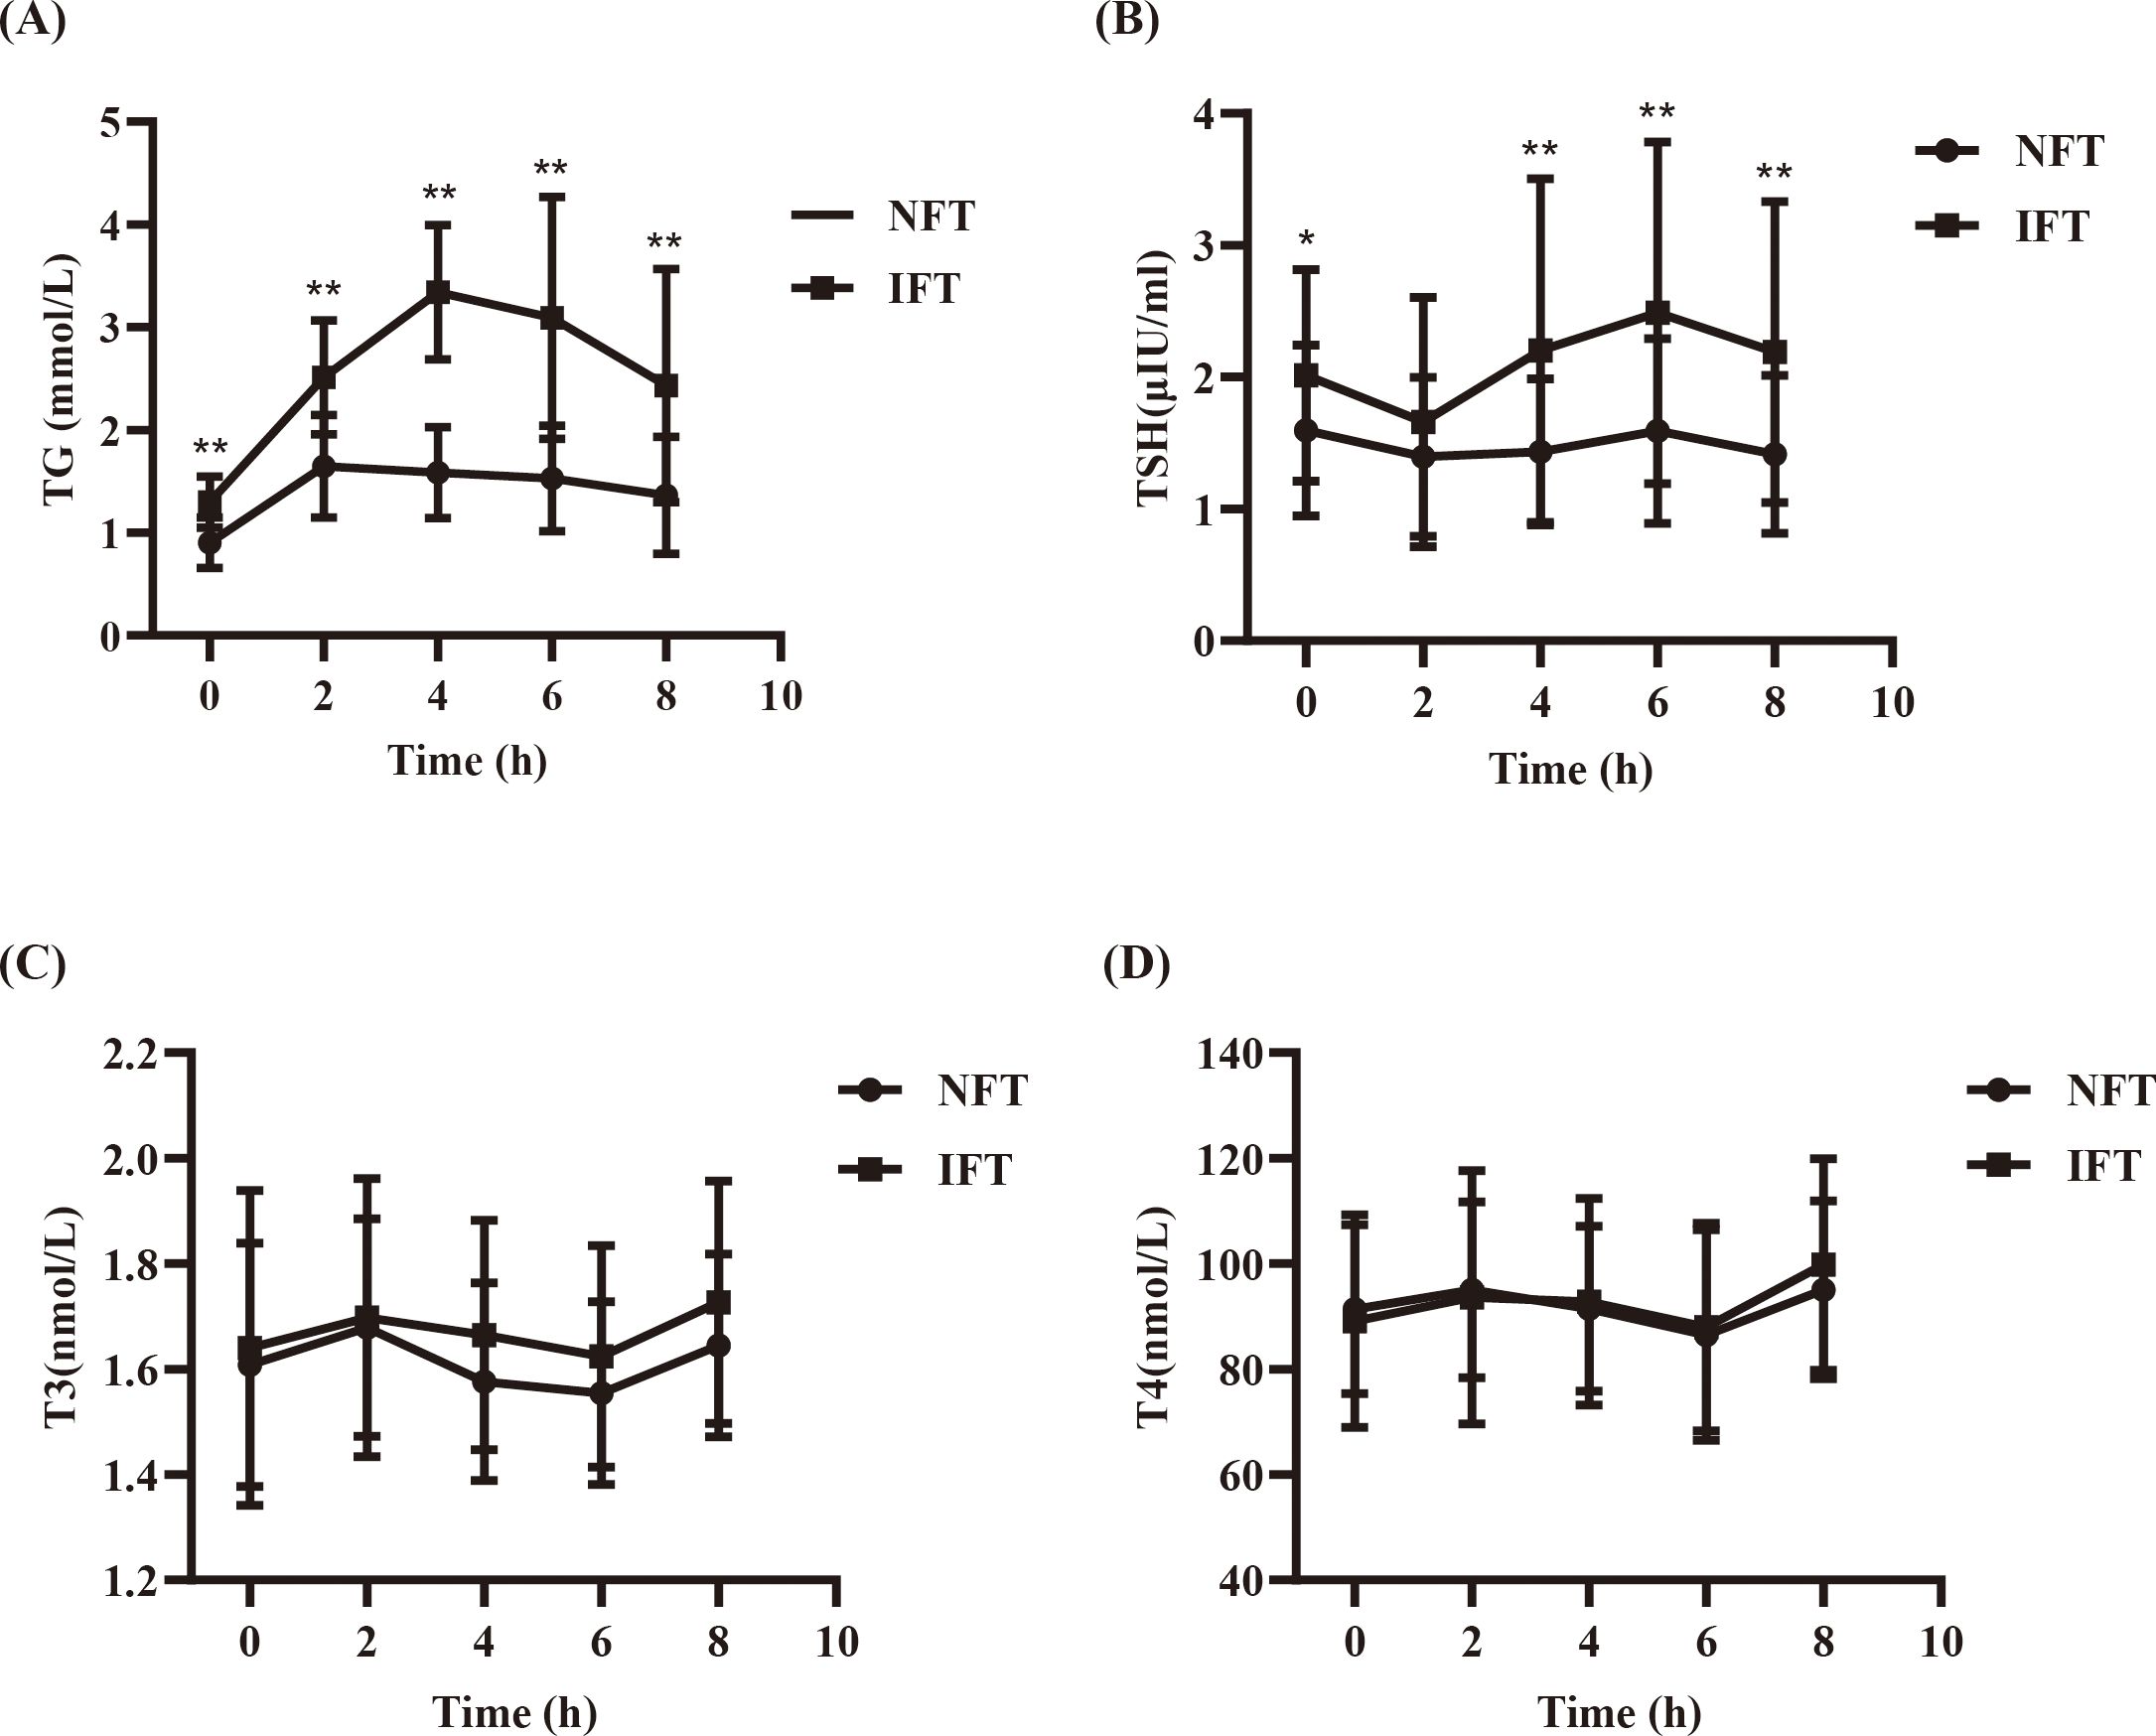
Figure 1. (A) Comparison of the Serum TG levels between two groups during the OFTT. (B) Comparison of the SerumTSH levels between two groups during the OFTT. (C) Comparison of the Serum T3 levels between two groups during the OFTT. (D) Comparison of the Serum T4 levels between two groups during the OFTT. *P<0.05, compared with the NFT group at different time points. **P<0.001, compared with the NFT group at different time points.
Comparison of the Serum TSH levels between two groups during the OFTTPostprandial TSH levels in both NFT and IFT groups initially decreased, reaching a nadir at 2 hours, and then increased, peaking at 6 hours, with the IFT group showing a higher peak. Compared with the NFT group, except for the 2-hour mark, there were statistically significant differences in TSH levels at all other time points in the IFT group (P < 0.05). △TSH and TSHAUC in the IFT group were higher than those in the NFT group, with statistical significance (P < 0.001). Repeated-measures analysis of variance indicated that the changes in postprandial TSH levels over time were statistically different between the two groups (P < 0.05), and there were statistically significant differences between the two groups (P < 0.05) (Table 3, Figure 1B).
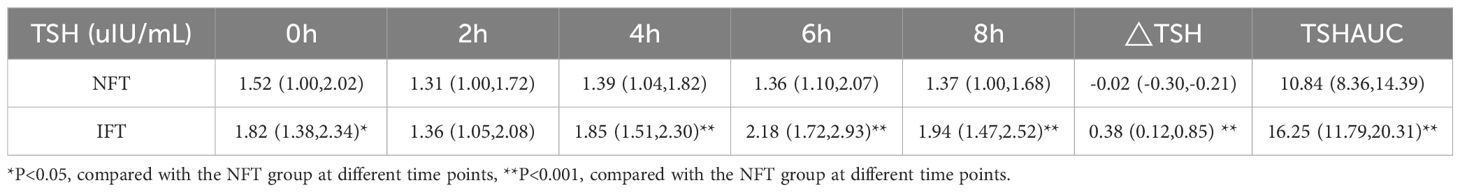
Table 3. Comparison of the Serum TSH levels between two groups during the OFTT.
Comparison of the Serum T3 and T4 levels between two groups during the OFTTPostprandial T3 and T4 levels in both NFT and IFT groups initially increased, peaked at 2 hours, and then decreased, reaching a nadir at 6 hours. Repeated-measures analysis of variance showed that the changes in postprandial T3 and T4 over time were statistically different all the two groups (P < 0.05); however, there were no statistically significant differences in the comparison between two groups. There were also no differences in triiodothyronine area under the curve (T3AUC) and thyroxine area under the curve (T4AUC) between the two groups (P > 0.05) (Tables 4, 5, Figures 1C, D).
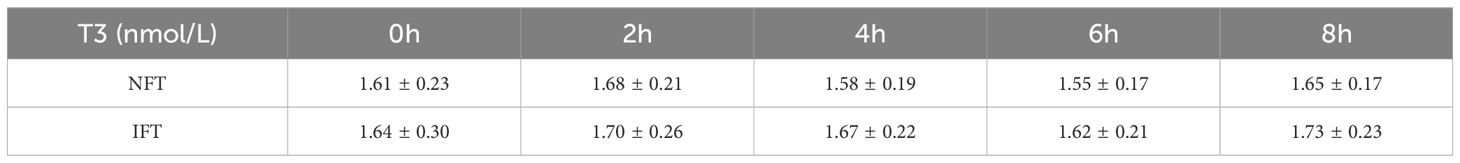
Table 4. Comparison of the Serum T3 levels between two groups during the OFTT.
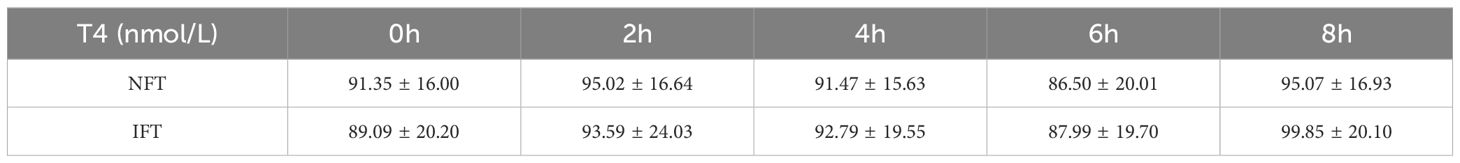
Table 5. Comparison of the SerumT4 levels between two groups during the OFTT.
Relationship between TGAUC and TSHAUCThere was a positive correlation between TGAUC and TSHAUC in both groups (r = 0.386, P < 0.05). Univariate linear regression analysis showed that TGAUC was a influencing factor for TSHAUC (P < 0.01). After adjustment for age, sex, BMI, SBP, DBP, FBG and TC, multiple linear regression analysis showed that TGAUC was an independent influencing factor for TSHAUC(P < 0.001).
DiscussionWith improvements in living standards, the prevalence of hyperlipidemia keeps increasing. Clinically, the lipid metabolism state of the human body is often determined by the fasting blood lipid level. However, during most of the day, the body is in the postprandial state, so the detection of fasting blood lipids does not reflect the overall picture of lipid metabolism. In recent years, many studies have shown that postprandial TG levels are closely associated with type 2 diabetes and cardiovascular disease (13–15). An increasing number of researchers are focused on the importance of postprandial TG. Based on the importance of postprandial TG, we used the oral fasting tolerance test to observe the changes in postprandial TG levels over time in participants with normal fasting TG levels after eating a high-fat meal to observe the overall lipid metabolism status.
The first important finding of our study was that TG levels were increased postprandially in participants in both groups. Compared with the NFT group, even though the fasting TG level in the ITF group was normal, the postprandial TG peak was higher and delayed. The △ TG and TG AUCs were also significantly higher than those of the NFT group. These findings suggest that a reduced lipid tolerance is hidden in individuals with normal fasting TG levels, which is an early stage of lipid metabolism disorder. Therefore, in our clinical work, attention should be paid to identifying patients with lipid metabolism disorders in the early stage, which has important guiding significance for the prevention and management of hyperlipidemia and its complications.
Previous clinical studies have shown that fasting TSH levels are also elevated in individuals with a high fasting TG-emia, compared with those with normal fasting TG levels (10–12). However, all previous studies were based on fasting TG levels, and no study has investigated the effect of postprandial TG on postprandial TSH levels. Based on the significance of postprandial TG, we observed the relationship between postprandial TG levels and postprandial TSH levels in individuals with normal fasting TG levels.
The second important finding of our study was that TGAUC was an independent influencing factor of TSHAUC and was positively correlated. There were statistically significant differences in BMI, SBP, DBP, and FBG between the two groups, and abnormalities in these indicators are often present in people with lipid metabolism disorders, which may be potential factors affecting TSH secretion. Therefore, after we further corrected for these potential confounders, we found that TGAUC remained an independent influencing factor for TSHAUC. This suggests that the postprandial TSH levels are influenced by the postprandial TG levels.
Some studies on organ damage caused by lipotoxicity have confirmed that excessive dietary fat intake triggers ectopic lipid deposition, leading to cellular function damage, also known as “lipotoxic damage.” This interferes with the endocrine system and leads to the development of diseases, such as thyroid disease, especially hypothyroidism (21–23). Shao Shanshan et al. (24) found that when rats consumed a diet containing high-fat lard for some time, serum TSH level was significantly increased, serum T4 and FT4 levels were significantly decreased, and serum T4 level was negatively correlated with serum TG level. The team also found that the TG content in the thyroid was significantly increased, the morphology and ultrastructure of the thyroid were changed, and the protein expression level related to thyroid hormone synthesis decreased. These findings suggest that lipotoxicity may be involved in the development of thyroid dysfunction. MinHee Lee et al. (25) found that all three mice showed varying degrees of primary hypothyroidism after receiving a high-fat diet for some time. Lipid deposition and ultrastructural changes, including endoplasmic reticulum swelling and mitochondrial deformation of thyroid cells, were observed in thyroid tissue. These findings indicated that high-fat diet-induced lipotoxicity damages thyroid tissue and participates in the development of thyroid dysfunction. In a mechanistic study of high-fat diet-induced hypothyroidism in rats by Wang et al. (26), it was found that endoplasmic reticulum stress occurred in rat thyroid cells, which reduced the expression level of thyroglobulin, a key molecule of thyroid hormone synthesis. The research team also produced the same results using a palmitate-induced high-fat model of human primary thyrocytes. This evidence indicates that the high-fat diet-induced lipotoxicity can change the thyroid morphology, increase the endoplasmic reticulum stress, and promote a decline in thyroid function. These findings strongly support our results, and we further identified that the postprandial TG levels affect the postprandial TSH level based on previous studies. This study fills the gap in the effect of postprandial TG on postprandial TSH levels and further explores the effects of lipid metabolism disorders on thyroid function.
The third important finding of our study was that the postprandial TSH levels in both groups reached a trough at 2 h and peaked at 6 h, with the opposite trend of T3 and T4 levels and TSH. All the postprandial TSH levels reached a trough at 2 h, which is consistent with the findings of previous studies. TSH secretion primarily depends on two factors: thyrotropin-releasing hormone and somatostatin; the former stimulates TSH secretion, while the latter inhibits it (27). A study by Ehrenkranz et al. based on large-scale laboratory data showed significant diurnal rhythmic changes in circulating TSH levels. Despite the pulsatile secretion of TSH, the low amplitude of pulses and long half-life of TSH result in only minor fluctuations in blood TSH levels (28). One possible reason for the acute decline in TSH postprandially is the suppression of TSH secretion due to an increase in circulating somatostatin levels induced by food (29). After consuming a high-fat meal, the levels of lipoproteins rich in TG, such as chylomicrons and very-low-density lipoproteins, increase in the body; thyroid hormones can hydrolyze TG-rich lipoproteins by regulating the activity of lipoprotein lipase, thereby reducing circulating TG levels (30). Thyroid hormones also participate in the regulation of the rate-limiting enzyme CPT-1α in fatty acid β-oxidation by inducing the activation of Akt, thus reducing circulating levels of fatty acids and TG (31). Therefore, after a high-fat meal is consumed, the increase in TG-rich lipoproteins in the body prompts the thyroid to respond to the next step of fat metabolism, with the secretion of T3 and T4 increasing 2 h postprandially. This leads to a transient decrease in TSH levels through negative feedback regulation, which may be another important reason for the decrease in postprandial TSH levels. Surprisingly, we found that TSH levels peaked at 6 h after the meal, and T3 and T4 reached their lowest values. TGAUC is an independent influencing factor of TSHAUC and is positively correlated, which indicates that the increase in postprandial TSH levels is influenced by increased postprandial TG levels. We speculate that after a high-fat meal, the circulating TG levels increase, and the demand for thyroid hormones involved in fat metabolism increases. Consequently, the consumption of T3 and T4 increases, causing their levels to reach their lowest values. This triggers negative feedback regulation, leading to increased TSH secretion, which explains the observed peak.
The fourth and most important finding of our study was that the postprandial peak TSH, △ TSH, and TSHAUC were significantly higher in the IFT group than in the NFT group. This indicates that participants in the IFT group had a trend towards hypothyroidism. Based on the conclusions of previous studies on the mechanism of lipotoxic damage to thyroid function and the conclusion of this study that postprandial TG levels affect postprandial TSH levels, it can be speculated that TG clearance is slowed down after high-fat meals are consumed. This continuous postprandial high TG state can aggravate the thyroid damage caused by lipotoxicity and lead to hypothyroidism. This suggests that we should not only focus on thyroid function in people with elevated fasting TG levels but also on thyroid function in people with early lipid metabolism disorders with normal fasting TG levels but elevated postprandial TG levels. The findings of our study provide an important clinical basis for the effective prevention and management of SCH.
With the improvement in living standards, the prevalence of hyperlipidemia is increasing. Previous studies have emphasized that people with elevated fasting TG are prone to hypothyroidism. Based on previous studies, we further found that in individuals with normal fasting TG levels, the hidden individuals with elevated postprandial TG levels are those with early lipid metabolism disorders, and their fasting and postprandial TSH levels are also higher than those of individuals with normal postprandial TG levels, who are prone to hypothyroidism. This prompts us to pay attention to identifying people with early lipid metabolism disorders and their thyroid function. This has important clinical implications for early detection and better management of lipid metabolism disorders and hypothyroidism.
Some limitations of this study need to be addressed. First, this study is our initial exploration of the effect of postprandial TG levels on postprandial thyroid function. Due to our limited experimental conditions and the sample size not being large enough, we will expand the sample size in the future to further validate this study’s results. Second, there is no mechanistic study carried out in this study. The next step will consider animal and cell experiments for an in-depth analysis of the interaction relationship and the potential mechanisms.
In conclusion, our study shows that after a high-fat meal is consumed, postprandial TSH levels are influenced by postprandial TG levels. The decrease in lipid tolerance not only decreases TG clearance ability but also decreases thyroid function. This is the first study in which an oral fasting tolerance test was used to identify higher fat postprandial TG levels and higher postprandial TSH levels in people with early lipid metabolism disorders than in those with normal lipid metabolism. Our findings have important clinical implications for the effective prevention and management of lipid metabolism disorders and hypothyroidism.
Data availability statementThe original contributions presented in the study are included in the article/supplementary material. Further inquiries can be directed to the corresponding author.
Ethics statementThe studies involving humans were approved by Ethics Committee of Hebei General Hospital. The studies were conducted in accordance with the local legislation and institutional requirements. The participants provided their written informed consent to participate in this study.
Author contributionsPT: Writing – original draft, Formal analysis, Data curation, Methodology. SZ: Formal Analysis, Visualization, Writing – original draft. YH: Formal Analysis, Visualization, Writing – original draft. DL: Conceptualization, Supervision, Writing – original draft. YL: Methodology, Supervision, Writing – original draft. GS: Conceptualization, Methodology, Supervision, Project administration, Funding acquisition, Writing – review & editing.
FundingThe author(s) declare that financial support was received for the research, authorship, and/or publication of this article. This work was supported by the National Natural Science Foundation of China (82170878).
AcknowledgmentsWe sincerely thank the teachers of the Clinical Medical Research Centre of Hebei General Hospital for their help with the study.
Conflict of interestThe authors declare that the research was conducted in the absence of any commercial or financial relationships that could be construed as a potential conflict of interest.
Generative AI statementThe author(s) declare that no Generative AI was used in the creation of this manuscript.
Publisher’s noteAll claims expressed in this article are solely those of the authors and do not necessarily represent those of their affiliated organizations, or those of the publisher, the editors and the reviewers. Any product that may be evaluated in this article, or claim that may be made by its manufacturer, is not guaranteed or endorsed by the publisher.
AbbreviationsTG, triglyceride; TSH, thyroid-stimulating hormone; TC, total cholesterol; HDL-C high density lipoprotein cholesterol; LDL-C, low density lipoprotein cholesterol; T3, triiodothyronine; T4, thyroxine; NFT, normal fat tolerance; IFT, impaired fat tolerance; OFTT, oral fat tolerance test; BMI, body mass index; SBP, systolic blood pressure; DBP, diastolic blood pressure; FBG, fasting blood glucose; 4Htg, 4-hour postprandial triglycerides; TGAUC, triglyceride area under the curve; TSHAUC, thyroid-stimulating hormone area under the curve; T3AUC, triiodothyronine area under the curve; T4AUC, thyroxine area under the curve.
References1. Razvi S, Weaver JU, Vanderpump MP, Pearce SH. The incidence of ischemic heart disease and mortality in people with subclinical hypothyroidism: reanalysis of the Whickham Survey cohort. J Clin Endocrinol Metab. (2010) 95:1734–40. doi: 10.1210/jc.2009-1749
PubMed Abstract | Crossref Full Text | Google Scholar
2. Rodondi N, den Elzen WP, Bauer DC, Cappola AR, Razvi S, Walsh JP, et al. Subclinical hypothyroidism and the risk of coronary heart disease and mortality. Jama. (2010) 304:1365–74. doi: 10.1001/jama.2010.1361
PubMed Abstract | Crossref Full Text | Google Scholar
3. Gencer B, Djousse L, Al-Ramady OT, Cook NR, Manson JE, Albert CM. Effect of long-term marine ɷ-3 fatty acids supplementation on the risk of atrial fibrillation in randomized controlled trials of cardiovascular outcomes: A systematic review and meta-analysis. Circulation. (2021) 144:1981–90. doi: 10.1161/CIRCULATIONAHA.121.055654
PubMed Abstract | Crossref Full Text | Google Scholar
4. Inoue K, Ritz B, Brent GA, Ebrahimi R, Rhee CM, Leung AM. Association of subclinical hypothyroidism and cardiovascular disease with mortality. JAMA Netw Open. (2020) 3:e1920745. doi: 10.1001/jamanetworkopen.2019.20745
PubMed Abstract | Crossref Full Text | Google Scholar
5. Sato Y, Yoshihisa A, Kimishima Y, Kiko T, Watanabe S, Kanno Y, et al. Subclinical hypothyroidism is associated with adverse prognosis in heart failure patients. Can J Cardiol. (2018) 34:80–7. doi: 10.1016/j.cjca.2017.10.021
PubMed Abstract | Crossref Full Text | Google Scholar
6. Rhee CM, Curhan GC, Alexander EK, Bhan I, Brunelli SM. Subclinical hypothyroidism and survival: the effects of heart failure and race. J Clin Endocrinol Metab. (2013) 98:2326–36. doi: 10.1210/jc.2013-1039
PubMed Abstract | Crossref Full Text | Google Scholar
10. Jankovic D, Wolf P, Anderwald CH, Winhofer Y, Promintzer-Schifferl M, Hofer A, et al. Prevalence of endocrine disorders in morbidly obese patients and the effects of bariatric surgery on endocrine and metabolic parameters. Obes Surg. (2012) 22:62–9. doi: 10.1007/s11695-011-0545-4
PubMed Abstract | Crossref Full Text | Google Scholar
11. Zhao M, Tang X, Yang T, Zhang B, Guan Q, Shao S, et al. Lipotoxicity, a potential risk factor for the increasing prevalence of subclinical hypothyroidism? J Clin Endocrinol Metab. (2015) 100:1887–94. doi: 10.1210/jc.2014-3987
PubMed Abstract | Crossref Full Text | Google Scholar
12. Chang CH, Yeh YC, Caffrey JL, Shih SR, Chuang LM, Tu YK. Metabolic syndrome is associated with an increased incidence of subclinical hypothyroidism - A Cohort Study. Sci Rep. (2017) 7:6754. doi: 10.1038/s41598-017-07004-2
PubMed Abstract | Crossref Full Text | Google Scholar
13. Nordestgaard BG, Hilsted L, Stender S. Plasma lipids in non-fasting patients and signal values of laboratory results. Ugeskr Laeger. (2009) 171:1093. doi: 10.1016/j.jacc.2017.08.006
PubMed Abstract | Crossref Full Text | Google Scholar
14. Miller M, Stone NJ, Ballantyne C, Bittner V, Criqui MH, Ginsberg HN, et al. Triglycerides and cardiovascular disease: a scientific statement from the American Heart Association. Circulation. (2011) 123:2292–333. doi: 10.1161/CIR.0b013e3182160726
PubMed Abstract | Crossref Full Text | Google Scholar
15. Wierzbicki A, Ahmad R, Banks L, Clark L, Duerden M, Grey E. 2023 exceptional surveillance of cardiovascular disease: risk assessment and reduction, including lipid modification (NICE guideline CG181). London: National Institute for Health and Care Excellence (NICE (2023).
16. Nair R, Mahadevan S, Muralidharan RS, Madhavan S. Does fasting or postprandial state affect thyroid function testing? Indian J Endocrinol Metab. (2014) 18:705–07. doi: 10.4103/2230-8210.139237
PubMed Abstract | Crossref Full Text | Google Scholar
17. Kamat V, Hecht WL, Rubin RT. Influence of meal composition on the postprandial response of the pituitary-thyroid axis. Eur J Endocrinol. (1995) 133:75–9. doi: 10.1530/eje.0.1330075
PubMed Abstract | Crossref Full Text | Google Scholar
18. Bajana W, Aranda E, Arredondo ME, Brennan-Bourdon LM, Campelo MD, Espinoza E, et al. Impact of an Andean breakfast on biochemistry and immunochemistry laboratory tests: an evaluation on behalf COLABIOCLI WG-PRE-LATAM. Biochem Med (Zagreb). (2019) 29:20702. doi: 10.11613/BM.2019.020702
PubMed Abstract | Crossref Full Text | Google Scholar
19. Zengwu W, Jing L, Jianjun L, Naqiong W, Guoping L, Zhenyue C, et al. Guidelines on blood lipid management in China (2023). China Circ Magazine. (2023) 38:237–71. doi: 10.3969/j.issn.1000-3614.2023.03.001
Crossref Full Text | Google Scholar
20. Kolovou GD, Mikhailidis DP, Kovar J, Lairon D, Nordestgaard BG, Ooi TC, et al. Assessment and clinical relevance of non-fasting and postprandial triglycerides: an expert panel statement. Curr Vasc Pharmacol. (2011) 9:258–70. doi: 10.2174/157016111795495549
PubMed Abstract | Crossref Full Text | Google Scholar
21. Shimano H. Novel qualitative aspects of tissue fatty acids related to metabolic regulation: lessons from Elovl6 knockout. Prog Lipid Res. (2012) 51:267–71. doi: 10.1016/j.plipres.2011.12.004
PubMed Abstract | Crossref Full Text | Google Scholar
22. Chokshi A, Drosatos K, Cheema FH, Ji R, Khawaja T, Yu S, et al. Ventricular assist device implantation corrects myocardial lipotoxicity, reverses insulin resistance, and normalizes cardiac metabolism in patients with advanced heart failure. Circulation. (2012) 125:2844–53. doi: 10.1161/CIRCULATIONAHA.111.060889
PubMed Abstract | Crossref Full Text | Google Scholar
23. Oakes ND, Cooney GJ, Camilleri S, Chisholm DJ, Kraegen EW. Mechanisms of liver and muscle insulin resistance induced by chronic high-fat feeding. Diabetes. (1997) 46:1768–74. doi: 10.2337/diab.46.11.1768
PubMed Abstract | Crossref Full Text | Google Scholar
24. Shao SS, Zhao YF, Song YF, Xu C, Yang JM, Xuan SM, et al. Dietary high-fat lard intake induces thyroid dysfunction and abnormal morphology in rats. Acta Pharmacol Sin. (2014) 35:1411–20. doi: 10.1038/aps.2014.82
PubMed Abstract | Crossref Full Text | Google Scholar
25. Lee MH, Lee JU, Joung KH, Kim YK, Ryu MJ, Lee SE, et al. Thyroid dysfunction associated with follicular cell steatosis in obese male mice and humans. Endocrinology. (2015) 156:1181–93. doi: 10.1210/en.2014-1670
PubMed Abstract | Crossref Full Text | Google Scholar
26. Zhang X, Shao S, Zhao L, Yang R, Zhao M, Fang L, et al. ER stress contributes to high-fat diet-induced decrease of thyroglobulin and hypothyroidism. Am J Physiol Endocrinol Metab. (2019) 316:E510–18. doi: 10.1152/ajpendo.00194.2018
PubMed Abstract | Crossref Full Text | Google Scholar
27. Scobbo RR, VonDohlen TW, Hassan M, Islam S. Serum TSH variability in normal individuals: the influence of time of sample collection. W V Med J. (2004) 100:138–42. doi: 10.1002/9781119707677.ch4
PubMed Abstract | Crossref Full Text | Google Scholar
28. Ehrenkranz J, Bach PR, Snow GL, Schneider A, Lee JL, Ilstrup S, et al. Circadian and circannual rhythms in thyroid hormones: determining the TSH and free T4 reference intervals based upon time of day, age, and sex. Thyroid. (2015) 25:954–61. doi: 10.1089/thy.2014.0589
PubMed Abstract | Crossref Full Text | Google Scholar
29. Arosio M, Porretti S, Epaminonda P, Giavoli C, Gebbia C, Penati C, et al. Elevated circulating somatostatin levels in acromegaly. J Endocrinol Invest. (2003) 26:499–502. doi: 10.1007/BF03345210
PubMed Abstract | Crossref Full Text | Google Scholar
30. Martinez-Triguero ML, Hernandez-Mijares A, Nguyen TT, Munoz ML, Pena H, Morillas C, et al. Effect of thyroid hormone replacement on lipoprotein(a), lipids, and apolipoproteins in subjects with hypothyroidism. Mayo Clin Proc. (1998) 73:837–41. doi: 10.4065/73.9.837
PubMed Abstract | Crossref Full Text | Google Scholar
31. de Lange P, Senese R, Cioffi F, Moreno M, Lombardi A, Silvestri E, et al. Rapid activation by 3,5,3’-L-triiodothyronine of adenosine 5’-monophosphate-activated protein kinase/acetyl-coenzyme a carboxylase and akt/protein kinase B signaling pathways: relation to changes in fuel metabolism and myosin heavy-chain protein content in rat gastrocnemius muscle in vivo. Endocrinology. (2008) 149:6462–70. doi: 10.1210/en.2008-0202
留言 (0)