
記住我
The traditional drug development (R&D) process is extremely expensive, lengthy, complex, and risky (Chong and Sullivan, 2007). According to a recent study (Chan et al., 2019), introducing a new drug to the market involves multiple steps, typically costs over 2 billion USD, and takes an average of 12 years. Effectively improving the success rate of R&D and reducing the expensive workload of the verification procedure has become an urgent challenge for researchers (Wang et al., 2023). Drug repositioning is an approach to finding new therapeutic potential for existing drugs that have already been approved by the Food and Drug Administration (FDA) for the treatment of diseases (Novac, 2013). This innovative strategy has many advantages, such as reducing drug risk, shortening clinical evaluation cycle, enhancing cost-effectiveness, and improving efficiency (Pushpakom et al., 2019; Luo et al., 2021). In recent years, drug repositioning has been widely applied in disease and related therapeutic areas, including anticancer drug discovery (Ye et al., 2014), identification of novel therapies for orphan and rare diseases (Setoain et al., 2015), overcoming of drug resistance (Younis et al., 2015) and advancement of personalized medicine (Li and Jones, 2012). These successful applications have shown that drug repositioning is increasingly becoming an attractive proposition (Lotfi Shahreza et al., 2018).
Many previous studies of computational drug repositioning mainly utlized drug and disease similarity information to predict potential drug-disease associations (Wang et al., 2019; Zhang et al., 2018; Luo et al., 2018). However, most of these methods typically used a single type of similarity information, which can lead to various data quality issues, such as missing information, sparse data and insufficient generalization ability. Based on various biomedical information, multiple drug similarities and disease similarities can be calculated (Huang et al., 2021). These similarities can be integrated to enhance the feature representation of drugs and diseases in multiple dimensions (Peng et al., 2021). In recent years, many methods have been proposed to integrate multiple similarity information to improve the performance of drug-disease interaction prediction. These integration methods primarily use two main schemes including linear-based and nonlinear-based strategies to handle multiple similarities.
The similarity integration methods based on the first strategy train the prediction model by jointly learning linear combination of multiple similarities. AVE (Nascimento et al., 2016) was the most intuitive linear approach that simply averaged multiple similarity networks by assigning the same weight to each network. Hilbert–Schmidt Independence Criterion (HSIC) (Ding et al., 2020) applied the HSIC metric to achieve the optimal combination of different similarity networks. This method utilized multi-kernel learning to assign weights to each similarity network, thereby maximizing the dependency on the ideal similarity network. Local Interaction Consistency (LIC) (Liu and Tsoumakas, 2021) introduced the concept of local balance, which refers to the proportion of similar drugs or diseases with the same drug-disease interaction. This method improves the prediction performance by assigning higher weights to similarity networks with better local balance. Liu et al. (2023) proposed a fine-grained selective similarity integration method (FGS), which further used a similarity selection step based on LIC to filter out noise information with finer granularity. However, these linear-based similarity integration methods can’t capture complex relations among these networks effectively.
Integration methods using the second strategy regard each similarity network as a graph and exploit the structure of the graph to find complex nonlinear relations between network nodes. These integration methods can be divided into two categories: (1) methods using SNF (Wang et al., 2014), and (2) methods using matrix joint decomposition strategies. SNF used a nonlinear approach based on message-passing theory and updated each similarity network iteratively to make it more similar to the others, eventually converging to a single network. Recently several works have extended SNF in different ways to propose novel integration approaches. For example, considering that the Euclidean distance metric used in SNF suffers from the curse of dimensionality (Rozza et al., 2012), HSNF (Hierarchical SNF) (Liu and Shang, 2018) designed a hierarchical processing by applying the SNF method to different feature subsets multiple times. This method aims to reduce the noise and redundant information of high-dimensional data, thereby improving the quality of the fused similarity network. Although HSNF performs better than SNF on multiple datasets, it has a higher computational cost due to the iteration of SNF. Affinity Network Fusion (ANF) (Ma and Zhang, 2017) used affinity matrices to represent the degree of association between networks from different data sources and reduced the computational cost of SNF by simplifying the iterative integration process into a more straightforward one-step random walk approach. Considering the redundancy and noise problems in multi-similarity networks, several methods have been proposed to improve SNF. For example, similarity selection step is adopted to remove network noise in several integration methods (Olayan et al., 2018; Thafar et al., 2020). The Similarity Kernel Fusion algorithm (SKF) (Jiang et al., 2019) used the kernel functions to construct the kernel matrix of each similarity network and adjusted its weight according to the contribution of each kernel matrix to the target task, thereby increasing the weight of the similarity kernel with lower noise and improving the model’s performance. The association-signal-annotation boosted similarity network fusion (ab-SNF) method (Ruan et al., 2019) introduced the concept of associated signals and aimed to improve SNF by using a weighted distance measurement to emphasize important signal features while minimizing the impact of noisy data. The weight was measured using the paired t-test method, which calculates the weight ratio by comparing the negative sample with the adjacent normal sample at the feature.
Some studies employed joint matrix decomposition to differentiate shared information from network-specific information across various datasets and identify the consistency of multiple networks (Žitnik et al., 2015; Žitnik et al., 2013; Zheng et al., 2013). Recently, Cho et al. proposed a method for multi-similarity networks integration, named Mashup (MU) (Cho et al., 2015; 2016; Wang et al., 2015). This method combines random walk with multi-view factorization and provides a fruitful integration framework. Zhang et al. (2022b) developed a multi-similarity integration method, EnMUGR, that incorporates graph regularization. EnMUGR can effectively address noise and redundancy in multi-similarity networks.
In addition to using similarity information as feature representations of drugs and diseases, drug repositioning methods can also use the associations between drugs and other related biomedical entities (such as genes, diseases, and pathways) to learn feature representations, thereby more accurately predicting potential drug-disease association information (Zhang et al., 2023; Zhang et al., 2024). By constructing a knowledge graph that contains drugs and other related entities, feature representations of drugs and diseases can be learned, which include the relationships and contextual information between these entities. Domingo-Fernández et al. (2022) proposed a knowledge graph causal reasoning model (RPath) for drug discovery, which uses drug perturbation and disease-specific transcriptome features to help identify potential drug candidates for specific diseases by reasoning on causal paths in a knowledge graph (KG). Zhang et al. (2022a) combined drug chemical structures and biomedical knowledge graphs (KGs) to propose a meta-path-based graph representation learning model for drug-disease association (DDA) prediction, namely, RLFDDA. This model constructs a heterogeneous network by integrating DDA, disease-protein associations, and drug-protein associations, and adopts a meta-path random walk strategy to learn the latent representations of drugs and diseases. Han et al. (2023) proposed a multi-channel feature fusion model for multi-typed DDIs prediction, which employs a multi-channel feature fusion module to fuse drug chemical structure features, drug pairs’ extra label features, and KG features of drugs. This approach effectively alleviates the problem of feature redundancy and noise from KG.
In light of the above discussion, we proposed a novel computational framework for drug repositioning based on graph regularized integration and knowledge graph embedding. First, in order to address the problem of incomplete entity information caused by using only one source of data, we employ a graph regularized integration method with a denoised diffusion module to fuse multiple similarity information of drugs and diseases, thereby calculating the common attribute feature representation of drugs and diseases. Then we utilize knowledge graph embedding methods to learn global topological feature representations of drug and disease entities. Finally, we fuse these two learned feature representations by iAFF and feed them into a graph convolutional network prediction model to identify potential therapeutic indications for drugs.
The major contributions of this study are summarized as follows.
• This study proposed a novel framework KGRDR, which integrates a fusion algorithm based on graph regularization and knowledge graph embedding to identify potential indications for existing drugs, providing valuable insights to promote drug repositioning.
• The KGRDR framework utilized a graph regularized method to effectively address noise and redundancy in multi-similarity networks.
• An iterative attention feature fusion method is utilized to combine similarity feature information with the structural feature information derived from knowledge graph learning.
2 Materials and methods2.1 Notations and brief review of KGRDRSimilarity matrices, denoted by u=1u, are calculated based on various biomedical data sources for drug pairs or disease pairs. Sr(u)∈RNr×Nr are drug pairs similarity matrices, where Nr is the number of drug nodes; Sd(u)∈RNd×Nd are disease pairs similarity matrices, where Nd is the number of disease nodes; element sij(u) represent the similarity score between nodes i and j in the uth network; v=1v denotes the similarity matrices selected from u=1u to reduce network redundancy; v=1v denotes the denoised similarity matrices by further denoised diffusion; X∈RN×D denotes common attribute feature representation learned by joint decomposition with graph regularization, Y∈RN×D denoted topological feature representation learned by feature extraction based on KG, and Z∈RN×D denotes the feature representation fused by iAFF.
As illustrated in Figure 1, the proposed framework KGRDR mainly consists of four steps, including multi-similarity integration based on graph regularization, feature extraction based on KG, feature fusion based on iAFF, and drug-disease interaction prediction based on GCN. In the first step, a graph regularized integration method is used to fuse and compute common attribute feature representation X∈RN×D for multiple denoised similarity networks v=1v. In the second step, knowledge graph embedding is used to extract global topological feature representation Y∈RN×D of drug and disease entities. In the third step, an iterative attention feature fusion method iAFF is used to effectively integrate the attribute feature representation X and topological feature representation Y. In the fourth step, the fused drug and disease feature vectors Z∈RN×D are fed into the GCN model to predict new drug-disease interactions.
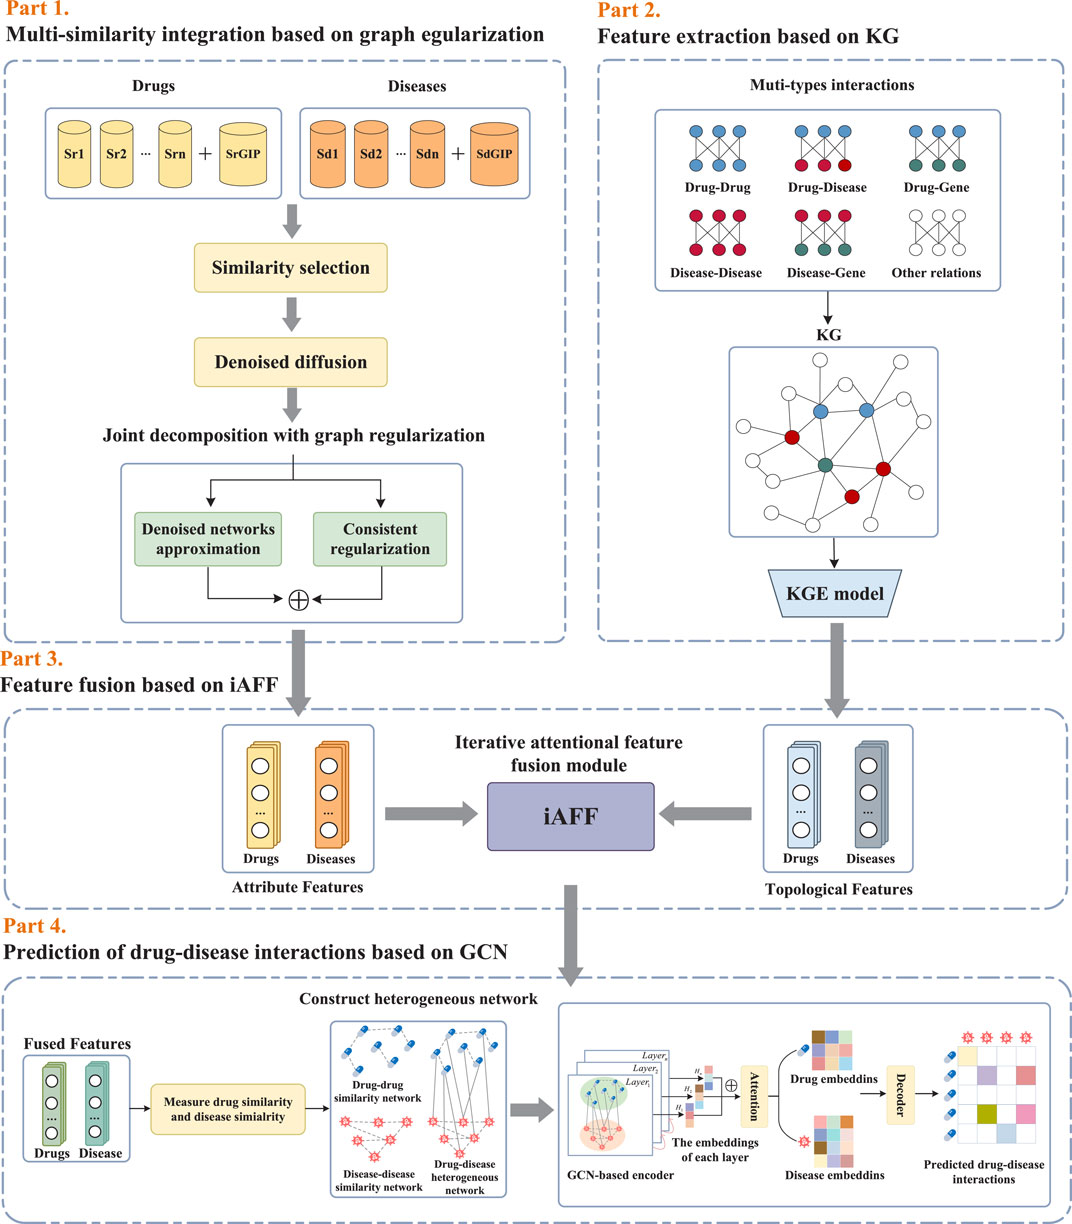
Figure 1. The workflow of the proposed KGRDR.
2.2 Multi-similarity integration based on graph regularizationConsidering that noise and redundant information in the multi-similarity networks significantly affect the model’s prediction performance, a graph regularized integration approach (Zhang et al., 2022b) is used to denoise and fuse the multi-similarity information of drugs and diseases. This method primarily consists of denoised diffusion and joint decomposition. The denoised diffusion module is used to denoise multiple similarity networks, while the joint decomposition module fuses the denoised networks. Additionally, to eliminate similarity networks with minimal information and excessive redundancy, a similarity selection operation is employed to pre-screen the similarity matrices before the graph regularized integration step.
2.2.1 Drug and disease similarity dataThe pairwise similarity data of drug-related and disease-related entities used in this study are obtained from SND (Jarada et al., 2021) and SCMFDD_S (Zhang et al., 2018) datasets. SND includes ten drug-related similarity data, fourteen disease-related similarity data, and drug-disease interaction data. SCMFDD_S contains five drug-related similarity data, one disease-related similarity data, and drug-disease interaction data. The pairwise similarity values between drugs and diseases range from 0 to 1.
In addition to the above similarity data, we also calculate Gaussian interaction profile kernel similarity of drugs and diseases based on known drug-disease interaction information Van Laarhoven et al. (2011). Drug r is represented by a binary feature vector f(r), where the absence or presence of a disease interaction is encoded by 0 or 1, respectively. Similarly, Disease d is represented by a binary feature vector g(d), where the absence or presence of a drug interaction is encoded by 0 or 1, respectively. The profile similarity values for drug pairs and disease pairs were calculated as shown in Equations 1, 2.
SrGIPr1,r2=exp−γnr‖fr1−fr2‖2∑i=1nr|fri|2(1)SdGIPd1,d2=exp−γnd‖gd1−gd2‖2∑j=1nd|gdj|2(2)where the parameter γ controls the kernel bandwidth, nr and nd are the total number of drugs and diseases, |f(ri)| is the number of diseases that interact with drug ri, |g(dj)| is the number of drugs that interact with disease dj. Here, γ was simply set to 1 as indicated by Van Laarhoven et al. (2011).
2.2.2 Similarity selectionThe quality, richness and correlation of drug-related and disease-related similarity matrices vary considerably (Jarada et al., 2021). Data inconsistency and redundancy can introduce noise. This study adopted an effective method, introduced by Olayan et al. (2018), to select the most informative and less redundant drug and disease similarity subset. The heuristic similarity selection process consists of four parts: calculating the average entropy of similarity matrices, ranking the matrices according to their average entropy values, calculating the similarity measure between similarity matrices from different data sources, and eliminating redundant similarity matrices.
In this study, we use the calculated profile similarity and similarities from SND and SCMFDD_S datasets to perform the similarity selection. The similarity selection step extracts a subset v=1v of the similarity matrices that is both highly informative and minimally redundant, V denotes the number of similarity matrix.
2.2.3 Diffusion to denoise matricesSome noise may still exist in the extracted similarity matrices. To address this problem, we apply denoised diffusion (Wang et al., 2018) to further reduce the noise in the similarity matrices v=1v obtained by similarity selection. The denoised similarity matrix v=1v is computed as Equation 3.
S̃v=1−αUvΣI−αΣ2−1Uv−1(3)where S̃(v)∈RN×N represents the vth denoised similarity matrix of size N×N, α∈(0,1) is a hyperparameter that increases the strength of self-similarity, U(v) is the matrix with eigenvectors of S(v) as its columns, I is the N×N identity matrix and ∑ is a diagonal matrix with eigenvalues of S(v) as its entries. Through the above iterative process, denoised matrix S̃(v) can be computed for each similarity matrix, which is used in the next joint decomposition step.
2.2.4 Joint decomposition with graph regularizationIn order to fuse the denoised similarity matrices in v=1v, we employ a graph regularized integration method (Zhang et al., 2022b), which combines joint decomposition (Cho et al., 2016) with graph regularization to learn a common attribute feature representation X∈RN×D from denoised similarity matrix subsets v=1v.
The joint decomposition method can analyze multiple networks uniformly, capture the inconsistencies between networks, and explore the correlations between networks. Specifically, for the denoised similarity subset v=1v, the common feature matrix X is used to represent the common components between networks, and the specific feature matrix W(v) is used to represent the specific components for network v. Each denoised matrix S̃(v) is approximated by a reconstruction matrix Ŝ(v) with Ŝ(v)=softmaxXTW(v). The approximation error of S̃(v) and Ŝ(v) is measured by the Kullback–Leibler (KL) divergence and described as Equation 4.
Lappr=∑v=1VKLS̃v‖Ŝv=1N∑v=1V∑i,j=1Ns̃ijvlogs̃ijv−1N∑ν=1V∑i,j=1Ns̃ijνxiTwjν−log∑j′=1NexpxiTwj′ν(4)in which xi are column vectors of X, representing a common feature vector of node i in the vth network, and wj(v) are column vectors of W(v), representing a specific feature vector of node j in the vth network.
Moreover, to ensure that the common feature X can accurately represent the refined structural information from v=1v, a graph Laplacian regularization term Lreg is introduced on X. Specifically, the consistency of all node pairs is defined as Equation 5.
Lreg=∑v=1V∑i,j=1N‖xi−xj‖2s̃ijv=∑ν=1VTrXD̃νXT−TrXS̃νXT=∑v=1VTrXL̃vXT(5)in which D̃(v) denotes the diagonal degree matrix of S̃(v) with L̃(v)=D̃(v)−S̃(v) is the graph Laplacian matrix and Tr(⋅) denotes the trace of a matrix.
The objective function is described as Equation 6.
minW̃vv=1V,XL=Lappr+Lreg=∑v=1VKLS̃v‖Ŝv+λTrXL̃vXT(6)where λ≥0 is the regularization parameter, X is regarded as the common attribute feature representation shared across all similarity matrices. The dimension of the feature representation X directly affects the integration capacity of multi-similarity networks and the performance of downstream prediction tasks. To investigate its effect on model predictions, we subsequently conducted a parameter sensitivity analysis on the feature representation dimension.
2.3 Feature extraction based on KGIn this study, we used the Drug Repurposing Knowledge Graph (DRKG) (Ioannidis et al., 2020) to learn topological features of drugs and diseases. DRKG is specifically designed for drug repurposing and includes entities such as drugs, diseases, and genes, along with their relationships. Knowledge graph embedding maps these entities and relationships into a low-dimensional vector space, preserving both structural and semantic information. In this study, we applied the ComplEx knowledge graph (KG) embedding method (Trouillon et al., 2016) to learn embedding representations.
2.3.1 Knowledge graph constructionDRKG included 97,238 entities belonging to 13 entity types and 5,874,261 triples belonging to 107 edge types. The types of entities and relationships included in the knowledge graph are as follows.
• Entities: drugs, diseases, genes, compounds, etc.
• Relations: drug-target, gene-disease, drug-disease, etc.
DRKG is composed of entity-relation-entity triples. For example, the triple (DB00512, Compound:Disease, C0157749) indicates that drug DB00512 interacts with disease C0157749. In the knowledge graph, entities are represented as nodes, and relations are represented as edges from the subject entity node to the object entity node. We removed all the triples of drug-disease relationship in DRKG that were not present in the benchmark dataset (Jarada et al., 2021; Zhang et al., 2018), added new triples of drug-disease relationship that existed in dataset to DRKG, and regarded the obtained triples in DRKG as the KG dataset.
2.3.2 Knowledge graph embeddingAs shown in Figure 1, we employed the widely adopted KGE method, ComplEx (Trouillon et al., 2016), to derive KG-based feature representations for each entity and relationship in the DRKG. ComplEx models entities and relations by embedding them into complex domains, which can capture the asymmetric relationship between triples (drug-disease-relationship) while preserving the vector representation, thereby more effectively handling the drug-disease interaction prediction problem. The process is as follows.
• Embedding Initialization: The dataset contains nr drugs and nd diseases. For each drug ri, we learn the complex vector es∈Ck of ri, and Ck represents a complex vector space with k dimensions. Similarly, for each disease dj, learn the complex vector eo∈Ck of dj. For the drug-disease interaction relationship r, we learn the complex vector wr∈Ck.
• Predicting drug-disease interaction scores: A scoring function is used to measure the interaction strength between the learned complex embedding vectors of drugs and diseases, thereby predicting potential drug-disease interactions. The scoring function is a core component of the ComplEx embedding method. By training and optimizing the scoring function, the embedding vectors of drugs and diseases are adjusted and refined. The scoring function for the triple is described as Equation 7.
ϕr,s,o;Θ=Re<wr,es,ēo>=Re∑k=1Kwrkeskēok=〈Rewr,Rees,Reeo〉+〈Rewr,Imes,Imeo〉+〈Imwr,Rees,Imeo〉−Imwr,Imes,Reeo(7)where Θ denotes the model parameters, wr is the embedding vector of the relation, es is the subject vector of the relation, ēo is the conjugate object vector of the relation, Re(x) means to take the real vector component of x, Im(x) means to take the imaginary vector component of x. In the complex space,<eo,es>=<es,eo>̄, so Re(<eo,es>) is symmetric, while Im(<eo,es>) is antisymmetric. The score for the triple (s,r,o) is calculated as the product of the conjugate vector of the relation r and the vectors representing the subject s and object o, with the real part of the final result retained. The predicted probability of interaction that the triple (s,r,o) existed in knowledge graph is calculated by the logistic inverse link function defined in Equation 8.
• Model training and optimization: In order to learn appropriate embedding representations of drugs and diseases, the ComplEx model optimizes the embedding representation through negative sampling and loss function. The goal of the loss function is to maximize the prediction score of the true drug-disease interaction pair while minimizing the score of the negative sample pair. The loss function of the model is defined as Equation 9.
minΘ∑rs,ρ∈Ωlog1+exp−Yr,ρϕs,r,σ,Θ+λ‖Θ‖22(9)where λ is a hyper-parameter introduced in the study (Trouillon et al., 2016).
• Extracting features: Using the trained model, the embedding vectors of drug and disease entities are extracted as their global topological feature representation Y∈RN×D.
2.4 Feature fusion based on iAFFIn this study, we used the iterative attention feature fusion (iAFF) method (Dai et al., 2021) to fuse the attribute feature X∈RN×D obtained from the graph regularized integration module with the topological feature Y∈RN×D learned from the knowledge graph embedding. The iAFF updates the feature representation iteratively and uses the Multiscale Channel Attention Module (MS-CAM) to learn feature information with different scale in each channel and calculate the attention weight of each channel feature. These attention weights are multiplied element-wise with the original features to achieve channel-level feature enhancement. As shown in
留言 (0)