Patient samples collection
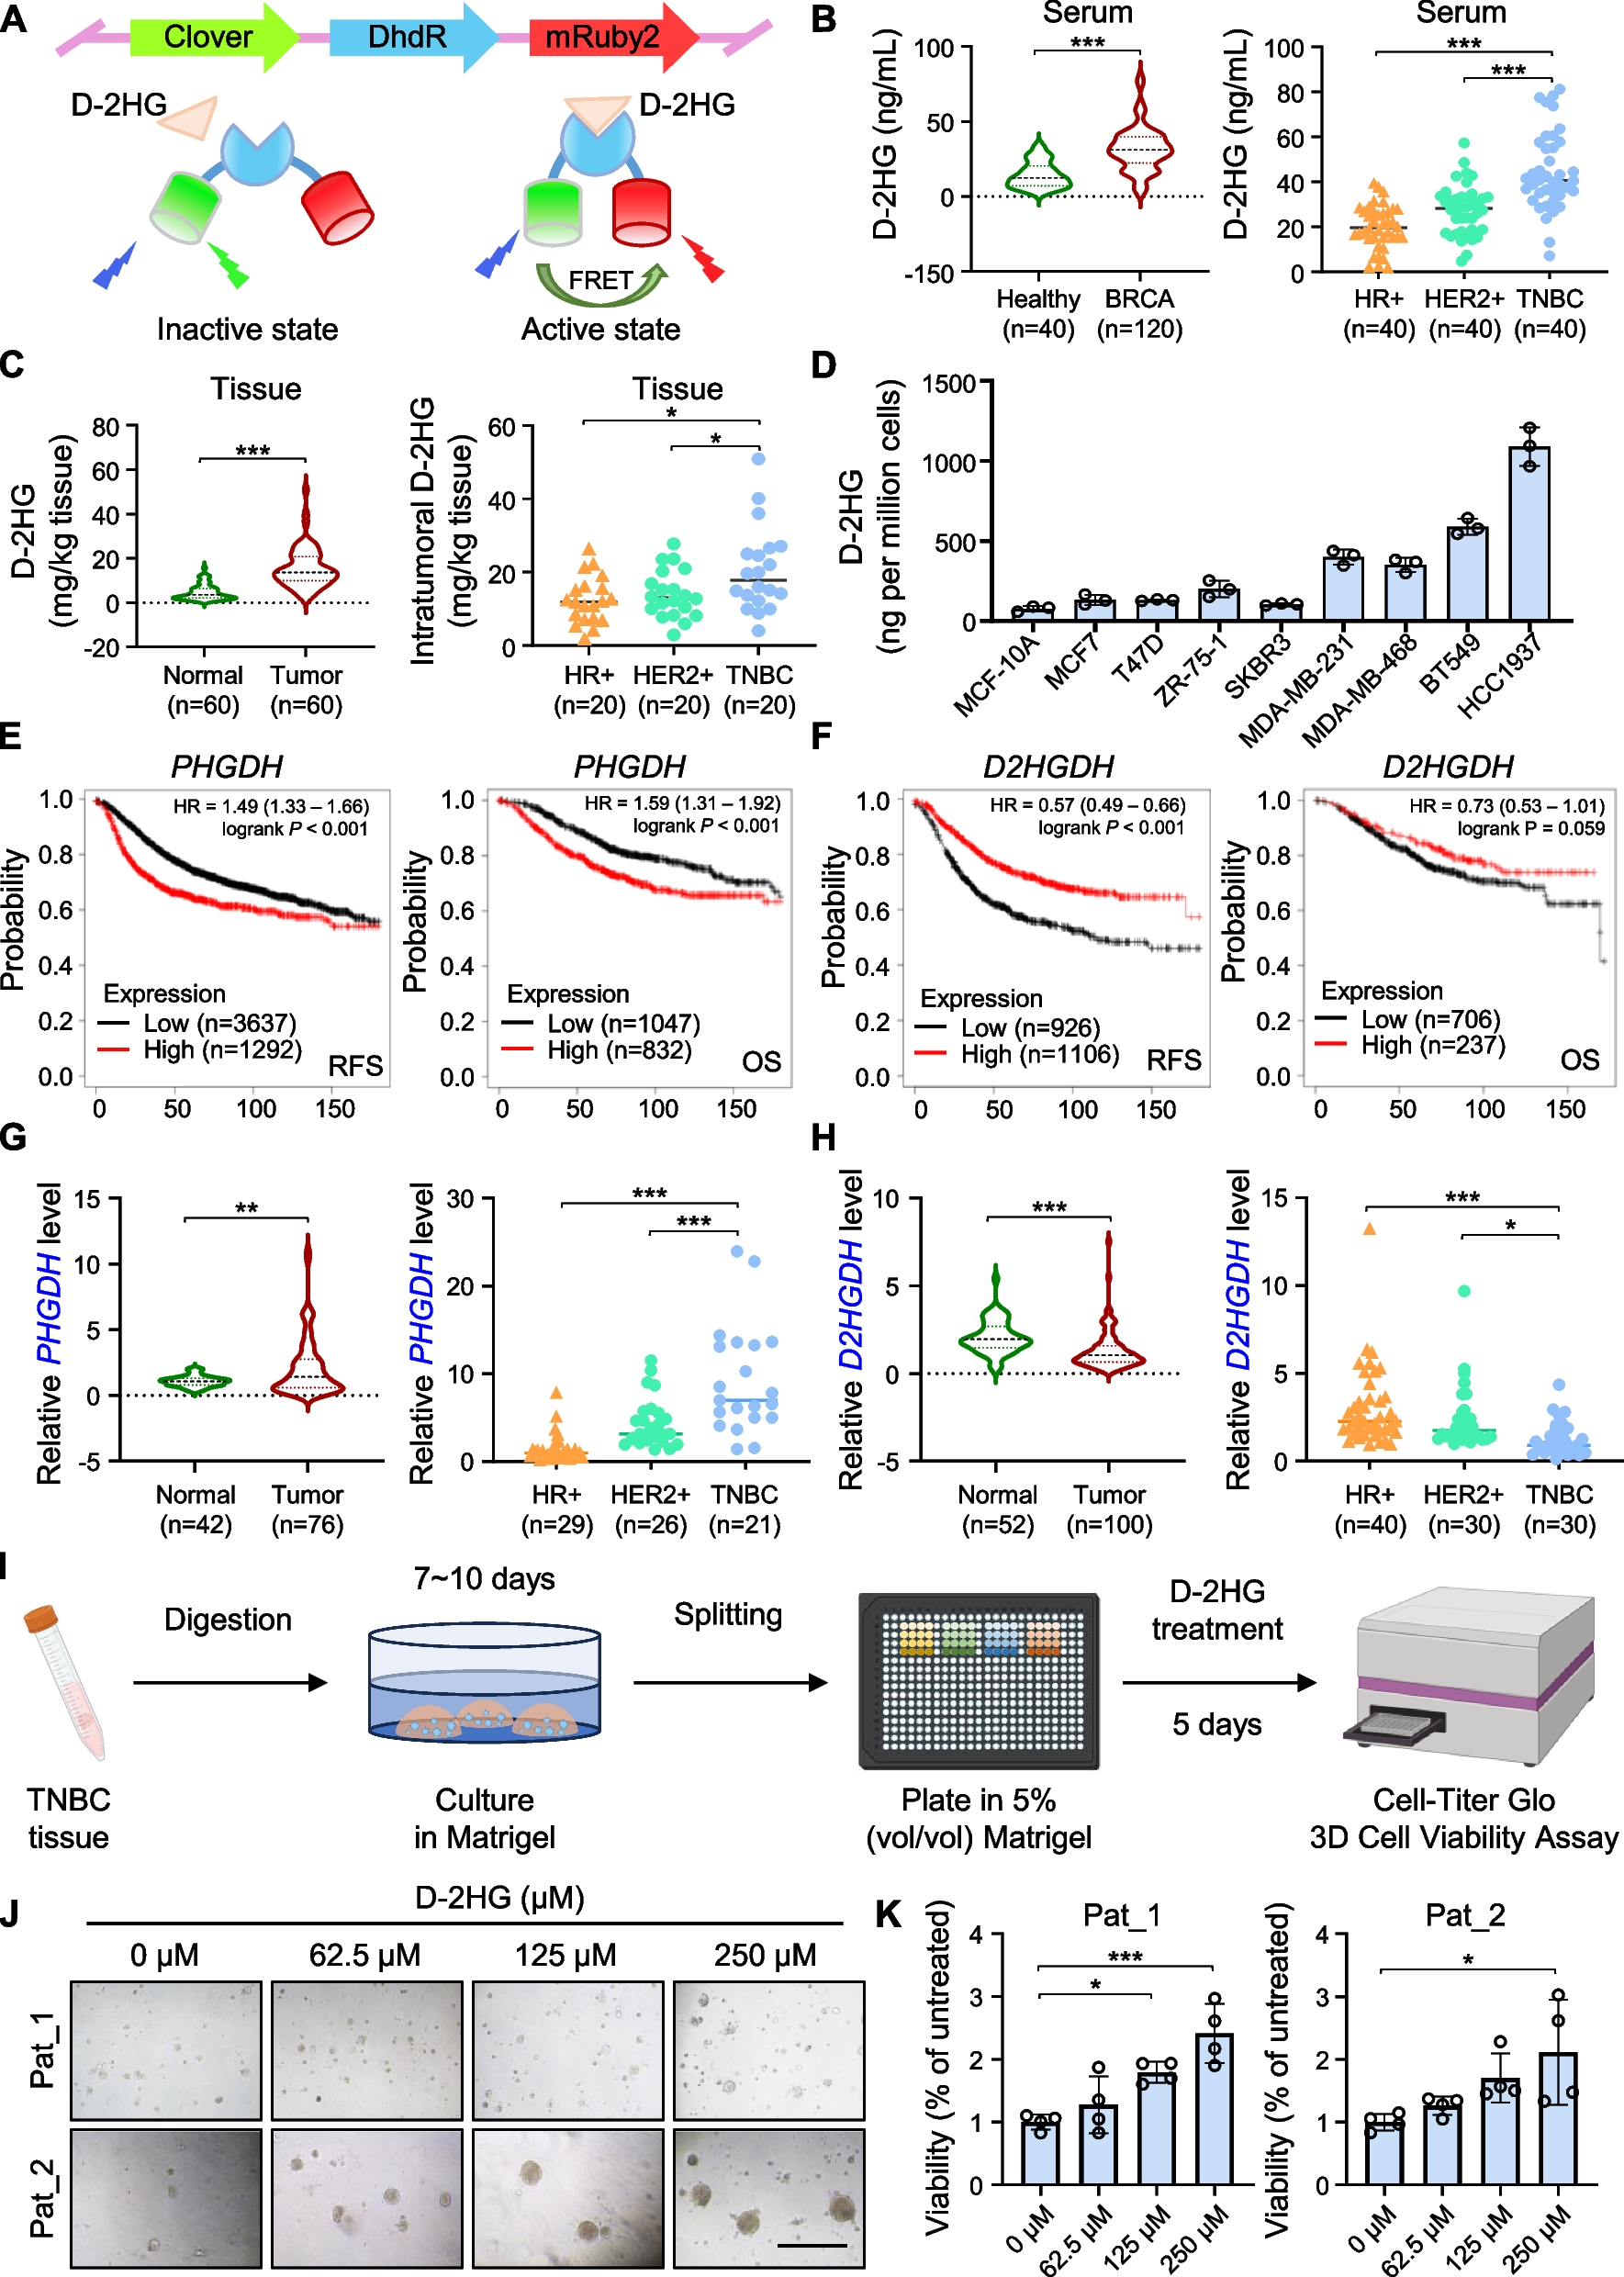
Serum samples from healthy individuals and patients with breast cancer were collected from Qilu Hospital. All tumor tissues, and adjacent non-cancerous tissues were collected from surgically treated patients diagnosed with breast cancer and stored at − 80 °C until use.
Patient-derived organoids and treatment
Fresh TNBC tissues were minced into fragments of 1–3 mm3 using surgical scalpels on ice, followed by digestion for an hour at 37 °C with gentle shaking in a DMEM/F12 (Macgene)-based digestion medium supplemented with 200 U/mL collagenase I and III (Worthington), 1% BSA (Sigma-Aldrich), 100 μg/mL Primocin (Invivogen), 1 × ITS Supplement (Sigma-Aldrich), 10 mM HEPES, 50 U/mL hyaluronidase (Worthington) and 5 μM Y-27632 dihydrochloride (Sigma-Aldrich). The digested tissues were filtered and centrifuged. The pellets were resuspended and washed once by digestion termination solution (DMEM/F12 supplemented with 0.1% BSA and 100 μg/mL Primocin). To lyse the erythrocytes, the pellets were resuspended and washed once by TAC buffer. Then the cell pellets were washed twice with the digestion termination solution and centrifuged at 300 g for 5 min at 4 °C. Aspirate the supernatant and quickly resuspend the pellet in the growth factor reduced Matrigel on ice. Matrigel containing organoids was seeded on the bottom of pre-heated 48-well culture plate. The culture plate was placed into a humidified incubator at 37 °C and 5% (vol/vol) CO2 for 30–60 min to solidify the Matrigel and then overlaid with 300 μl pre-warmed organoid culture medium (bioGenous) to each well. The medium was changed every 2–3 days carefully aspirating medium from the wells and replacing it with fresh, pre-warmed medium. Two weeks later, organoids were passaged with TrypLE (Gibco) for digestion and were re-plated in 384-well screen plates. For determining the effection of D-2HG, the organoids were with different concentration of D-2HG for 5 days, followed by cell viability detection with CellTiter-Glo 3D reagent.
Cell culture and treatment
Human cell lines, including HEK-293T and various breast cancer cell lines (MCF7, T47D, ZR-75–1, SKBR3, MDA-MB-231, MDA-MB-468, BT549, HCC1937), and MCF-10A (the normal mammary epithelial cell line), were purchased from ATCC. Cell lines were verified by STR Profiling and tested for mycoplasma contamination. HEK-293T, MCF7, MDA-MB-231, MDA-MB-468, BT549 cells were cultured in high glucose DMEM (Macgene). SKBR3 cells were cultured in McCoy's 5A medium (Macgene). T47D, ZR-75-1, and HCC1937 cells were maintained in RPMI-1640 (Macgene). MCF-10A cells were cultured by purchased specific complete medium (Pricella). To isolate mouse primary peritoneal macrophages, peritoneal exudate cells were collected from 4- to 6-week-old C57BL/6 J mice which had been intraperitoneally injected with 3% Brewer’s thioglycolate broth three days earlier and incubated high glucose DMEM (Macgene). Following a 2-h incubation, the medium was changed, and the adherent cells forming the monolayer were utilized as primary peritoneal macrophages for the subsequent experiments. All media contained 10% fetal bovine serum (Gibco), 100 U/ml penicillin (Macgene), and 100 μg/ml streptomycin (Macgene) and cell lines were incubated at 37 ℃ with 5% CO2. Cells were treated with D-2HG modified with octyl ester with membrane permeability at indicated concentrations.
Lentiviral production and infection
To generate FTO knockout cell lines, HEK-293T cells were initially transfected with lentiCRISPR V2-sgFTO and packaging plasmids (pMD2.G and pxPAX2) using PEI MAX (Polysciences) for lentivirus production. Subsequently, the recombinant lentiviruses were added into cells with 8 μg/ml polybrene (Santa Cruz). Stably expressed single clones were selected by puromycin resistance and validated by western blot.
Plasmids
YTHDF1 and ANGPTL4 expression plasmids were conducted based on pcDNA3.1 vector (Invitrogen). ANGPTL4 knockdown plasmids were cloned into pLKO.1 vector (Addgene). Point mutations of YTHDF1 and ANGPTL4 were constructed using the KOD-Plus-Mutagenesis kit (Toyobo). Sequencing provided confirmation for each construct.
Plasmid and siRNA transfection
All the plasmids, which include YTHDF1-WT, YTHDF1-Mut, ANGPTL4-WT, ANGPTL4-Mut, were transfected into cells by Lipofectamine 2000 (Invitrogen) according to the manufacturers’ instruction. Specific siRNAs of YTHDF1 and ANGPTL4 were synthesized by GenePharma Co., Ltd. (Shanghai, China). RFect siRNA/miRNA Transfection Reagent (Bio-trans) were used to transfect siRNA to cells according to the protocol. The sequences are listed in Supplemental Table 1.
D-2HG measurement
D-2HG measurement was performed using a highly sensitive D-2HG biosensor, which is based on the allosteric transcriptional factor DhdR as described in a previous study [18]. Briefly, serum, tissue supernatant, or cell pellet homogenate (post-centrifugation) were first diluted with a detection buffer containing the purified D-2HG biosensor. The diluted samples were then thoroughly mixed and transferred into a 384-well black plate. After a 10-min incubation at room temperature, the plate was measured using the microplate reader (Perkin Elmer), and the D-2HG concentrations in the samples were calculated using the emission ratio according to the normalized dose–response curve.
RNA isolation and qPCR
PrimeScript™ FAST RT reagent Kit (Takara) was applied to reverse transcribe RNA into cDNA after it had been extracted using RNAiso Plus reagent (Takara). The qPCR SYBR Green Mix (YEASEN) was then used, in accordance with the manufacturer's instructions, for quantitative PCR (qPCR) on a LightCycler® 480 real-time PCR system (Roche). The relative mRNA abundance was normalized to the reference gene ACTIN, and calculations were performed using the comparative Ct (− ΔCt) method. Primer sequences are provided in Supplemental Table 1.
Protein extraction and western blot
Transfected or treated cells were subjected to protein extraction, followed by lysis using RIPA buffer (Beyotime) containing the cocktail of protease and phosphatase inhibitors (Roche). The BCA protein assay kit (Millipore) was utilized to ascertain protein concentrations. Protein samples ranging from 10 to 30 μg were separated by 8% or 10% SDS-PAGE and transferred onto methanol-activated 0.22-μm PVDF membranes (Millipore). The membranes were blocked using 5% non-fat milk, and then subjected to an overnight incubation using certain primary antibodies, succeeded by matching secondary antibodies (Cell Signaling Technology). Detection was carried out using the ECL detection system (TECAN), with ACTIN and GAPDH serving as loading controls.
ELISA
Commercially available ELISA kits (Lianke Biotech) were used to quantify the amount of ANGPTL4 in serums and cell supernatants. The absorbance was recorded at 450 nm with a Perkin Elmer microplate reader. The concentrations of ANGPTL4 were computed using the standard curve as a guide.
H&E staining and immunohistochemistry
For H&E staining, paraffin-embedded lung tissues were sectioned at 5 µm thickness, deparaffinized in xylene, and rehydrated using a series of gradient ethanol. Slides stained with hematoxylin and eosin were mounted with coverslips and photographed under a Leica light microscope.
For IHC staining, the procedure was performed according to the protocol of M&R HRP/DAB detection IHC kit (Vazyme). Briefly, sections were deparaffinized as described, and then antigen was retrieved using Tris–EDTA buffer (pH 9.0). The sections treated with hydrogen peroxide blocking reagent were subsequently incubated with primary antibodies at 4 °C overnight. The following day, the sections were washed with PBS and treated with HRP polymer buffer at room temperature for 20 min, stained with diaminobenzidine, counterstained with hematoxylin, dehydrated, mounted with neutral resin, and observed by an Olympus microscope.
Cell proliferation assays
For the 3-(4,5-dimethylthiazol-2-yl)-2,5-diphenyltetrazolium bromide (MTT) assay, 1.5 × 10³ cells per well were cultured in 96‐well plates and subjected to the treatments specified in the figure legends. Each well received 20 µL of freshly made MTT solution (5 mg/mL in PBS) at the designated time periods, and the wells were incubated for 4 h. Afterward, each well received 100 µL of dimethyl sulfoxide (DMSO). The plates were gently shaken, and absorbance was measured at 450 nm using a microplate reader (Perkin Elmer).
For the 5‐ethynyl‐2’‐deoxyuridine (EdU) assay, 1 × 10⁴ cells per well were seeded in 96‐well plates. After being labeled with EdU solution, cells were cultured for 2 h at 37 °C. The cells were then fixed with 4% paraformaldehyde, permeabilized using 0.5% Triton X-100, stained with Apollo staining mixture, counterstained by Hoechst solution, and examined using a fluorescence microscope (ZEISS).
For the colony formation assay, 8 × 10² cells per well were cultured in 6-well plates. After overnight incubation, the cells were exposed to a range of D-2HG concentrations and left to incubate for a further two to three weeks. After 20 min of 100% methanol fixation, the colonies stained for 30 min with 0.75% crystal violet, and colonies containing over 50 cells were counted.
Transwell assays
To perform the migration assay, 6 × 10⁴ cells were transferred to the upper chambers (Corning) in 300 µL of starvation media, while 700 µL of culture medium with 20% FBS was added to the lower chamber. The migrated cells were proceeded by methanol fixation and crystal violet staining, and then were quantified under a microscope after 24–48 h. To perform the invasion assay, Matrigel (Corning) pre-coated chambers were utilized, and the following procedures can be referred to the migration assay.
Wound healing assay
2.5 × 10⁵ cell were seeded in a 12‐well plate. Once the confluent monolayer cells formed, a straight line was scraped across the monolayer using a 10 µL pipette tip. A phase-contrast microscope was used to observe the wound area at 0 and 24 h.
Mammosphere formation assay
6 × 10² cells were seeded into 96-well ultra-low attachment plates (Corning). The plates were incubated at 37 °C with 5% CO2 for two weeks until mammospheres became visible. The mammospheres were then photographed and counted using a microscope.
RNA-seq analyses
Total RNAs were extracted using RNAiso Plus reagent (Takara). RNA quality assessment, library preparation and sequencing were carried out at Novogene, Inc. (Tianjin, China). Raw reads were filtered using Trim Galore (v0.6.10) [19] and aligned to the hg38 genome with HISAT2 (v2.2.1) [20]. FeatureCounts (v2.0.6) [21] was employed to quantify reads based on the annotation file downloaded from the GENCODE database (v32, GTF format for human). Genes expressed in fewer than 75% of the total samples were removed from the expression matrix. Differentially expressed genes between D-2HG and DMSO groups were identified using DESeq2 (v1.40.2) [22] with thresholds of log2FoldChange > 1 and p < 0.05. ClusterProfiler (v4.8.2) [23] was applied for functional enrichment analysis.
Global RNA N6-methyladenosine analysis
The EpiQuik m6A RNA Methylation Kit (Epigentek) was used to assay the amount of m6A in total RNA. Briefly, 200 ng of total RNA and the binding solution were added to the wells for the experiment. The capture antibody solution, detection antibody solution, enhancer solution, developer solution, and stop solution were applied to each well in order specified procedures. Using a Perkin Elmer microplate reader, the relative m6A levels were calculated according to the absorbance at 450 nm.
m6A dot blot
To assess the global abundance of m6A modification, a dot blot assay was performed. Using the Dynabeads mRNA Purification Kit (Invitrogen), poly(A) + mRNA samples were purified and then denatured and spotted onto a nylon membrane (Amersham, GE Healthcare). The membrane was air-dried, cross-linked at 254 nm (SCIENTZ), and blocked with 5% non-fat milk. After overnight incubation with m6A antibody (Synaptic Systems), the membrane was washed with PBST and incubated with an HRP-conjugated anti-mouse antibody (Cell Signaling Technology), followed by exposure to ECL (Yeason) using a visualizer (Tanon). The membrane dyed with 0.2% methylene blue served as the loading control and was imaged accordingly.
N6-methyladinosine modification prediction
SRAMP (http://www.cuilab.cn/sramp) is a robust m6A site prediction tool that utilizes sequence-derived features and a machine learning framework [24]. Potential m6A sites in the human ANGPTL4 transcript were predicted using the full transcript mode, with the results listed in Supplementary Table 4.
RNA pull-down
Biotin-labeled single-stranded RNA (ssRNA) containing either methylated or unmethylated adenosine was synthesized by GenScript Biotech Corporation (Nanjing, China), with sequences provided in Supplementary Table 1. Briefly, 0.1 nmol of biotin-labeled ssRNA was incubated with 0.5 mg of magnetic beads (Vazyme) in binding buffer for 30 min at room temperature. The RNA-bound beads were incubated with 200 μg of MDA-MB-468 cell lysate overnight at 4 °C. The RNA-binding proteins were eluted with 1 × SDS buffer and analyzed by silver staining (Beyotime) or western blot. The m6A-binding proteins in the gel slices were sent to Lianchuan Bio (Hangzhou, China) for mass spectrometry analysis.
RNA–protein immunoprecipitation (RIP)–qPCR
The Magna RIP Kit (Millipore) was used to conduct the RIP assay to investigate the direct interaction between YTHDF1 and the ANGPTL4 transcript. In RIP lysis buffer, which also included RNase inhibitors and a cocktail of protease inhibitors, cells were lysed. After being coated with certain antibodies or IgG, Protein A/G magnetic beads were added into the cell lysate. The bead-antibody complex was rotated at 4 °C overnight. Protease K was used to digest the beads following washing with RIP washing buffer. The RNA from both the input and immunoprecipitated samples were isolated using 100% ethanol and phenol/chloroform/isoamyl alcohol (125:24:1). The RNA was then quantitatively analyzed by qPCR and agarose gel electrophoresis.
Methylated RNA immunoprecipitation (MeRIP)-seq and MeRIP-qPCR
The MeRIP assay was carried out using the riboMeRIP m6A Transcriptome Profiling Kit (Ribobio) with minor modifications. 300 µg of total RNA was purified with 3 M sodium acetate (pH 5.2) and 100% ethanol after being chemically fragmented into 100–150 nucleotide lengths using fragmentation buffer of which 1/10 was used as input and the remainder was incubated with magnetic beads conjugated with the anti-m6A antibody for 2 h at 4 °C. The methylated RNA was then eluted over 1 h at 4 °C and subsequently purified with 3 M sodium acetate (pH 5.2) and 100% ethanol. The immunoprecipitated RNA and input from each sample were used for further MeRIP-seq or qPCR analysis.
For MeRIP-seq, an Qsep100 Analyzer (BiOptic) was used to determine the RNA fragments and quality of both IP and rRNA depleted input samples (Ribo-MagOff rRNA Depletion Kit, Vazyme) prior to RNA library preparation using VAHTS Universal RNA-seq Library Prep Kit (Vazyme) and sequenced by Novogene (Tianjin, China). Reads from MeRIP-seq were first trimmed using Trim Galore (v0.6.10) [19] to remove adapters and low-quality sequences. Using Bowtie2 (v2.5.4) [25], the trimmed reads were then aligned to rRNA sequences (downloaded from the National Center for Biotechnology Information Nucleotide database) to retain unmapped read. HISAT2 (v2.2.1) [20] was then used to map the remaining reads to the human genome (hg38). To identify robust differential peaks between D-2HG and DMSO groups, fragment lengths of the BAM files were predicted using MACS2 (v2.2.8) [26], and these were subsequently used in MACS2 callpeak with the –nomodel option. After peak calling, Deeptools (v3.5.5) [27] and MACS2 bdgdiff were used together to identify differential peaks (log10(LR) > 4 and log2FoldChange > 2) between D-2HG and DMSO groups, which can be then annotated to protein coding genes. The m6A-enriched motifs in each group were identified using HOMER (v4.1.1) [28]. Additionally, the distribution of peaks from D-2HG and DMSO across various functional regions was determined using the Guitar R package (v2.16.0) [29]. The proportion of peaks in different functional regions was then visualized using ChIPseeker (v1.36.0) [30]. Finally, the results from RNA-seq and MeRIP-seq were integrated by identifying common genes for further analysis.
For the MeRIP-qPCR analysis, primers were designed based on the specific m6A modification sites predicted with “very high confidence” using the SRAMP. The relative m6A enrichment was calculated referring to the expression of the input RNA. Supplementary Table 1 contains a list of primer sequences that were employed.
MeCLIP-seq analysis
MeCLIP-seq fastq files were obtained from the GEO database (accession number GSE147440). The MeCLIP-seq analysis pipeline was executed using a Snakemake workflow developed by Justin et al. with default parameters [31]. The resulting BAM files were then converted to BigWig format using Deeptools bamCoverage with the options “–binSize 1 –normalizeUsing RPGC”. The m6A binding motif in ANGPTL4, along with both IP and input results from MeRIP-seq and MeCLIP-seq were visualized using the Integrative Genomics Viewer (v2.16.1).
mRNA stability assay
Actinomycin D (ActD, AAT Bioquest), a transcriptional inhibitor, was used to treat the cells for 0, 3, and 6 h. qPCR assay was used to measure the amounts of ANGPTL4 mRNA. The data were calculated using the comparative Ct (− ΔCt) method.
Polysome profiling assay
Confluent cells, transiently transfected with siNC or siYTHDF1, were cultured in 10 cm dish. Prior to being collected, cells were exposed to a 10-min treatment of 100 μg/mL cycloheximide (CHX, Sigma-Aldrich). Following lysing the cells on ice, the lysate was centrifuged. Onto a gradient of 10/50% w/v sucrose, the supernatant was loaded, followed by centrifugation at 4 °C for 3 h at 36,000 rpm using a Beckman SW41 Ti rotor. After that, the sample was divided into fractions and examined using a fraction collector (FC203B, Gilson) and a Gradient Station (BioCamp) coupled with an ECONOUV monitor (BioRad). Total RNA from each fraction was isolated using RNAiso Plus reagent (Takara) for subsequent qPCR analysis of the ANGPTL4 transcript.
Flow cytometry
Tumors were isolated from mice, minced, and incubated for one hour at 37 °C in RPMI-1640 media with 1 mg/mL collagenase I (Worthington) and 0.2 mg/mL DNase I (Sigma-Aldrich). Single-cell suspensions were obtained after filtration using cell stainers (70 μm, Corning). Single-cell suspensions were incubated with Fc receptor blocking buffer (Anti-Mouse CD16/32 Antibody, Elabscience) for 15 min at 4 °C, followed by labeling on ice for 60 min with anti-CD86 (Elabscience), anti-CD206 APC (Elabscience), and anti-F4/80 FITC (Elabscience). The samples were washed, resuspended in FACS buffer (2% FBS in PBS), and analyzed on a flow cytometer. FlowJo software was used to analyze the data.
Immunofluorescence
Cells seeded on glass cover slides were fixed with 4% paraformaldehyde followed by permeabilization using 0.4% Triton X‐100. After one-hour 5% BSA blocking, the cells were incubated with specific primary antibodies overnight at 4 °C, and subsequently stained with Alexa Fluor-labeled secondary antibodies (ZSBG-BIO) for 2 h at room temperature in the dark. The ProLong Diamond reagent (Invitrogen) was used to mount the slides. Fluorescence photos were captured and processed by fluorescence microscope (ZEISS).
In vivo tumorigenesis and metastasis assays
Six-weeks female BALB/c nude mice were acquired from Beijing Vital River Laboratory Animal Technology Co., Ltd. (Beijing, China). Mice were housed in specific pathogen-free (SPF) animal facilities at the Laboratory Animal Center of Qilu Hospital, Shandong University.
Subcutaneous injection was performed on thigh of nude mice using 5 × 10⁶ MDA-MB-231 or 5 × 10⁵ 4T1-Luc cells that had been resuspended in 150 μl PBS. After the average size of the subcutaneous tumors was 50 mm3, the mice were split into two equal subgroups at random. One subgroup received intraperitoneal injections of D-2HG at a dosage of 250 mg/kg for the indicated duration, while the other subgroup received an equal volume of vehicle control solution.
For the in vivo metastasis assay, intravenous injections were performed into the tail vein using either 1 × 10⁵ 4T1 cells or 5 × 10⁵ MDA-MB-231 cells. After three weeks, all mice were randomly divided into two equal subgroups. One subgroup was treated with intraperitoneal injections of D-2HG at a dosage of 250 mg/kg every three days for the indicated duration, while the other subgroup received an equal volume of vehicle control solution. After forty days, metastasis was monitored using IVIS imaging. After the mice were sacrificed, their lungs were taken out for further examination.
Statistical analysis
Student's t-test was utilized for comparing two groups, while one-way ANOVA was employed for comparing multiple groups. Statistical analyses were carried out using GraphPad Prism 9 and OriginPro 2023 software. Data were expressed as mean ± SD, with p < 0.05 indicating statistical significance.


留言 (0)