Patient cohorts and samples
This study utilizes human airway transcriptomic data from two separate cohorts of individuals with COPD in different cities in China. Specifically, the discovery cohort consisted of 70 patients with stable COPD and 18 healthy controls, from whom induced sputum samples were collected at the First Affiliated Hospital of Guangzhou Medical University in Guangzhou. The validation cohort included 24 patients with stable COPD and 18 healthy controls, from whom induced sputum samples were obtained at Shenzhen People’s Hospital in Shenzhen. The inclusion and exclusion criteria were described in previous study [13]. The study was approved by the ethics committee of two centers (reference no. 2017–22 and KY-LL-2020294-01). The inclusion criteria for patients with COPD consisted of being over the age of 40 and having a confirmed diagnosis of COPD based on the GOLD guideline. Specifically, a post-bronchodilator forced expiratory volume in 1 s (FEV1)/forced vital capacity ratio < 0.7. The exclusion criteria were: (1) a diagnosis of known respiratory disorders other than COPD; (2) COPD exacerbation within 4 weeks of enrolment; (3) history of lung surgery and tuberculosis; (4) diagnosis of cancer; (5) blood transfusion within 4 weeks of enrolment; (6) diagnosis of autoimmune diseases; (7) enrolment in a blinded drug trial; and (8) antibiotic usage within 4 weeks of enrolment. All participants provided written informed consent.
The chest CT data in Guangzhou cohort and Shenzhen cohort were imported separately into workstations of the VIDA software (version 2.2, Apollo; VIDA Diagnostics, Coralville, IA, USA) and NeuLungCare-QA (version 1.0, Neusoft Medical Systems Co., Ltd. Shenyang, Liaoning, China) to automatically analyze the extent of emphysema (LAA950%).
Murine model
To establish an emphysema model, male Bagg Albino (BALB/c) mice, aged 6 weeks and weighing 25–30 g, were procured from Gem Phamatech Co., Ltd., located in Guangdong, China. In order to mitigate agonistic behavior and prevent the occurrence of diseases, appropriate measures were implemented for the care of animals. Specifically, all mice were accommodated in a pathogen-free animal facility, where they were housed in isolated cages that provided sufficient ventilation. Additionally, a 12-h light/dark cycle was maintained, and the mice were given unrestricted access to food and water. It is important to note that all experiments conducted in this study were approved by the Animal Subjects Committee of Shenzhen People’s Hospital (AUP-220714-CRC-0599-01).
Establishment of a model with emphysema
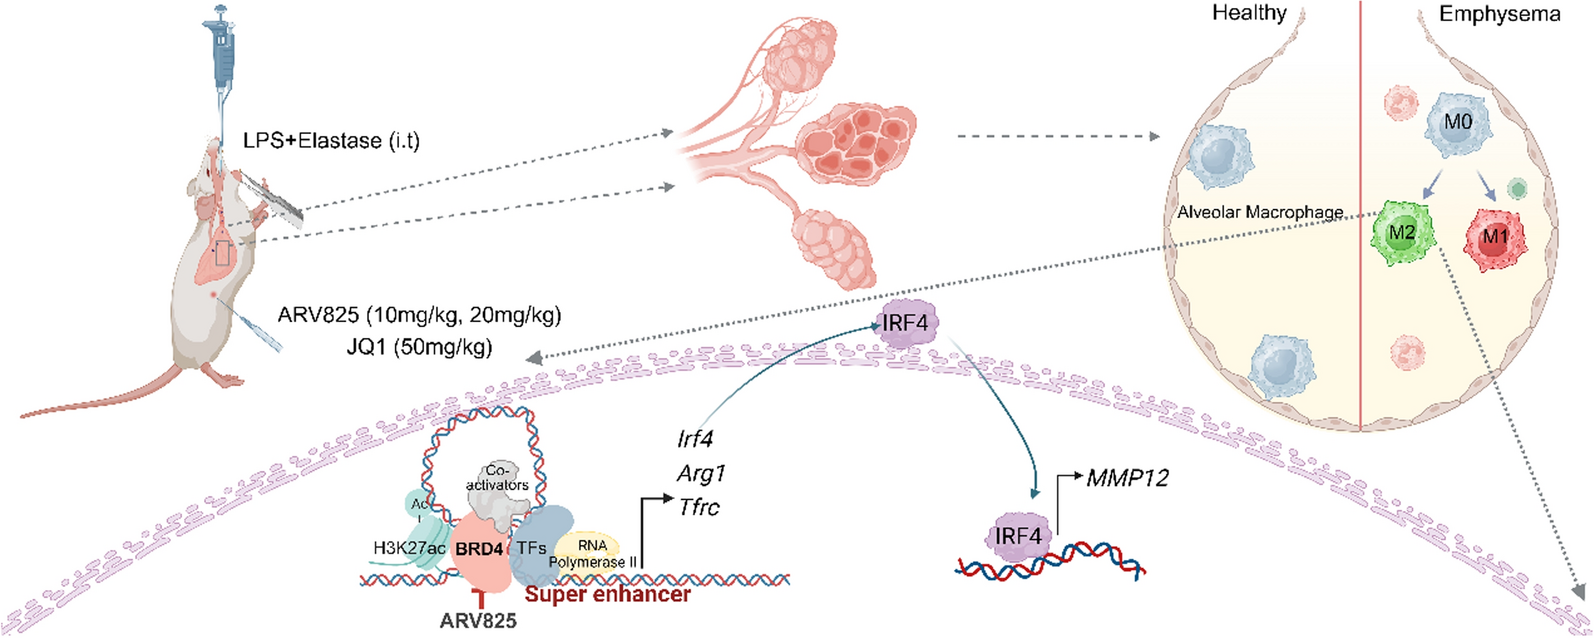
The BALB/c mice were administered intratracheal instillation of a mixture containing 7 ug LPS purified from Escherichia coli O26:B6 (Sigma-Aldrich, St. Gallen, Switzerland) and 1.8 U of porcine pancreatic elastase (Elastin Products Company, Owensville, MO) in 50-μL PBS for a total of four times. Following each exposure to LPS/elastase, subgroups of mice were intraperitoneally injected with either the BRD4 inhibitor JQ1 (50 mg/kg), the BRD4 degrader ARV-825 (10 and 20 mg/kg), or a control Vehicle on days 14, 17, 21, 24, 28, and 31 [26].
Lung histopathology
The left lungs of all mice were aseptically collected and subsequently fixed in 4% paraformaldehyde overnight. The following day, the lung tissues were embedded in paraffin and sectioned into 4-um thickness. The selection criteria for the mouse sections were as follows: (1) The sections could display structures such as airways and alveoli; (2) The thickness of the sections was consistent. These sections were then H&E stained, sealed, and scanned at 40 × magnification using a multifunctional pathology scanner. The mean linear intercept (MLI) of the mouse sections was calculated. An average of five fields of view per section was selected, covering different areas of the lung tissue. The total length of all visible alveoli in these fields was measured using Aperio ImageScope software. The total length measured across the selected fields was then divided by the total number of observed alveoli to calculate the MLI for each mouse.
The degree of peri-bronchial inflammation was assessed using a scoring standard ranging from 0 to 4, as previously described [27]. In this scoring system, a score of 0 indicates the absence of inflammatory cells, while scores of 1, 2, 3, and 4 represent the presence of occasional, one layer, two layers, and more than two layers of inflammatory cells around the bronchi, respectively.
Lung function analysis in the emphysema model mice
The Forced Pulmonary Maneuver System (Buxco Research Systems, Wilmington, North Carolina, USA) was employed in accordance with the manufacturer’s guidelines to assess fluctuations in lung function. The respiratory rate of anesthetized mice was standardized to an average of 150 breaths per minute. The study involved the execution of three semiautomatic maneuvers: (a) Boyle’s law functional residual capacity (FRC), (b) quasi-static pressure volume (PV), and (c) fast flow volume (FV). The quasi-static PV maneuver was conducted to assess total lung capacity (TLC) and chord compliance (Cchord). Additionally, the fast FV maneuver was employed to measure forced expiration volumes (FEV50, FEV100, FEV200, and FEV300) in milliseconds, as well as forced vital capacity (FVC).
Bronchoalveolar lavage fluid (BALF) analysis
Following the extraction of blood, the trachea and right lung were subjected to in-situ lavage using a prewarmed sterile solution of 0.9% NaCl saline, with a volume of 0.5 mL. The fluid obtained from this procedure was then examined to determine the total cell count in the BALF and utilized for the preparation of cyto-spin samples. The enumeration of total inflammatory cells, macrophages, neutrophils, and lymphocytes in the BALF was conducted using a hemacytometer.
Protein extraction from lung tissues and western blotting
Total protein was extracted from lung homogenates and the protein concentration was determined using a BCA Protein Assay kit (Thermofisher, USA). Cell lysis was performed at a temperature of 100 °C for a duration of 10 min, followed by the loading of 20-μg of protein into a 10% SDS-PAGE gel. Subsequently, the protein was transferred onto a PVDF membrane (Merck Millipore, Bedford, MA, USA) and incubated overnight at 4 °C with antibodies against BRD4 (1:1000; A301985A100, Thermo-fisher, USA) and β-actin (1:3000; AB2001, AB Ways). The next day, following three rounds of washing with PBST, the samples underwent incubation with anti-rabbit-IgG horseradish peroxidase-conjugated secondary antibodies (CST, USA). Subsequently, the signals were detected through enhanced chemiluminescence (Merck Millipore, Bedford, MA, USA) and recorded using a Chemi Doc™ MP Imager (Bio-Rad, USA). The Image J program was utilized to measure the integral optical density of each sample.
Immunofluorescence staining
The lung sections were subjected to overnight incubation at 4 °C with antibodies against CD68 (GB113109, Servicebio) and BRD4 (AB128874, Abcam). Subsequently, the lung sections were exposed to a fluorescein isothiocyanate-labeled secondary antibody (GB22303, Servicebio) at room temperature for a duration of 1 h. Furthermore, DAPI (G1012, Servicebio) was employed for nuclear staining, and anti-fluorescence quenching sealer (G1401, Servicebio) was administered. The visualization of staining was carried out using an inverted fluorescence microscope (Servicebio).
Isolation and culturing of alveolar macrophages
The mice underwent tracheal lavage with 1 ml of PBS seven times to obtain BALF. BALF cells were isolated by centrifugation at 1500 rpm for 10 min and subsequently washed with PBS. To promote cell adherence, 12-well plates were utilized, with each well containing 3 × 10⁵ cells, and were incubated for 12 h. Following incubation, the plates were washed twice with PBS to eliminate non-adherent cells. The adhered cells were cultured overnight in a solution containing 20 ng/mL IFN-γ (C746, Novo protein) and 1 μg/mL LPS (Sigma-Aldrich, St. Louis, MO, USA) to induce M1 polarization. Additionally, 20 ng/mL interleukin-4 (CK15, Novo protein) was used to induce M2 polarization. The M1 and M2 macrophages were subsequently harvested for quantitative PCR analysis, while the supernatant was collected for ELISA.
RNA extraction for qPCR analysis and RNA-seq followed analysis
Induced sputum samples were collected and preformed with good quality control as previously described [13]. Transcriptomic data from sputum cells for RNA-sequencing were obtained by using the Illumina NovaSeq platform. The normalized gene count matrix was used to next transcriptomic analysis as described [13]. For a full set of transcriptomic data see the previous report [13]. Differentially expressed genes (DEGs) data from sputum cells analysis was performed using limma in R vegan package, among genes in BET protein family, MMP12 and IRF4. Genes in BET protein family consists of BRD1, BRD2, BRD3, BRD4, BRD7, BRD8, BRD9. Sets of M1 and M2 genes were based on selected classic genes in human expression publications. M1 markers includes 18 genes (NOS2, IL1A, IL1B, IL6, IL12B, TNF, CXCL1, IL1F9, CXCL2, CXCL9, CXCL10, CCL2, IRF5, IRF7, IRF9, STAT1, P65, SPI1). M2 markers includes 12 genes (ARG1, MRC1, STAT6, IRF4, MMP12, ADAM8, ADAM9, IL10, CCL17, CCL22, TGFB1, TFRC). Gene Set Variation Analysis (GSVA) was used to calculate the enrichment score (ES) for each patient and for gene signatures of macrophages and neutrophils. ES values range from − 1 to 1. A linear model for transcriptomic data with Benjamini–Hochberg false discovery rate (FDR) correction was used in the analysis of the DEGs and for GSVA. Spearman Correlation between genes and genes, genes and clinical parameters, genes and ES were calculated.
In order to perform cells and animal model qPCR analysis, total RNA was extracted from AMs using a UNIQ-10 Column Total RNA extraction Kit (IA24KA6842, Sangon Biotech, China). RNA isolation from lung homogenates of LPS/elastase-induced COPD model was performed using the Spin Column Animal Total RNA Purification Kit (HA14KA1972, Sangon Biotech, China). gDNA was removed, and total RNA was reverse transcribed into cDNA using PrimeScript™ RT reagent Kit supplemented with gDNA Eraser (RR047A, TAKARA, China). qPCR was performed using TB Green® Premix Ex Taq™ II (Tli RNase H Plus) (RR820A, TAKAR, China) on a CFX Connect™ Real-Time PCR system (BIO-RAD, USA). The sequences of primers used were shown in (Table 1).
Table 1 Primers used in the studiesTotal amounts and integrity of RNA from cells were assessed using the RNA Nano 6000 Assay Kit of the Bioanalyzer 2100 system (Agilent Technologies, CA, USA). The RNA-Seq library was prepared using NEBNext Ultra RNA Library Prep Kit for Illumina (NEB, USA). After the construction of the library, 150bp × 2 paired-end sequences were generated using the Illumina NovaSeq 6000 system at Novogene, Shenzhen.
For the RNA-seq analysis, raw reads were removed with the help of Trimmomatic v0.39 [28], and aligned to the mm10 mouse genome by Bowtie2 v2.2.5 [29]. Duplicate sequences were removed using MarkDuplicates v3.0.0 from Picard software (http://broadinstitute.github.io/picard/). Gene expression level was quantified by Salmon v0.12 [30] followed by normalization using trimmed mean of M-values (TMM) method in edgeR v3.32.1 [31]. DEGs analysis among all groups was performed using edgeR’s glmQLFTest. Significant DEGs were identified using a fold change > 1.5 and FDR < 0.05. Further, Gene Ontology and gene set enrichment analyses were performed using clusterProfiler v3.18.15 [32] and GSEApy v0.10.46 [33], respectively, to investigate the biological functions of DEGs. Heatmaps were generated with the help of ComplexHeatmap v2.6.27 to visualize the expression level of DEGs.
Cleavage under target and tagmentation (CUT and tag)-seq assay
CUT & Tag-seq assay were performed by using NovoNGS® CUT&Tag® 4.0 High-Sensitivity Kit (for Illumina®) (N259-YH01-01B, Suzhou, China). 50,000 alveolar macrophages were bound by ConA-magnetic beads and were resuspended in primary antibody buffer (containing protease inhibitor cocktail, 5% digitonin and primary antibody BRD4 (1:100; A301985A100, Thermo-fisher, USA) overnight at 4 °C. After washing, AMs were incubated with a secondary antibody (1:200) at room temperature for 1 h. After washing again, AMs were incubated with transposome buffer at room temperature for 1 h and tagmentation buffer at 37 °C for 1 h respectively. And termination of tagmentation was performed by adding stop buffer at 50 °C for 10 min. Finally, DNA fragments were extracted by adding Tagment DNA extract beads. Amplified and cleaned DNA fragments were used for sequencing at the Illumina platform.
CUT&tag sequencing data analysis
Raw reads were trimmed and aligned to mm10 mouse genome as aforementioned mentioned. SEACR peak caller v1.3 with default parameters was employed to identify the binding peaks of BRD4 and H3K27ac [34]. Differential peaks between groups were caculated using DiffBind v3.8.4 [35], and the genomic region and genes around peaks were annotated by ChIPseeker v1.34.1 [36]. The coverage of reads for each genome bin of 50 bp was quantified and standardized to counts per million (CPM) using bamCoverage function of deepTools v3.5.1 [37]. Further, R v4.1.0 was employed to construct heatmaps enriched around transcription start sites (TSS), and visualized using EnrichedHeatmap v1.28.1 [38]. A binding density plot of gene body and enhancer regions was generated using ngsplot v2.61 [39]. The identification of super-enhancers (SEs) was carried out by initially combining H3K27ac and BRD4 binding peaks with the help of mergeBed [40]. Following this, the ROSE algorithm was employed to compute enriched H3K27ac signals within 12.5 kb windows surrounding the merged binding sites. By ranking these stitched enhancer regions based on the H3K27ac signal, SEs were identified, and associated target genes were annotated [41]. Genomic signal tracks of desired genes were visualized in IGV browser v2.15.4 [42].
Overexpression experiment
Primary AMs were isolated from mice. The cells were cultured in antibiotic-free growth medium supplemented with 10% fetal bovine serum (FBS) (BioWest). All cells were cultured in a humidified incubator containing 5% CO2 at 37 °C. For gene overexpression, the full-length mouse Irf4 sequence was cloned into a pReceiver-M02 Expression Clone (GeneCopoeia) which were transfected into cells using Lipofectamine 3000 reagents and Opti-MEM (Thermofisher) reagents.
Statistical analysis
Data were tested for normal distribution and homogeneity of variance. Differences were assessed with t test between 2 groups, and one-way analysis of variance (ANOVA) accompanied by Bonferroni’s difference post hoc test for ≥ 3 groups. Data are presented as mean ± SEM. p < 0.05 was regarded as statistically significant.


留言 (0)