
記住我

In this study, we obtained plasma samples and clinical data from COVID-19 patients admitted to two hospitals in The Netherlands: the University Medical Center Groningen (UMCG) and Amphia Hospital in Breda, as described previously [15, 16]. The inclusion periods were as follows: March 6, 2020, to April 3, 2020, at Amphia Hospital (1st wave); April 24, 2020, to June 6, 2020, at UMCG (1st wave); and September 28, 2020, to December 3, 2020, at UMCG (2nd wave). Patients admitted to the general ward were classified as having ‘severe COVID-19,’ while those admitted to the ICU were classified as having ‘critical COVID-19.’ Plasma samples were collected within 48 h of admission for patients with severe COVID-19 and within 72 h of ICU admission for critical COVID-19 patients (Fig. 1). Additional plasma samples were collected during ICU stay, including before ICU discharge, for patients who were transferred to the general ward or those who died in the ICU. Additionally, plasma was collected from patients shortly before they left the general ward and were discharged from the hospital.
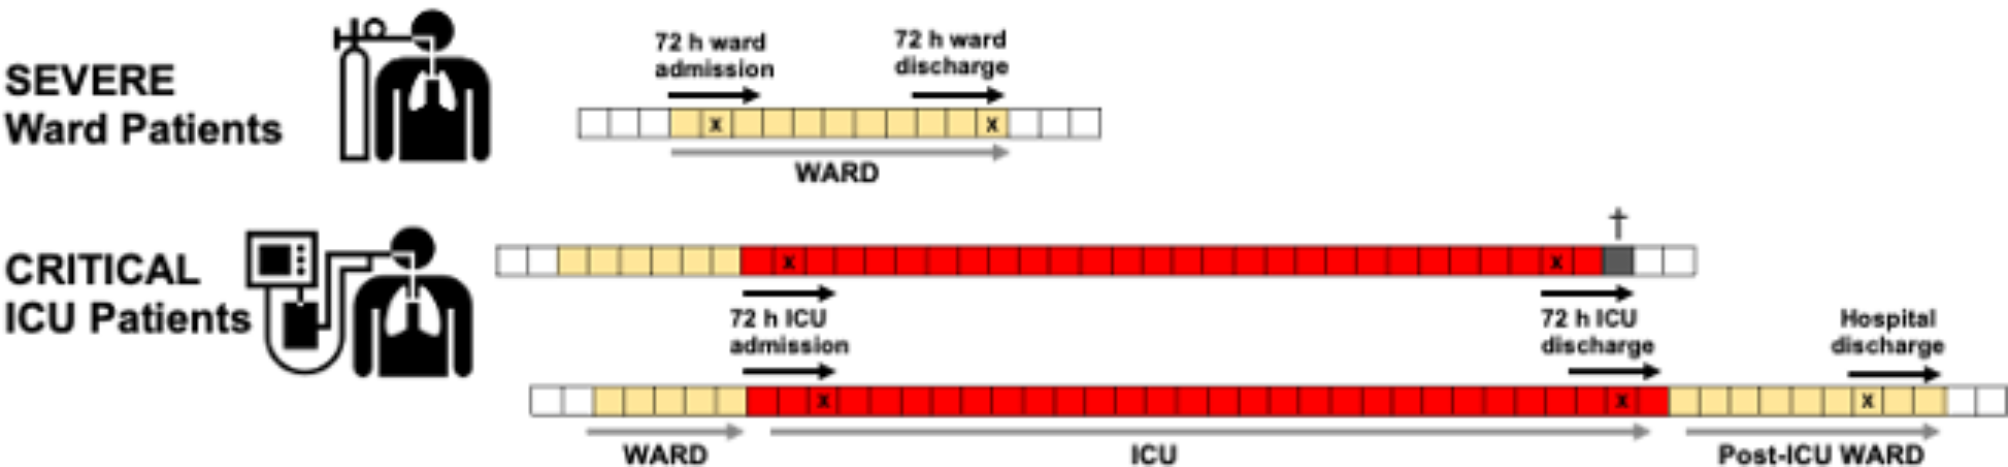
Fig. 1
Study design. Plasma was collected from severe COVID-19 patients as early as possible within 48 h of ward admission and again within 72 h prior to hospital discharge. For critical COVID-19 patients, plasma was collected as early as possible within 72 h of ICU admission and again as late as possible within 72 h prior to ICU discharge (or death). When feasible, an additional sample was collected near hospital discharge. The clinical course is represented by squares, with each square denoting a day. Yellow squares indicate the ward stay, red squares indicate the ICU stay, grey box indicates death, and “X” marks the timing of plasma sampling and measurement during hospitalization
Severe and critical COVID-19 patientsSARS-CoV-2 infection of patients included in this study was confirmed by RT-PCR analysis of oropharyngeal and nasopharyngeal swabs. Patients received treatment based on local COVID-19 protocols. Routine ICU care involved high-dose anticoagulation with low-molecular-weight heparin (LMWH) (87 IE/kg twice daily) and selective digestive tract decontamination. During the first wave, chloroquine was part of the standard treatment for ward and ICU patients until the Netherlands National Institute for Public Health and Environment recommended the discontinuation of its use by the end of March 2020. Starting in July 2020, all patients admitted during the second wave who required supplemental oxygen therapy were administered dexamethasone 6 mg daily, and some patients also received remdesivir. None of the hospitalized COVID-19 patients had received the SARS-CoV-2 vaccine. Acute kidney injury (AKI) was defined according to the Kidney Disease: Improving Global Outcomes (KDIGO) criteria [17], which consider changes in serum creatinine levels and urine output. Patients were defined as having liver dysfunction if they had one of the following: clinical jaundice, Hyperbilirubinaemia (blood bilirubin level twice the upper limit of the normal range), or an increase in alanine transaminase (ALT) or aspartate transaminase (AST) that is twice the upper limit of the normal range. The requirement for informed consent was waived as the analyses were performed using residual plasma samples collected for clinical purposes. This study was approved by the local medical ethical committee of the University Medical Center Groningen under METc 2020/492, and the Medical Research Ethics Committees United under W20.248, and the Central Research Committee Amphia Hospital under N2020-0380). Clinical trial number: not applicable.
Data CollectionClinical and demographic data were extracted from the electronic medical records of hospitalized patients. This information included age, sex, body mass index (BMI), medical history, and the clinical course of COVID-19 during hospital admission. A modified version of the World Health Organization (WHO) electronic Case Report Form (eCRF) was utilized to record data within the Clinical Database Infrastructure Research Electronic Data Capture (REDCap) system.
Plasma ECM neo-epitope analysisResidual heparinized plasma was collected from all hospitalized patients immediately after routine analysis and stored at -80 °C until biomarker analysis. Patients with severe and critical COVID-19 included in our cohort were admitted to either the general ward or the ICU approximately 8–10 days after the onset of initial COVID-19 symptoms. Neo-epitopes were quantified using specific competitive enzyme-linked immunosorbent assays (ELISA) and competitive immunoassays on an automated platform (IDS i10), utilizing neo-epitope-specific monoclonal antibodies developed by Nordic Bioscience (Herlev, Denmark). These assays were designed to detect specific MMP-mediated degradation fragments of type III collagen (nordicC3M), type IV collagen alpha 3 chain (nordicC4Ma3), and type VI collagen alpha 1 chain (nordicC6M). Additionally, assays measured ADAMTS-2 mediated release of the N-terminal pro-peptide of type III collagen (nordicPRO-C3), an internal 7 S domain of type IV collagen (nordicPRO-C4), and the C-terminal type VIa3 collagen (nordicPRO-C6, endotrophin). The assays were performed using nordicC3M™, nordicC4Ma3™, nordicC6M™, nordicPRO-C3™, nordicPRO-C4™, and nordicPRO-C6™ kits (Nordic Bioscience) as previously described [18,19,20,21,22]. Concentrations of the ECM fragments were within the range of detection. The rate of change in circulating ECM fragment levels over ICU duration was calculated by determining the difference in protein concentration at ICU admission and ICU discharge and dividing by the ICU length of stay in days. For each ECM fragment (F), the rate of change ΔF=(F[ICU discharge]-F[ICU admission])/days in ICU.
Multi-analyte plasma analysisResidual heparinized plasma samples were collected from all hospitalized patients immediately after routine clinical analysis and stored at -80 °C until biomarker assessment. Patients with COVID-19 included in the cohort were admitted to either the general ward (severe COVID-19) or ICU (critical COVID-19) approximately 8–10 days after symptom onset. Biomarker profiling was conducted using custom-made Human Luminex xMAP multiplex assays (R&D Systems, Abingdon, UK) following the manufacturer’s protocols. Measurements were performed on a Luminex 200 instrument (Luminex, Austin, TX, USA), and data analysis was completed using xPONENT v4.2 software (Luminex). The assessed biomarkers included markers of inflammation, endothelial dysfunction, coagulation, and organ injury. Concentration values below the lower detection limit were assigned the minimum quantifiable value, while values exceeding the upper detection limit were capped at the maximum quantifiable concentration. IL-2 values were mostly below the detection threshold, and CXCL10 values exceeded the upper limit; therefore, these proteins were excluded from further analysis. Previous findings suggested higher visfatin levels in critical COVID-19 patients compared to severe cases [15], but since many samples were below the detection threshold, visfatin was excluded from the current analysis. To monitor inter-assay variability, three of the seven calibration curve points prepared on the first day of measurement were aliquoted and stored at -80 °C. These aliquots were thawed and used as internal controls during each analysis day, and the analyte coefficient of variation (CV) was calculated as described previously [16].
Statistical analysisContinuous variables are expressed as median and interquartile range (IQR) values. The significance of differences between groups were assessed using the Mann-Whitney U test. The Kruskal-Wallis test was used to assess differences across multiple groups. Post-hoc comparisons were conducted using Dunn’s test to account for multiple comparisons. Categorical and dichotomous variables are presented as frequencies and percentages, and differences were evaluated using the chi-squared test and Fisher’s exact test. Spearman’s correlation test was employed to examine correlations between variables. Analyses were performed using SPSS Statistics version 28 (IBM Corp, Armonk, NY, USA) and GraphPad Prism version 10 (Graphpad, Boston, MA, USA). Statistical significance was set at P < 0.05.
留言 (0)