
記住我


NHANES is a cross-sectional study with data released in two-year cycles of the US civilian noninstitutionalized population, using a stratified, multistage sampling design. The program covers clinical, physical, laboratory examinations, as well as interviews to get diet and health indicators. Participants were first interviewed in their homes to collect background information, such as socio-demographic, medical, and family histories. They subsequently visited a mobile examination center for the collection of other pertinent data, including anthropometric, blood pressure, and laboratory measurements. Detailed information on the NHANES has been provided previously [18]. The NHANES protocol was approved by the National Center for Health Statistics Research Ethics Review Board, and all participants provided informed consent. Data accumulation was performed by the National Center for Health Statistics with approval from their ethics review board. All databases can be obtained from the NHANES website (https://wwwn.cdc.gov/nchs/nhanes/Default.aspx).
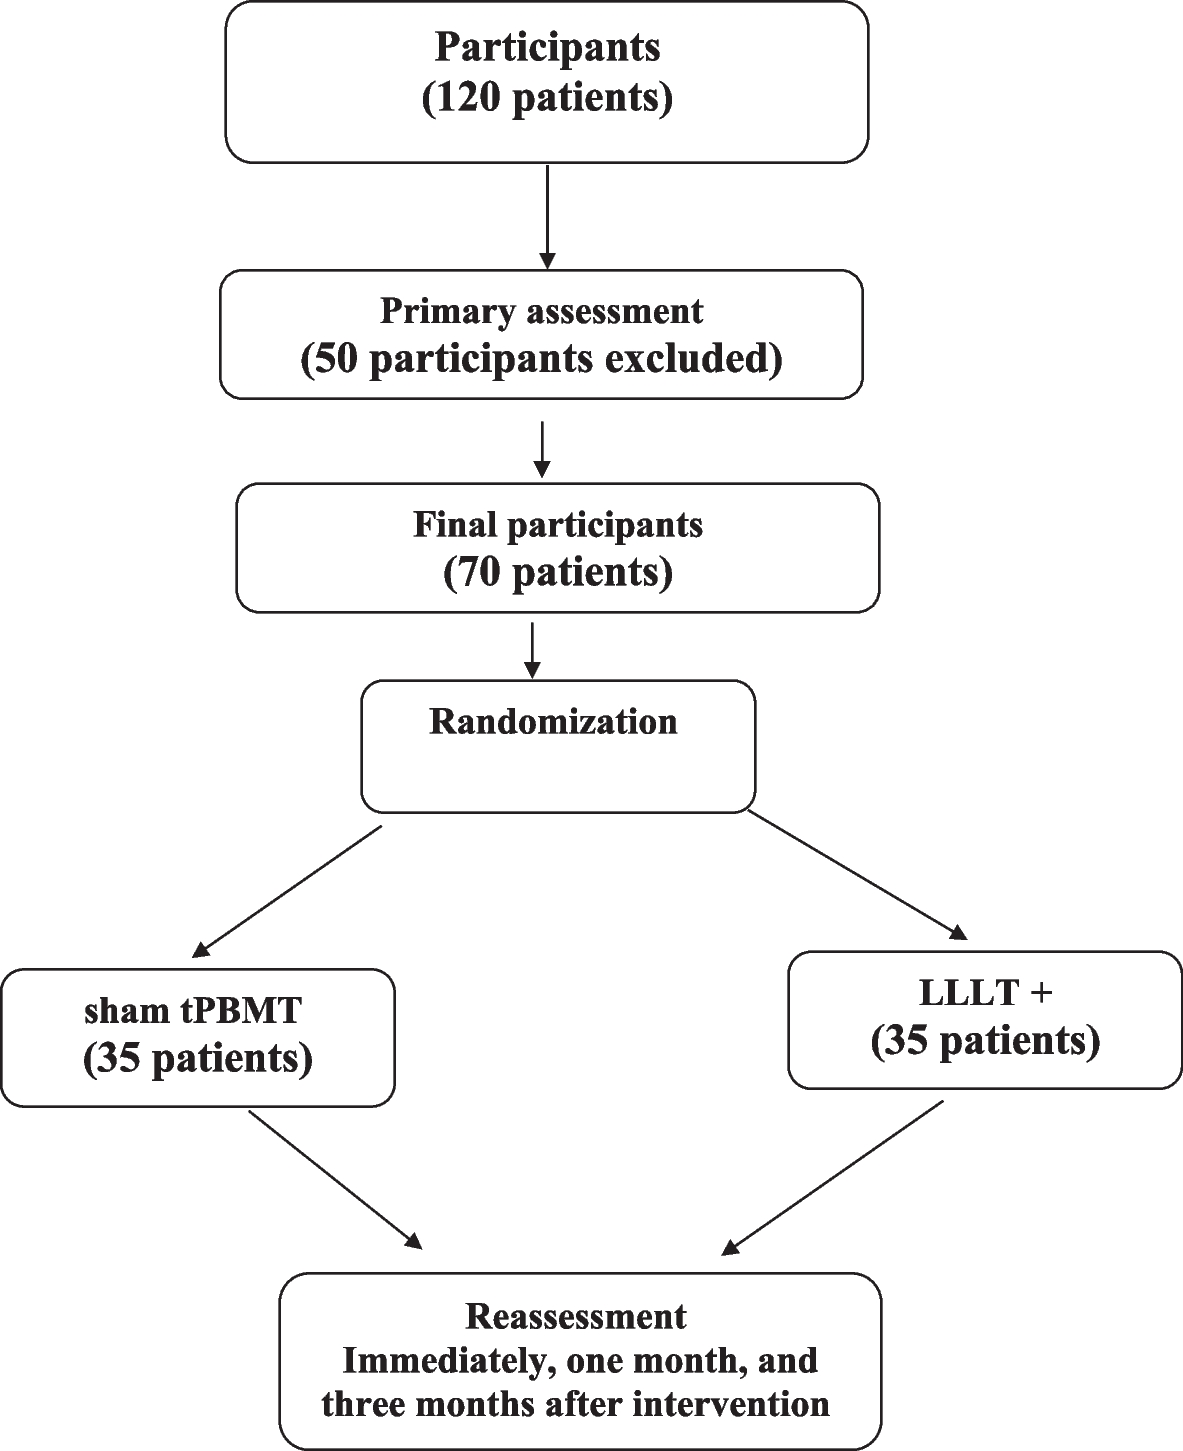
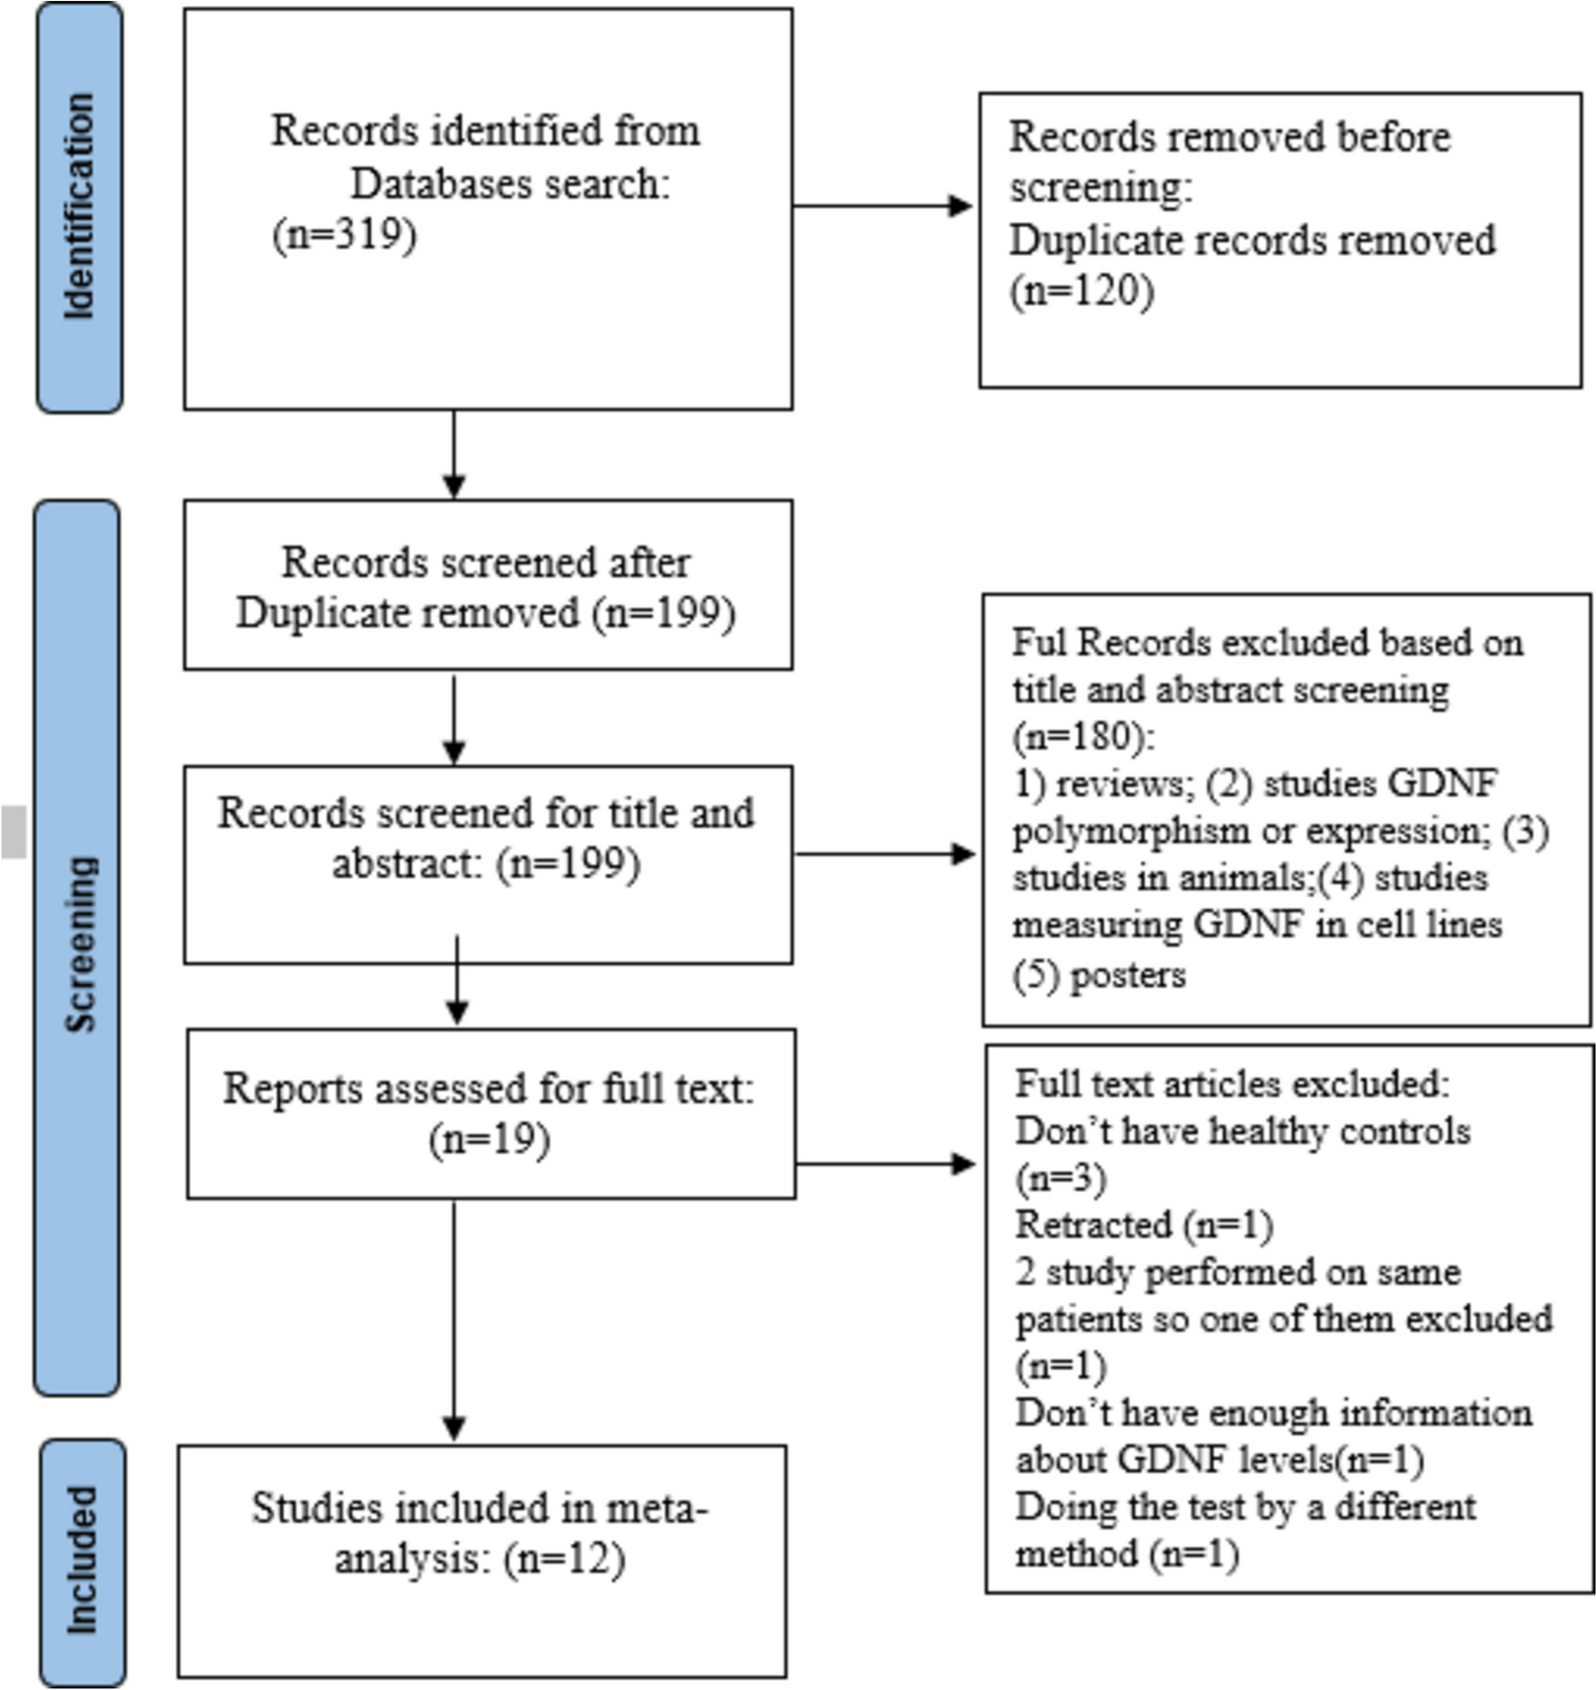
A total of 36,259 participants in the NHANES (2003–2018) were enrolled and assessed using a Patient Health Questionnaire (PHQ-9) to diagnose depression. Those excludedincluded participants with missing essential information on dietary energy or macronutrient intake in three meals, and participants with a total energy intake < 500 kcal/day or > 4500 kcal/day (n = 1,965). Pregnant women and individuals < 18 years old were also excluded (n = 2,611). After these exclusions, the total number of participants for this study was 31,683 adults, including 3,490 adults with CVD. In summary, this study will discuss the relationship between the intake of energy and macronutrients at three meals and the onset of depression among the 3,490 participants with CVD, including 554 with depression. The study procedure is illustrated in Fig. 1.
Fig. 1
Flowchart depicting the participants’ selection
Dietary surveyDietary intake was measured with a 24-h dietary recall completed on 2 nonconsecutive days. The first 24-h dietary recall was conducted in person, and the second 24-h dietary recall was conducted 3–10 days afterward via telephone. Using estimated amounts of foods, nutrient intakes were computed at the individual-level using a revised nutrient database that converted amounts of specific food intakes into amounts of various nutrients, detailed descriptions of the dietary interview methods are provided in the NHANES Dietary Interviewers Procedure Manuals [19]. Dietary data were based on the mean of two dietary surveys. For each participant, the amount of each food intake was listed according to mealtimes. Dietary measurements included total energy (kcal/day), total dietary fat (g/day), protein (g/day), carbohydrate (g/day), saturated fatty acid (SFA, g/day), monounsaturated fatty acid (MUFA, g/day), polyunsaturated fatty acid (PUFA, g/day), and dietary energy or macronutrients in each meal.
Main exposure and outcome measuresThe study focused on energy and macronutrient intake from three meals: breakfast, lunch, and dinner, as the exposure variables. Assessed macronutrients included protein, carbohydrate, SFA, PUFA, and MUFA. The primary outcome of interest was depression. The depressive state was assessed using the PHQ-9 in NHANES [20] and the instrument included nine symptom response categories, answered on a 4-point scale: 0 (not at all), 1 (several days), 2 (more than half the days), and 3 (nearly every day). When the PHQ-9 score was ≥ 10, the interviewee was considered to have depression. This cut-off point is frequently used in clinical and epidemiological studies to define depression and has been clinically validated witha sensitivity of 88% and a specificity of 88% [20]. CVD was defined as a self-reported diagnosis history of heart failure, coronary heart disease, angina/angina pectoris, heart attack, or stroke [21].
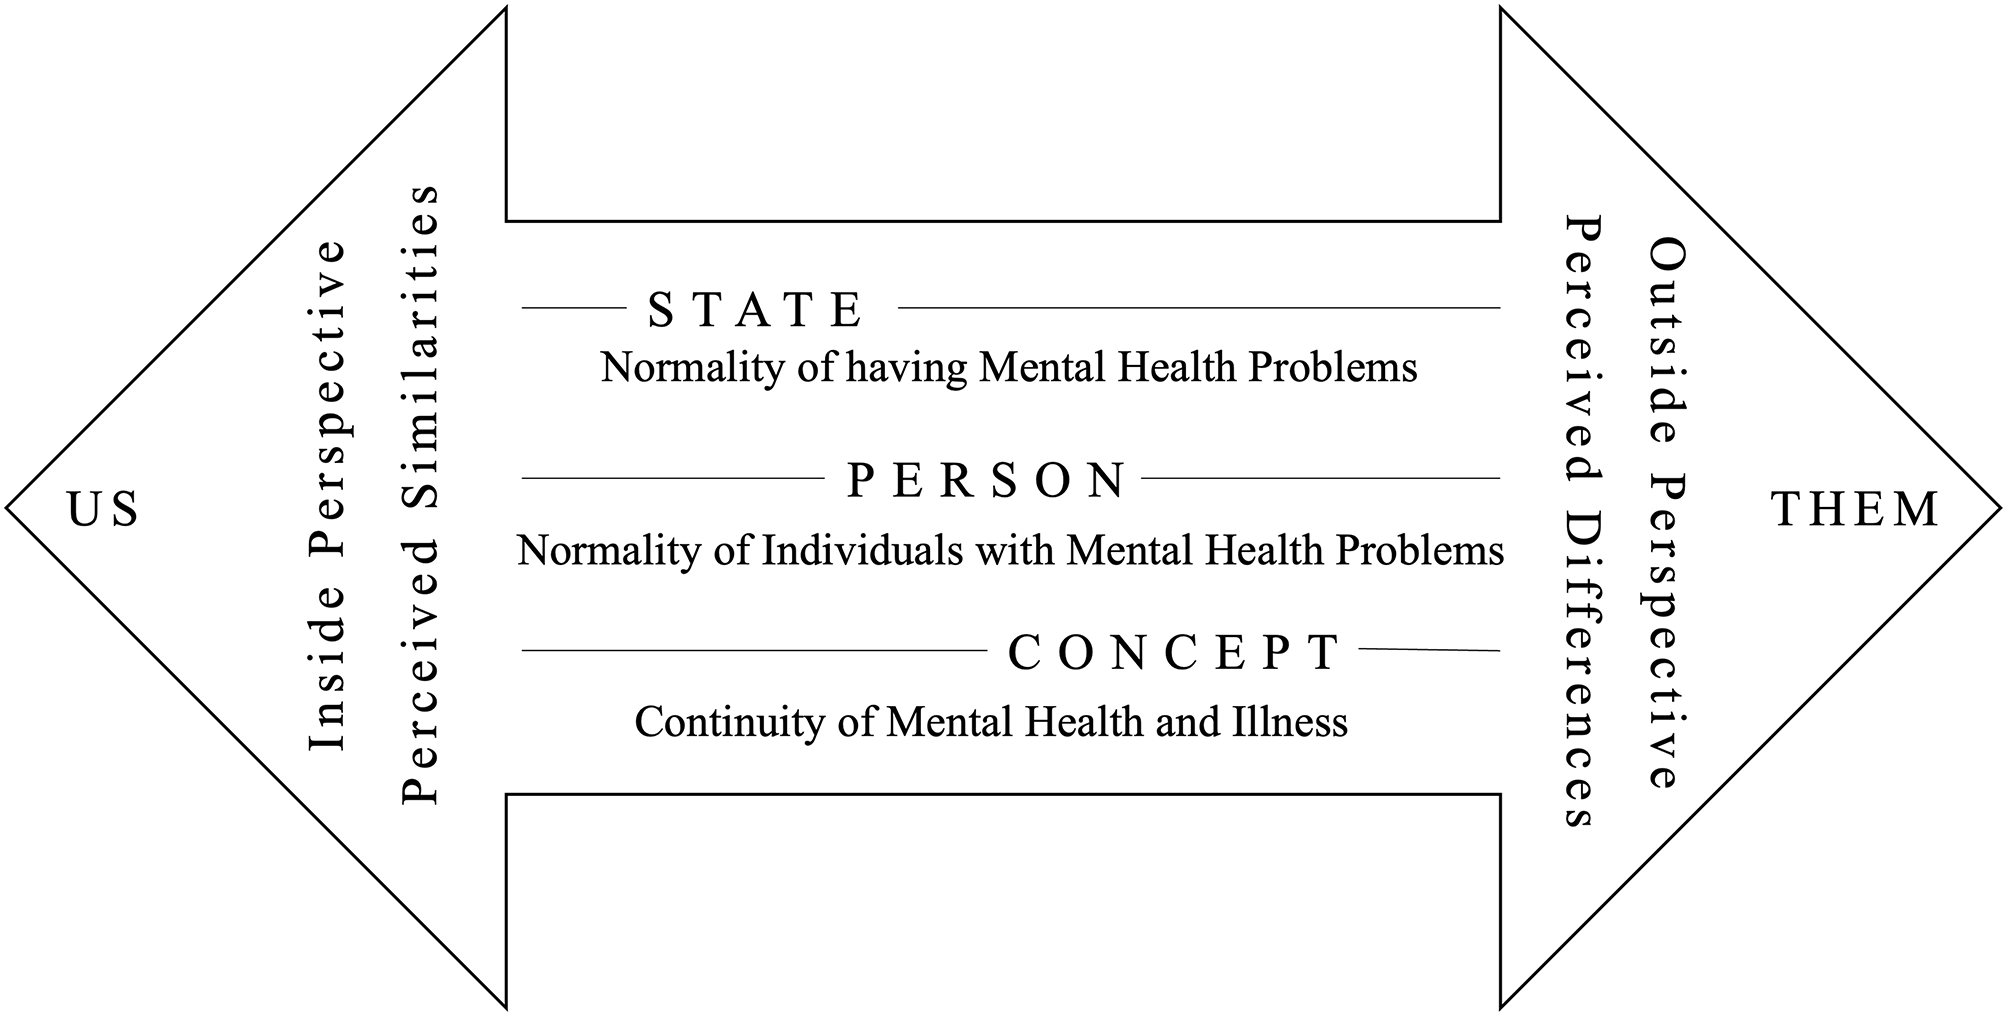
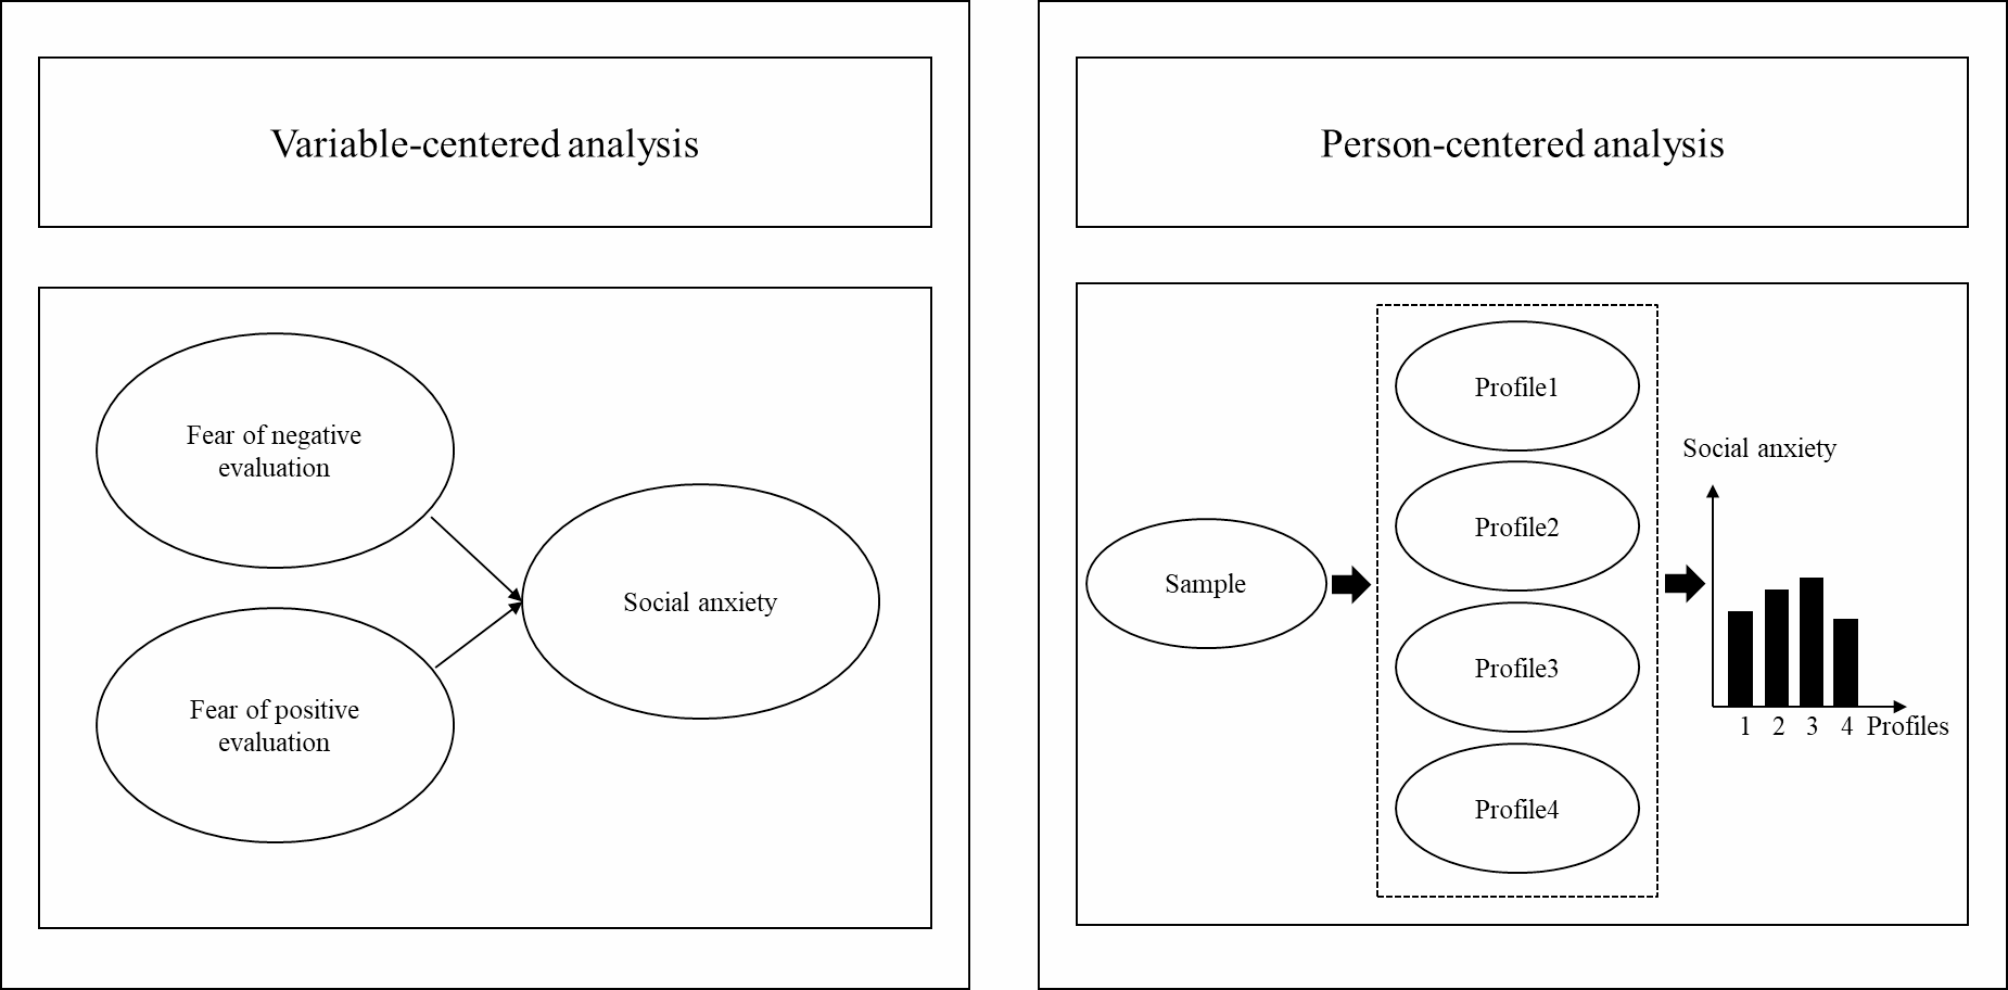
Confounding measurementsConfounding was evaluated using prior knowledge and descriptive statistics from NHANES through the use of directed acyclic graph (Fig. 2). Potential covariates in this study included age (years), gender (men/women), education level (< 9th grade, 9-11th grade, high school graduate, GED or equivalent, some college or associate’s degree, or college graduate or above), smoking status (never smoked, current smoker, former smoker), moderate physical activity (yes/no), marital status (married, widowed, divorced, separated, never married), annual household income (≤ $20,000, > $20,000), drinking (drinks/week), skipping breakfast, skipping dinner, skipping lunch, type 2 diabetes mellitus (T2DM) status (yes/no), and body mass index (BMI, kg/m2). The amount of alcohol consumed was measured by the number of drinks, where a standard drink was any drink that contained about 0.6 fluid ounces or 14 g of pure alcohol. T2DM was defined by a self-reported diagnosis, an HbA1c level ≥ 6.5%, or a fasting plasma glucose level ≥ 7.0 mmol/L. BMI was calculated as weight in kilograms divided by the square of height in meters [22].
Fig. 2
The directed acyclic graph for describing confounding factors
Statistical analysisAll analyses incorporated the dietary sample weights, stratification and clustering of the complex sampling design to ensure nationally representative estimates according to NHANES analytic guidelines. General linear models and chi-square tests were used to compare baseline characteristics by quintiles. Continuous variables were expressed as mean ± standard deviation and classified variables were expressed as percentages. Missing covariables at < 5% were filled in by multiple interpolation. When the missing value of a variable was > 5%, it was deleted to avoid affecting the results.
Logistic regression models were developed to evaluate the associationLogistic regression models were developed to evaluate energy or macronutrients in each meal and the risk of depression in adults with CVD.Odds ratios (ORs) and their 95% confidence intervals (CIs) were estimated in logistic regression models with the lowest quintile of energy or macronutrient as the reference category.We also controlled for a series of potential confounders, which were age, gender, education level, household income, smoking status, drinking status, physical activity, marital status, skipping breakfast/lunch/dinner, total energy, carbohydrate, protein, dietary fiber, SFA, MUFA, and PUFA intake,T2DM and hypertension status, and BMI.
Predicted isocaloric modelsIn nutritional epidemiology, dietary substitution models have been used to study relationships between nutrient or food substitution and related health or disease outcomes, and provide dietary advice for the prevention and treatment of diseases [23]. Currently, numerous studies have utilized substitution analysis to examine the replacement of one food or nutrient with another while maintaining an equivalent energy intake, observing shifts in epidemiological indicators. We established an equivalent dietary energy substitution model to evaluate the changes in depression risk caused by switching dietary energy intake from a single time period to another single time period [24]. In this study, we performed a series of isocaloric dietary substitution models to assess changes in the risk of depression when a 5% dietary energy intake at dinner was substituted with a 5% dietary energy intake at breakfast or lunch.
Sensitivity analysisThe timing of breakfast and dinner intake has been defined differently in different studies [25,26,27]. Some may define breakfast as a meal before or at the start of daily activities, while others may define breakfast as a meal consumed before a certain time (e.g., before 10:00).Some may define dinner as a meal consumed after 7 pm, while others may define it as a meal consumed between 3 pm and 11:59 pm. In NHANES, two variables were provided: the name of the eating occasion and the time of the eating occasion. The former provided information about breakfast, lunch, and dinner, allowing us to calculate the intake of energy and macronutrients for these three meals. Based on the time of the eating occasion, we divided the whole day into three periods: 0–12 o'clock, 12–18 o'clock, and 18–24 o'clock, and calculated the total energy and macronutrient intake for each period. Morning snack was defined as the energy and macronutrient intake during the first period minus the intake at breakfast. Similarly, afternoon snack was defined as the intake during the second period minus the intake at lunch, and evening snack was defined as the intake during the third period minus the intake at dinner. In summary, mealtimes were categorized into six parts: breakfast, morning snack, lunch, afternoon snack, dinner, and evening snack. In this study, we conducted three sensitivity analyses to ascertain the stability of the association between energy or macronutrient intake and the risk of depression among CVD patients. First, breakfast and a morning snack were considered breakfast, and study data were reanalyzed. Second, dinner and an evening snack were considered dinner. Third, when the energy intake and macronutrient content of each of the three meals were divided into tertiles, the research data were re-analyzed statistically to verify the stability of the study results.
A two-sided P value < 0·05 was considered statistically significant. All statistical analyses were performed using R software version 3.5.3 [28].
留言 (0)