Mice
All animal experimental protocols were approved by the Animal Ethics Committee of Peking University according to China’s Guidelines on Welfare and Ethical Review for Laboratory Animals. C57BL/6 and CD45.1 mouse were purchased from the Laboratory Animal Center of Peking University Health Science Center. B6;129S4-Pparatm1Gonz/J mice were purchased from the Jackson Laboratory (Bar Harbor, ME, USA). Sex-matched littermates aged 6–8 weeks were used in the experiments described in this study. All the mice were bred and maintained under pathogen-free conditions.
Cell culture
Hepa1-6 and H22 cell lines were purchased from the National Institute of Cell Line Resources of China. Hepa1-6 cells were cultured in Dulbecco’s modified essential medium (DMEM) supplemented with 10% (v/v) fetal bovine serum (FBS) and 1% (v/v) penicillin plus streptomycin (P/S) and incubated at 37 °C with 5% CO2. H22 cells were cultured in RPMI-1640 medium supplemented with 10%FBS and 1% penicillin/streptomycin. For in vitro experiments, MDSCs from bone marrow were sorted using BD FACS ARIA II SORP (Special Order Research Product) and then incubated with sorafenib (Selleck, 10 μM), GW6471(Selleck, 10 μM), CCR2-antagonist (Santa Cruz Biotechnology, 100 nM), etomoxir (Selleck, 100 μM), palmitic acid (Merk, 50 μM) and oleic acid (Merk, 100 μM) for 24 h. To obtain tumor-conditioned medium (TCM), cancer cells were cultured for 3 days and then collected with the supernatant. Next, the cell suspension was frozen at -80 °C and thawed five times. The tumor-conditioned medium was obtained by centrifugation (20,000 × g, 30 min, 4 °C). To obtain the tumor-extracted medium (TEM), the tumor was resected from the tumor-bearing mice when the tumor volume reached approximately 500mm3. The bulk tumor was homogenized in a quantitative volume of DMEM and centrifuged at 4,000 × g for 30 min to obtain the supernatant. To knockdown PPARA expression in sorted MDSCs, PU.1/Spi1 shRNA was used from Santa Cruz Biotechnology, according to the manufacturer’s instructions.
HCC orthotopic model construction
To establish an orthotopic hepatocellular carcinoma (HCC) model, Hepa1-6-luciferase (Hepa1-6-luc) cells were injected directly into the liver. All animal experiments were conducted in compliance with the guidelines of the Animal Ethics Committee of Peking University. C57BL/6 mice and Rag2−/− mice aged 6–8 weeks were used for this procedure. Prior to surgery, the mice were anesthetized via intraperitoneal injection of pentobarbital sodium (50 mg/kg). Under sterile conditions, a midline incision was made in the abdomen to expose the liver lobes. Using a 30-gauge insulin syringe, 1 × 10⁶ Hepa1-6-luc cells suspended in 50 μL PBS were injected into multiple sites of the exposed liver lobes (typically 3–4 injection points per lobe). Care was taken to ensure consistent injection depth and to avoid leakage of cells outside the liver tissue. After injection, the abdominal incision was sutured in two layers—absorbable sutures for the muscle layer and non-absorbable sutures for the skin. Mice were placed on a heating pad until fully recovered from anesthesia. The mice were monitored daily for signs of distress or surgical complications. Tumor growth was monitored weekly using bioluminescence imaging. D-luciferin (150 mg/kg) was injected intraperitoneally 10–15 min before imaging, and luminescence was detected using an in vivo imaging system (IVIS, PerkinElmer). This allowed us to regularly assess tumor establishment and growth kinetics. Once significant tumor signals were detected via bioluminescence imaging, the mice were randomly divided into groups. The experimental group received daily sorafenib treatment (30 mg/kg) by gavage, while being fed an Amylin Liver NASH (AMLN) diet—a NAFLD-inducing diet high in trans-fat, fructose, and cholesterol to simulate MASH (Metabolic Associated Steatohepatitis)-induced HCC. After two weeks of treatment, the experiments were concluded for further analysis.
Tumor-bearing model
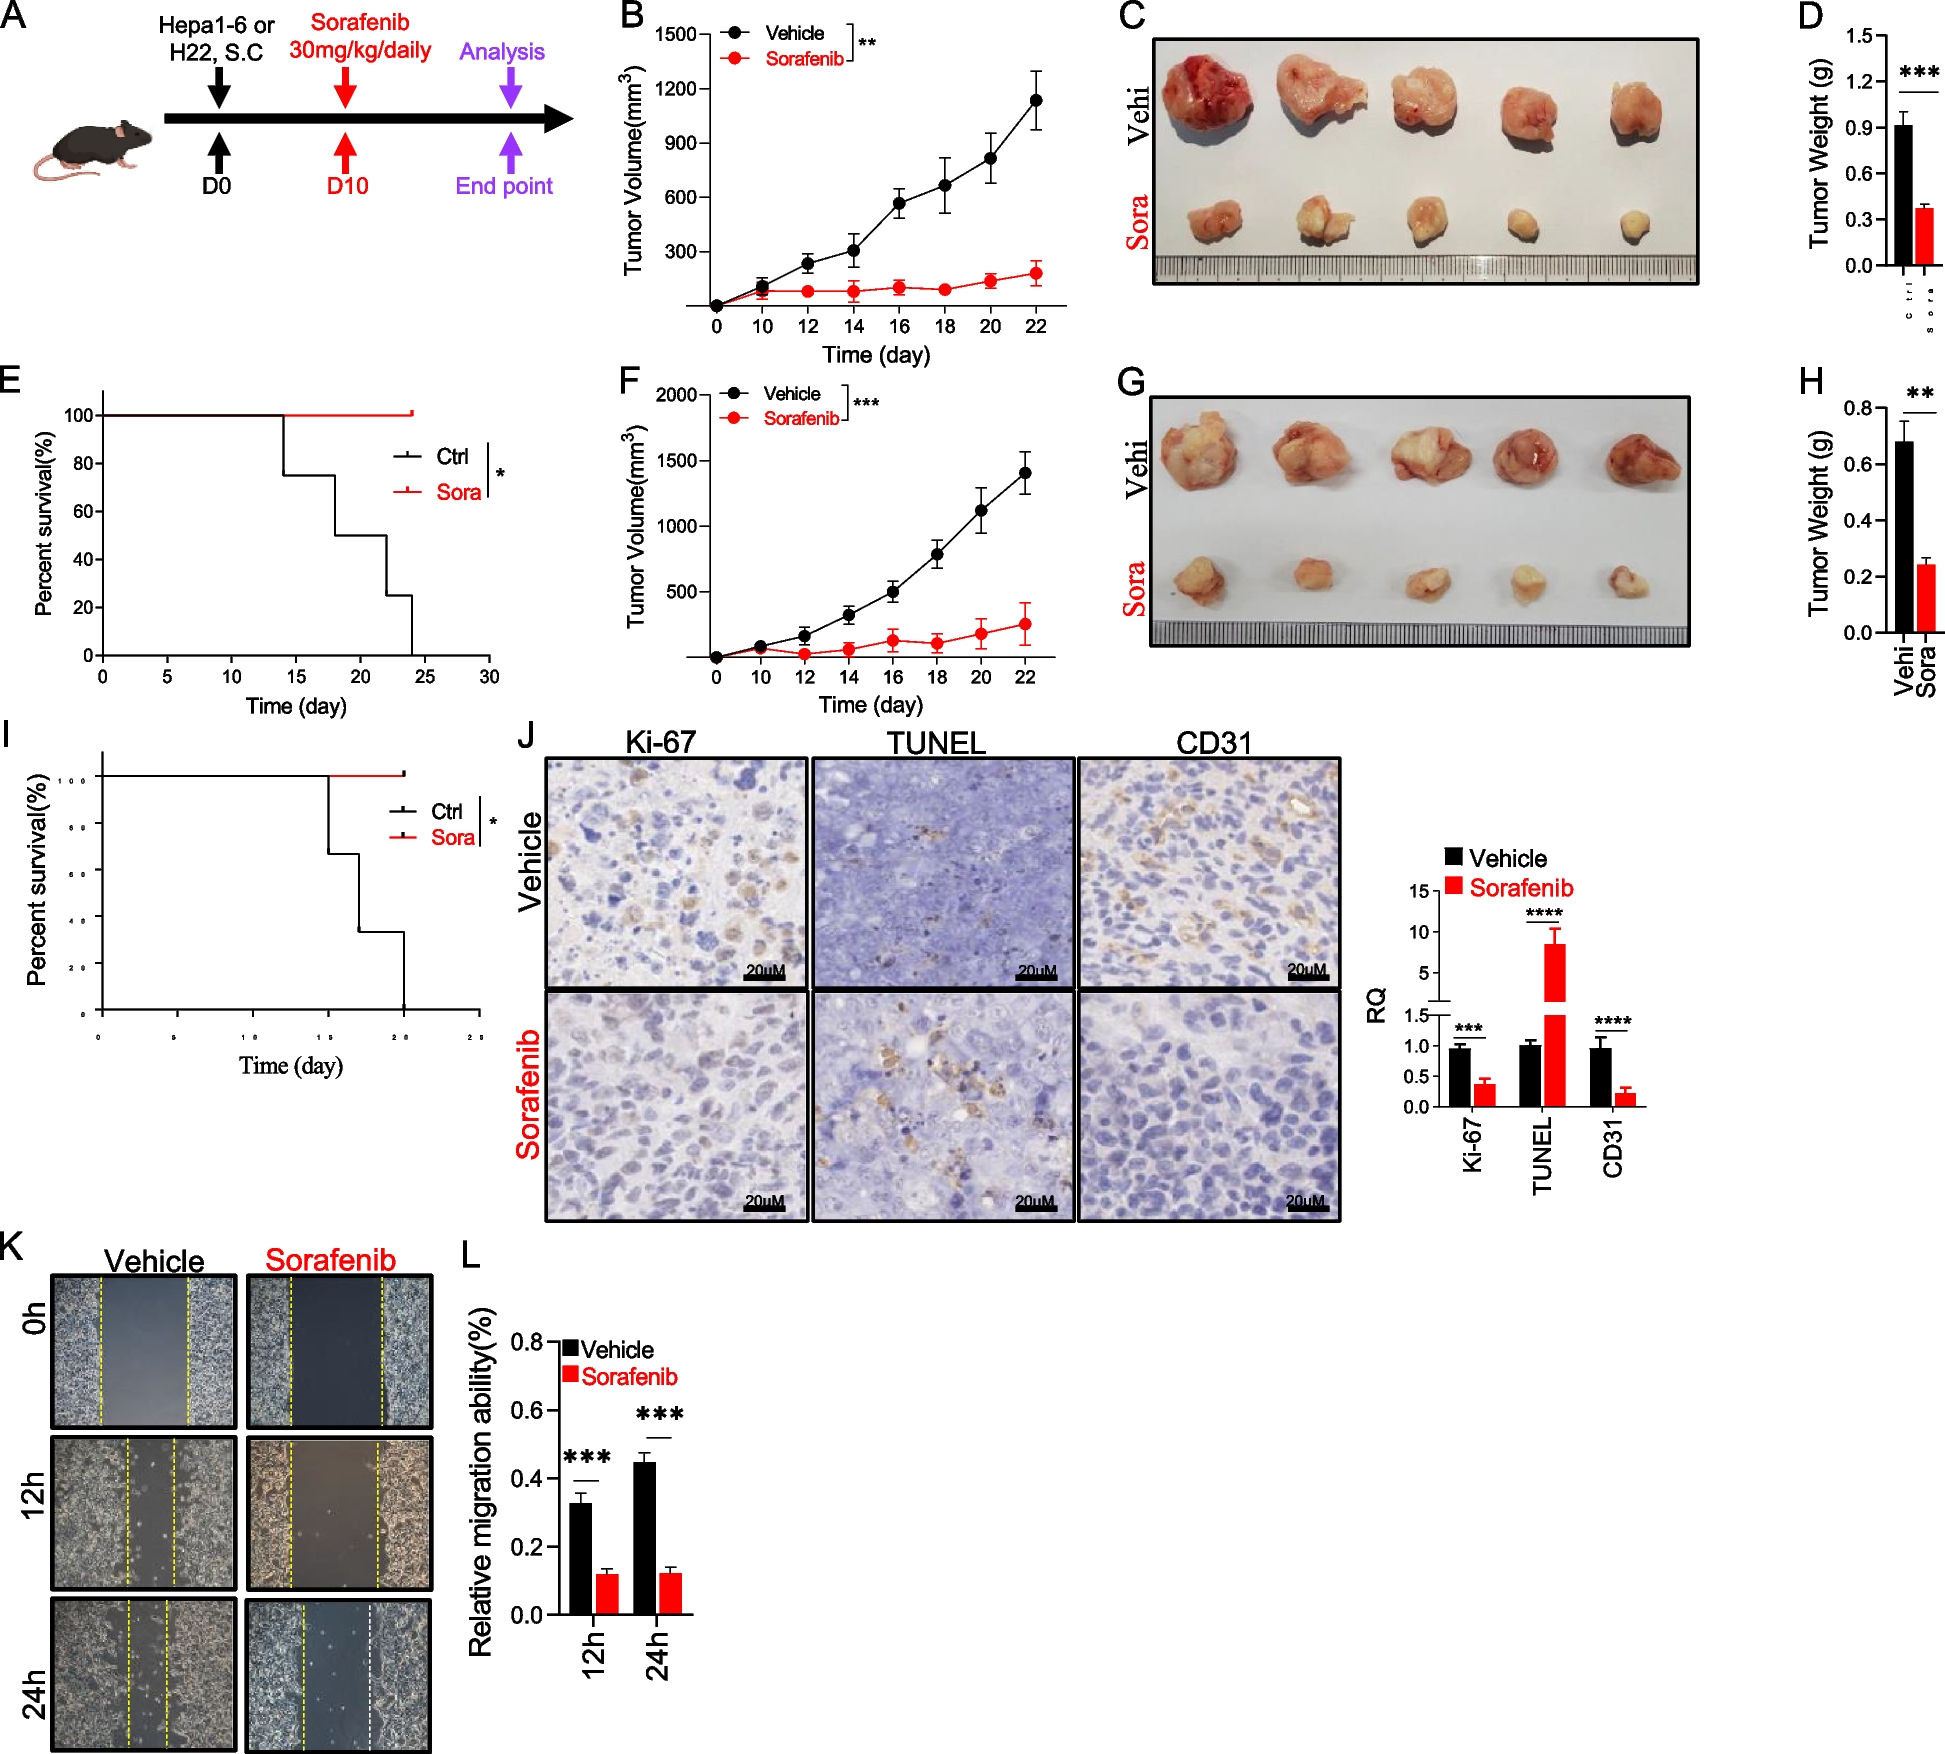
Approximately 5 × 10⁶ Hepa1-6 cells and 1 × 10⁶ H22 cells per mouse were injected subcutaneously into the right back flank for the subcutaneous implantation model. Tumor volume was calculated as length × width2 × 0.52. Once palpable tumors were present, tumor measurements were performed using a caliber. Mice were placed on either a normal-fat diet or high-fat diet (60% kcal of fat). For ethical considerations, tumor-bearing mice were euthanized if the tumor size exceeded 20 mm at the largest diameter of the adult mouse.
MDSC transfer
Peripheral blood was collected from Hepa1-6 tumor-bearing mice (CD45.1 background) using heparin as an anticoagulant to prevent coagulation during sample processing. Following collection, red blood cells were lysed by treating the blood with red blood cell lysis buffer (Solarbio, China), ensuring the removal of erythrocytes and yielding a purified leukocyte population. The leukocytes were then labeled with specific antibodies for MDSC markers, including CD11b-FITC and Ly6G/Ly6C (Gr1)-APC (BioLegend, USA), to facilitate accurate identification and sorting of MDSCs. The labeled cell suspension was then processed using a BD FACS ARIA II SORP flow cytometer to sort and collect a highly purified population of MDSCs. For the subsequent transfer, 10^5 sorted MDSCs were injected into each CD45.2 background Hepa1-6 tumor-bearing mouse that was undergoing continuous sorafenib treatment (Selleck, 30 mg/kg in vivo). Alongside the MDSC transfer, each recipient mouse received an intraperitoneal injection of CCR2 antagonist (MCE, USA) at a dose of 5 mg/kg. The CCR2 antagonist and MDSCs were administered daily for three consecutive days to ensure sufficient cell migration and to inhibit CCR2-dependent signaling pathways. Following the final injection, the mice were used for further downstream analyses to evaluate the infiltration and functional state of MDSCs within the tumor microenvironment.
Western blot
Cells were lysed with RIPA buffer (Beyotime, China) containing a protease and phosphatase inhibitor cocktail (Macgene, China), and cell lysates were quantified using the BCA assay (Beyotime, China). Protein samples were subjected to 10% SDS-PAGE and transferred to polyvinylidene difluoride (PVDF) membranes. After blocking with 5%(v/v) bovine serum albumin (BSA) in Tris-buffered saline with Tween 20 (TBST) for 1 h at room temperature, the membranes were incubated with the indicated primary antibodies overnight at 4 °C. After washing with TBST, the membranes were incubated with secondary horseradish peroxidase (HRP)-conjugated IgG antibodies for 2 h at 4 °C. The membranes were washed three times with TBST at 5-min intervals. Protein expression signals were detected using electrochemiluminescence (Millipore, Germany) buffer on an automatic chemiluminescence image analysis system (Tanon 5200, China). β-actin was used as a control. The primary antibodies used in this study were as follows: Anti-CPT1A antibody (ab234111, Abcam, USA), Anti-ACOX1/AOX (ab184032; Abcam, USA), PPARα (sc-398394; Santa Cruz Biotechnology, USA), Anti-STAT1 (phospho S727) (ab109461, Abcam, USA), Anti-PU.1/Spi1 (ab227835, Abcam, USA), Anti-STAT6 (phospho Y641) (ab28829, Abcam, USA), Anti-IRF8 antibody (ab207418, Abcam, USA), Anti-IRF8 antibody (ab207418, Abcam, USA), and β-actin (sc-8432; Santa Cruz Biotechnology, USA).
RNA isolation and real-time qPCR
RNA was isolated using TRIzol reagent (Invitrogen) according to the manufacturer’s instructions and was reverse-transcribed into complementary DNA using PrimeScript RT Master Mix (Takara) according to the manufacturer’s instructions. Real-time PCR was performed using TB Green® Premix Ex Taq™ II (Tli RNaseH Plus, Takara) in a 96-well plate on a QuantStudio™ 5 system (Applied Biosystems). Amplification was performed using the primers included: Nos2: forward-GTTCTCAGCCCAACAATACAAGA, reverse-GTGGACGGGTCGATGTCAC; Ifng: forward-ATGAACGCTACACACTGCATC, reverse-CCATCCTTTTGCCAGTTCCTC; Il10: forward-GCTCTTACTGACTGGCATGAG, reverse-CGCAGCTCTAGGAGCATGTG; Tgfb1: forward-CTCCCGTGGCTTCTAGTGC, reverse-GCCTTAGTTTGGACAGGATCTG; Ppara: forward-AGAGCCCCATCTGTCCTCTC, reverse-ACTGGTAGTCTGCAAAACCAAA; Ppard: forward-TCCATCGTCAACAAAGACGGG, reverse-ACTTGGGCTCAATGATGTCAC; Ehhadh: forward-ATGGCTGAGTATCTGAGGCTG, reverse-GGTCCAAACTAGCTTTCTGGAG; Cpt1a: forward-CTCCGCCTGAGCCATGAAG, reverse-CACCAGTGATGATGCCATTCT; Cpt1b: forward-GCACACCAGGCAGTAGCTTT, reverse-CAGGAGTTGATTCCAGACAGGTA; Cpt2: forward-CAGCACAGCATCGTACCCA, reverse-TCCCAATGCCGTTCTCAAAAT; Acox1: forward-TAACTTCCTCACTCGAAGCCA, reverse-AGTTCCATGACCCATCTCTGTC; Echs1: forward-AGCCTGTAGCTCACTGTTGTC, reverse-ATGTACTGAAAGTTAGCACCCG; Etfa: forward-GCCTCATTGCTCCGTTTTCAG, reverse-GCTACTAAGCAGGACACTTCAC; Etfb: forward-CTGTCAAGAGGGTCATCGACT, reverse-CACAGAAGGGGTTCATGGAGT; Acadvl: forward-CTACTGTGCTTCAGGGACAAC, reverse-CAAAGGACTTCGATTCTGCCC; Acadm: forward-AGGGTTTAGTTTTGAGTTGACGG, reverse-CCCCGCTTTTGTCATATTCCG; Acaa1a: forward-TCTCCAGGACGTGAGGCTAAA, reverse-CGCTCAGAAATTGGGCGATG; Hsd17b4: forward-AGGGGACTTCAAGGGAATTGG, reverse-GCCTGCTTCAACTGAATCGTAA; Slc27a1: forward-CGCTTTCTGCGTATCGTCTG, reverse-GATGCACGGGATCGTGTCT; Slc27a2: forward-TCCTCCAAGATGTGCGGTACT, reverse-TAGGTGAGCGTCTCGTCTCG; Slc27a3: forward-GGCCCGGATTTCCTTTGGATT, reverse-CCCATAGGTGGAGCCCCAT; Slc27a4: forward-ACTGTTCTCCAAGCTAGTGCT, reverse-GATGAAGACCCGGATGAAACG; Slc27a5: forward-CTACGCTGGCTGCATATAGATG, reverse-CCACAAAGGTCTCTGGAGGAT; Slc27a6: forward-CTCCAACCTTCGCTTCGATTC, reverse-TCTGACGTGTTTTGGGAGACT; Slc16a3: forward-TCACGGGTTTCTCCTACGC, reverse-GCCAAAGCGGTTCACACAC; Fabp1: forward-ATGAACTTCTCCGGCAAGTACC, reverse-CTGACACCCCCTTGATGTCC; Fabp3: forward-ACCTGGAAGCTAGTGGACAG, reverse-TGATGGTAGTAGGCTTGGTCAT; Fabp4: forward-AAGGTGAAGAGCATCATAACCCT, reverse-TCACGCCTTTCATAACACATTCC; Fabp5: forward-TGAAAGAGCTAGGAGTAGGACTG, reverse-CTCTCGGTTTTGACCGTGATG; Fabp6: forward-CTTCCAGGAGACGTGATTGAAA, reverse-CCTCCGAAGTCTGGTGATAGTTG; Fabp7: forward-GGACACAATGCACATTCAAGAAC, reverse-CCGAACCACAGACTTACAGTTT; Bdh1: forward-ACAAGACACACGCTGTTGTTT, reverse-CTCTTCAAGCTGTCCAGTTCC; Idh3a: forward-TGGGTGTCCAAGGTCTCTC, reverse-CTCCCACTGAATAGGTGCTTTG; Pnpla2: forward-CAACGCCACTCACATCTACGG, reverse-GGACACCTCAATAATGTTGGCAC; Dgat1: forward-TCCGTCCAGGGTGGTAGTG, reverse-TGAACAAAGAATCTTGCAGACGA; Lipa: forward-TGTTCGTTTTCACCATTGGGA, reverse-CGCATGATTATCTCGGTCACA; Glut1: forward-CAGTTCGGCTATAACACTGGTG, reverse-GCCCCCGACAGAGAAGATG; Arg1: forward-CTCCAAGCCAAAGTCCTTAGAG, reverse-AGGAGCTGTCATTAGGGACATC; Cpt1a: forward-CTCCGCCTGAGCCATGAAG, reverse-CACCAGTGATGATGCCATTCT.. Relative quantitation of the mRNA expression levels of the target genes was normalized to that of ACTB.
Flow cytometry and staining
Before staining, the cell samples were re-suspended in phosphate-buffered saline (PBS) containing 2% (w/v) bovine serum albumin (BSA). For surface markers, cells were stained for 20 min on ice according to the manufacturer’s instructions. For the analysis of intracellular cytokines, cells were incubated in Iscove's modified Dulbecco’s medium (IMDM) supplemented with 10% (v/v) FBS and 1% (v/v) P/S and stimulated for 4–6 h with ionomycin (100 ng/ml) and PMA (10 ng/ml) plus in the presence of Golgi-Stop at 37 °C, before being stained according to the manufacturer’s instructions using the Cytofix/Cytoperm fixation/permeabilization kit (BD Biosciences). The fluorescent conjugate-labelled antibodies used in this study were listed as follows: CD45-BV421 (Clone A20; BioLegend), CD11b-FITC (Clone M1/70; BioLegend), CD45.2-PerCP/Cyanine5.5 (Clone 104; eBioscience), Ly6G/Ly6C (Gr1)-APC (Clone RB6-8C5; BioLegend), F4/80-APC/Cyanine7 (Clone BM8; BioLegend), CD274-PE (B7-H1, PD-L1) (Clone 10F.9G2; BioLegend), CD192 (CCR2)-PE (Clone SA203G11; BioLegend), CD36-APC (Clone HM36; eBioscience), CD4-FITC (Clone:RM4-5; BioLegend), CD8a-APC (Clone 53–6.7; BioLegend), iNOS-PE (Clone CXNFT; eBioscience), TGFβ-APC (Clone TW7-16B4; BioLegend), IL-10-PE (Clone JES5-16E3; BioLegend), Arginase 1-APC (Clone A1exF5; eBioscience), TNFα-PE (Clone MP6-XT22; BioLegend), IDO1-eFluor 660 (Clone mIDO-48; eBioscience), CD44-eFluor 450 (Clone IM7; eBioscience), Granzyme B-APC (Clone NGZB; eBioscience), IFN-γ-FITC (Clone: XMG1.2; BioLegend), Annexin V-FITC (BioLegend). To measure the uptake of fatty acids, sorted MDSCs were re-suspended in a complete medium containing BODIPY FL C16 (Thermo Fisher Scientific, Cat#D3821) at a final concentration of 1 μM and incubated in the dark for 30 min at 37 °C. Cells were collected and washed twice with ice-cold PBS before surface staining. For mitochondrial staining, the cells were incubated with 10 nM MitoTracker Red (Beyotime), 20 nM tetramethylrhodamine methyl ester (TMRM; MedChemExpress), and JC-1(MedChemExpress) for 30 min at 37 °C before staining with surface markers. The cells were detected on a CytoFlex flow cytometer (Beckman Coulter). Data analysis was performed using the FlowJo Software (TreeStar).
Nitric oxide (NO) detection
The cell culture supernatant was collected, and the NO concentration was measured using the Griess Reagent Kit for Nitrite Determination (Thermo Fisher Scientific) according to the manufacturer’s instructions. Briefly, all materials and prepared reagents were equilibrated to room temperature prior to use. Dilute the standard (1-100 µM) with the sample solution to be tested. The standard concentrations were 0, 1, 2, 5, 10, 20, 40, 60, 100 µM. The standard and sample were added to 96-well plates at 50 µl/well. 50 µl of component A and B were added to each well. The absorbance of nitrite-containing samples relative to that of the reference sample was measured using a spectrophotometric microplate reader. The optimal measurement wavelength was determined as 548 nm. Finally, a standard curve of nitrite concentration (x-axis) against absorbance (y-axis) is plotted. Nitrite concentrations corresponding to the absorbance of the experimental samples were read from the standard plot.
Arginase activity assay
The collected MDSCs were homogenized using arginase assay buffer (BioVision) and processed according to the manufacturer’s instructions. Briefly, all materials and the prepared reagents in the Arginase Assay Buffer were equilibrated to room temperature prior to use. First, reaction wells were prepared using standard dilutions and samples. Then, 10µL of Substrate Mix was prepared for each sample. Next, 10µL of Substrate Mix was added to each sample and positive control. 10µL A Background Control Mix was added to each background control sample and incubated for 20 min at 37 °C. Finally, 50 µL of the Reaction Mix was added to each standard, test sample, background control sample, and positive control well, and absorbance was measured immediately on a microplate reader at OD = 570 nm in kinetic mode for 10–30 min at 37 °C. Arginase activity in the test samples was calculated using the formula in the booklet protocol.
Mixed bone marrow chimeras
BM cells were collected from the femurs and tibias of wild-type (CD45.1) and PPARα knockout (KO) (CD45.2) donor mice. The BM cells were released from the harvested bones by crushing in a mortar with ice-cold PBS buffer, and the cell extract was then passed through a 70 μm cell strainer. Cells were pelleted by centrifugation (350 × g, 4 °C, 10 min) and resuspended to obtain a total cell concentration of 108 cells/ml. Then, The BM cells were mixed in a 1:1 ratio, and the donor cell mixtures were used to reconstitute the myeloablated recipient mice that were preconditioned with whole-body irradiation (8 Gy) by retroorbital injection of 200 μl Anesthesia was performed using an isoflurane vaporizer, using 4% isoflurane for the induction phase, followed by 2–3% for maintenance. Tumor inoculation was performed when the recipient mice were fully immune reconstituted [31].
Transwell migration assay
To measure the migration ability of MDSCs in vitro, a Transwell migration assay was performed using a 6.5 mm insert with 8.0 µm polycarbonate membranes in 24-well plates (COSTAR, 3422).. The upper compartment was hydrated in serum-free medium for 1 h at 37 °C and then coated with 100 μl of Matrigel for 4 h at 37 °C. Sorted MDSCs (1 × 10⁴ cells/well) were suspended in DMEM and added to the upper chambers, whereas the lower chambers contained TCM. After incubation for 24 h, non-migrating cells were removed from the top chambers using a cotton stick, and cells that migrated to the other side of the chamber membrane were fixed with methanol at room temperature for 10 min and stained with 0.1% crystal violet (Solarbio, China) for 10 min, followed by washing with PBS three times. Images were captured using a microscope (Leica).
Scratch wound healing assay
Hepa1-6 cells were seeded in 6-well plates at a density of 6 × 10⁵ cells/well. When the cells reached 90%-100% confluence, a 10 μl pipette tip was used to scratch the cells in a straight line, followed by washing the cells with PBS three times. Images of the migrated cells were captured under a phase-contrast microscope (Leica) at 0 h, 24 h and 48 h.
Colony formation assay
Approximately 1,000 Hepa1-6 cells per well were seeded in 6-wells plates and cultured at 37 °C, and the medium was refreshed every three days. After two weeks of incubation, the cells were fixed with 4% paraformaldehyde and stained with 0.1% crystal violet. The extra dye was then washed three times with water, followed by air-drying and image capture.
Cell counting kit‑8 (CCK‑8) assay
A CCK-8 kit (Solarbio, Beijing, China) was used to determine cell viability. Hepa1-6 and H22 cells were seeded in 96-well plates at a density of 1 × 10⁴ cells/well. Four hours before detection, 10μL of CCK8 was added to each well. After incubation for 1-4 h at 37 °C, the absorbance at 450 nm was measured using a multilabel plate reader (TECAN, China).
Immunohistochemistry and immunofluorescence staining
For immunohistochemistry, the tumor tissue was fixed in paraformaldehyde for more than two days, followed by dehydration, embedding, and slide sections. After dewaxing and hydration of the tissue slide, the samples were heated in a pressure cooker for 20 min in 0.01 M citrate for antigen retrieval. After cooling, the samples were placed in 3% H2O2 for 30 min to quench endogenous peroxide activity. The samples were then blocked with 10% BSA for 10 min, followed by incubation with anti-Ki67 and CD31 antibody (Sevicebio, Wuhan, China) overnight at 4 °C. After washing with PBS, the samples were incubated with enzyme-labeled goat anti-rabbit IgG (Servicebio) for 1 h at room temperature. Finally, the samples were stained with DAB (Servicebio, Wuhan, China) and counterstained with hematoxylin. The images were captured using a panoramic scanner (HAMAMATSU, Japan). For immunofluorescence staining, tissue samples embedded in paraformaldehyde were stained overnight with anti-Gr1 antibody (Servicebio, Wuhan, China). The samples were then incubated with fluorophore-conjugated secondary antibodies for 1 h. Images were captured using a fluorescence microscope (Zeiss).
RNA-seq and bioinformatic analysis
Sequencing data were filtered using SOAPnuke (v1.5.2) [32]. First, the reads containing sequencing adapters were removed. Next, reads with a low-quality base ratio (base quality ≤ 5) greater than 20% were filtered out. Third, reads containing an unknown base (N’) exceeding 5% were discarded. Subsequently, the resulting clean reads were stored in FASTQ format. Next, the clean reads were aligned to the reference genome using HISAT2 (v2.0.4) [33] to determine their genomic locations. Subsequently, Bowtie2 (v2.2.5) [34] was used to align the clean reads with the reference coding gene set. Gene expression levels were quantified using RSEM (v1.2.12) [35]. A heatmap was created using Pheatmap (v1.0.8) to visualize gene expression patterns across different samples. To identify differentially expressed genes between samples, DESeq2 (v1.4.5) was employed with a significance threshold set at a Q value ≤ 0.05. To gain insights into the phenotypic changes, enrichment analysis of the annotated differentially expressed genes was performed using Phyper (hypergeometric test). This analysis involved the Gene Ontology (GO) and KEGG databases (http://www.geneontology.org/ and https://www.kegg.jp/). To ensure reliable results, the significance levels of enriched terms and pathways were corrected for multiple testing using the Bonferroni method, employing a stringent Q value threshold of 0.05.
scRNA-seq data analysis
The Seurat package (version 4.0) [36, 37] was used to perform the dimension reduction and clustering analyses. (GSE149614) Firstly, a raw UMI count matrix is used to create a Seurat object. To normalize the expression of genes with the parameter “scale.factor = 100,000”. Subsequently, based on “JackStraw” results, top 30 significant PCs were chosen to construct a KNN graph and run non-linear dimensional reduction (tSNE). “FindClusters” function was used to cluster the cells with the parameter “resolution = 0.5”. To explore the finer heterogeneity among cells, certain clusters were reanalyzed using similar pipelines and appropriate parameters. Differential gene-expression analysis was performed using “FindAllMarkers” function. To calculate gene signature scores, multiple gene signature scores were calculated based on the scRNA-seq data. For each gene signature, individual cells were scored using the R package AUCell, which calculates the average expression levels of selected genes at the single-cell level. To analyze the similarities and differences in MDSCs between PPARAhi and PPARAlow, the DESingle package was used. To identify cell types, clusters of the same cell type were selected for re-tSNE analysis, graph-based clustering, and marker analysis. To exploit transcription factors (TFs) and cis-regulatory sequences, the R/bioconductor package SCENIC was used, as follows: (i) GENIE3, to identify potential TF targets based on co-expression; (ii) RcisTarget, to perform the TF-motif enrichment analysis and identify the direct targets (regulons); and (iii) AUCell, to score the activity of regulons (or other gene sets) on single cells [38].
Lentiviral transduction for gene knockdown
Knockdown of the indicated genes was performed using short hairpin RNA as previously described [39]. shRNAs for the indicated genes were obtained from Santa Cruz Biotechnology (sc-29496-V). Three short shRNAs for each target gene were selected for further analysis. For lentivirus transduction, MDSCs cultured in DMEM plus 10% FBS in 6-well plates were transfected using Lipofectamine 3000 reagent (Thermo Fisher Scientific) according to the manufacturer’s instructions. The medium was changed 6 h after transfection, and the cells were cultured at 37 °C for subsequent experiments.
Statistical analysis
Data are shown as the mean ± S.D. Unpaired Student’s t-test was performed to evaluate the statistical differences between the two groups. For multiple comparisons, data were analyzed by one-way or two-way analysis of variance (ANOVA) using SPSS software (version 20.0; IBM Corporation, Armonk, NY, USA). If equal variances were assumed, Tukey’s test was used; otherwise, Dunnett's T3 test was used. For survival analysis, Kaplan–Meier survival curves were plotted using the log-rank test. Statistical significance was set at p < 0.05. Data were visualized using GraphPad Prism version 9.


留言 (0)