
記住我


For each pembrolizumab-containing treatment, a Markov decision model displaying a standard-of-care-based (all patients receive pembrolizumab-containing treatment) and a predictive-biomarker-based strategy (only patients identified as responders receive pembrolizumab-containing treatment) was constructed. In the predictive-biomarker-based strategy, a hypothetical predictive biomarker was applied that was perfectly able (ROC-AUC of 1.0) to identify responders to pembrolizumab before start of first-line pembrolizumab-containing treatment. Responders were defined as patients experiencing no clinical and/or radiological progression or death due to disease progression within the first 12 months of pembrolizumab-containing treatment, corresponding to 40%, 45%, and 30% of patients for pembrolizumab monotherapy, pembrolizumab-pemetrexed-platinum, and pembrolizumab-carboplatin-paclitaxel treatment, respectively [22,23,24]. The Markov decision models simulated patients with advanced NSCLC eligible for first-line pembrolizumab-containing treatment in 80 cycles of 6 weeks over a lifetime horizon. Lifetime horizon gives the best overview of the total (subsequent) consequences of the intervention at hand. The cycle-length of 6 weeks best reflects the treatment course of the patient pathway. A half cycle correction was applied using Simpson’s one-third rule [25]. A healthcare system perspective from the Netherlands was adopted.
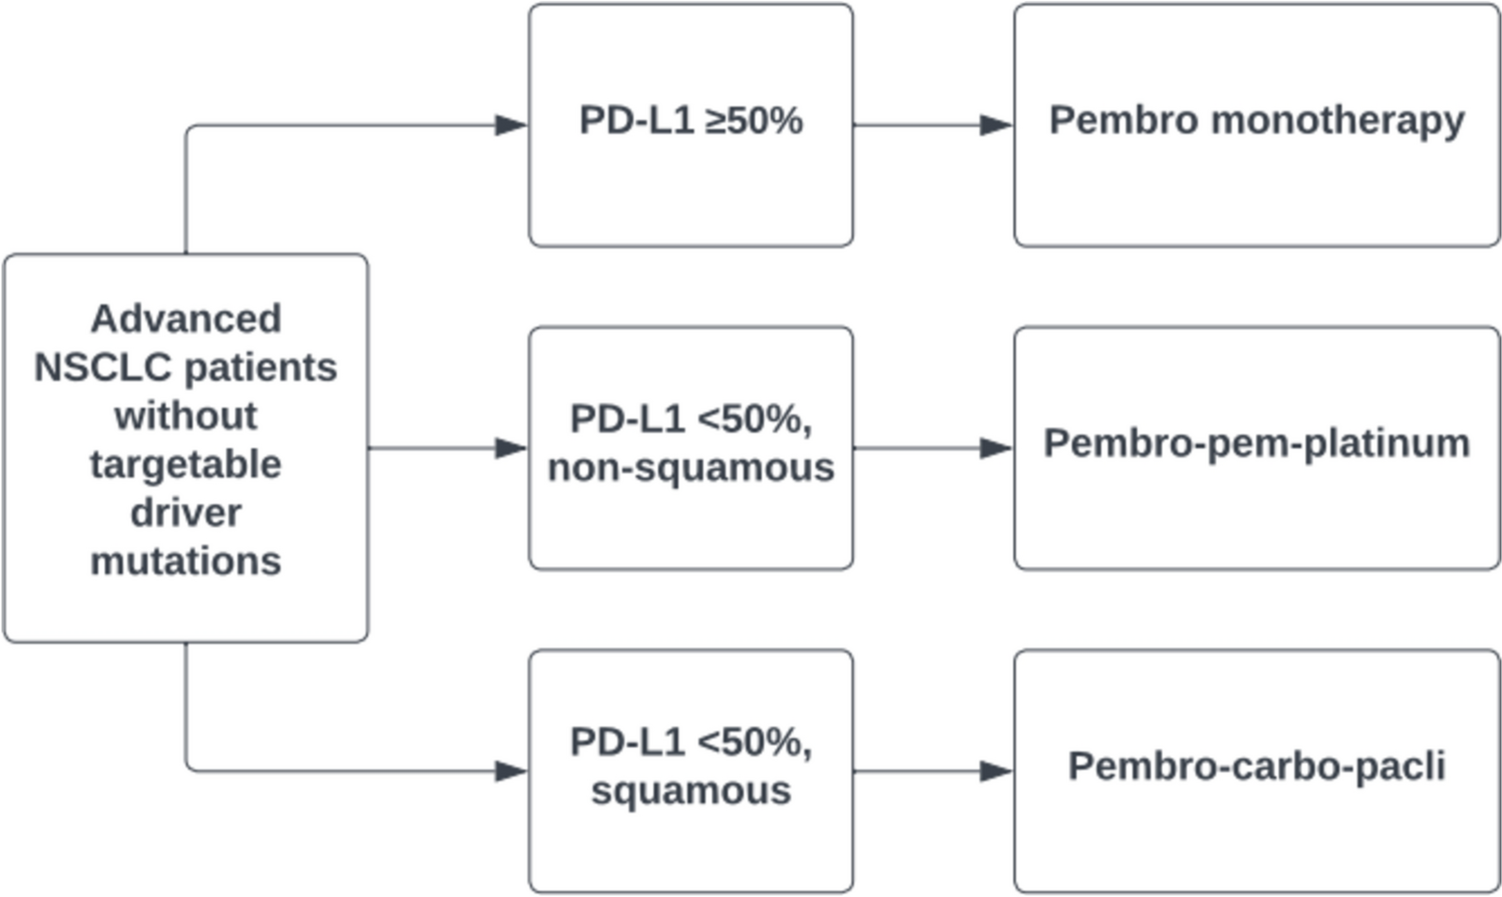
2.1 Characteristics of Patients with Advanced NSCLC Eligible for Pembrolizumab-Containing TreatmentA total of three different pembrolizumab-containing treatments are currently European Medicines Agency-approved and prescribed according to European Society for Medical Oncology (ESMO) guidelines for first-line treatment of patients with advanced NSCLC without targetable driver mutations on the basis of a patient’s tumor PD-L1 expression and histology: (a) pembrolizumab monotherapy for patients with a tumor PD-L1 expression ≥ 50% (regardless of tumor histology, approximately 40% of patients), (b) pembrolizumab treatment in combination with platinum-based chemotherapy and pemetrexed for patients with non-squamous NSCLC with a tumor PD-L1 expression < 50% (approximately 50% of patients), and (c) pembrolizumab treatment in combination with platinum-based chemotherapy and paclitaxel for patients with squamous NSCLC with a tumor PD-L1 expression < 50% (approximately 10% of patients) (Fig. 1) [26,27,28,29,30,31]. Note, however, that patients who present with highly aggressive disease (e.g., large tumor bulk, high symptom burden, and rapid clinical deterioration within the first weeks during the diagnostic process) preferably receive pembrolizumab treatment in combination with platinum-based chemotherapy even though their tumor has a PD-L1 expression ≥ 50%. This is applicable for approximately 30% of patients with a tumor PD-L1 expression ≥ 50% [32].
Fig. 1
Overview of pembrolizumab-containing treatments for first-line treatment of patients with advanced NSCLC without targetable driver mutations based on tumor PD-L1 expression and histology based on current ESMO guidelines [30, 31]. NSCLC non-small cell lung cancer, PD-L1 programmed death-ligand 1, pembro pembrolizumab, pembro-pem-platinum pembrolizumab plus pemetrexed plus platinum-based chemotherapy, pembro-carbo-pacli pembrolizumab plus carboplatin plus paclitaxel, ESMO European Society for Medical Oncology
As reported by Dutch real-world studies, the majority of patients who receive first-line pembrolizumab-containing treatment are male, are approximately 60–75 years old, have a body mass index (BMI) of approximately 25.0, are active or former smokers, have an Eastern Cooperative Oncology Group (ECOG) performance score of 0 or 1, and have no (relative or absolute) contraindications for receiving pembrolizumab-containing treatment (e.g., hypersensitivity to pembrolizumab-containing treatment and its components, pregnancy and lactation, presence of autoimmune disorders, history of organ transplantation, etc.) [33, 34]. A minority of patients has an ECOG performance score of 2 and/or brain metastases [33, 34].
2.2 Markov Models for Each Pembrolizumab-Containing TreatmentFor each of the three pembrolizumab-containing treatments, a Markov model of a standard-of-care-based and a Markov model of a predictive-biomarker-based strategy was compared. The Markov model for the standard-of-care-based strategy consisted of four different health states: (a) first-line treatment, (b) second-line treatment, (c) best supportive care, and (d) death (Fig. 2A). In this model, all patients started with pembrolizumab-containing treatment in the first-line treatment health state. After progression in the first line, patients received second-line treatment or best supportive care. After progression on a second-line treatment, patients received best supportive care. Patients could die in the health states first-line, second-line, and best supportive care, after which they transferred to the death health state. In the predictive-biomarker-based strategy, only patients classified as responders started with pembrolizumab-containing treatment in the first-line health state. Patients classified as non-responders by the predictive biomarker received an alternative first-line treatment option or best supportive care in the first line (depicted as a fifth tunnel health state in Fig. 2B) if other treatment options could not be prescribed due to poor general health status, unwillingness to undergo treatment, or comorbidities. After progression on alternative treatment options in the first line, patients received second-line treatment or best supportive care. After progression on a second-line treatment, patients received best supportive care. Patients could die in the health states first-line, first-line best supportive care, second-line, and best supportive care, after which they transferred to the death health state. The overall structure of our Markov models compares with previously published models that have compared a Markov model reflecting a predictive-biomarker-based strategy with a Markov model reflecting a standard-of-care-based strategy in treatments used for cancer [35, 36].
Fig. 2
Schematic illustrations of the adopted Markov models. (A) Markov model adopted for the best supportive-care-based strategy with the four different health states. (B) Markov model adopted for the predictive-biomarker-based strategy, including a fifth tunnel health state. BSC best supportive care
2.3 Treatment Options Within the Standard-of-Care-Based Versus the Predictive-Biomarker-Based StrategyA comprehensive overview of the different treatment options for the standard-of-care-based versus the predictive-biomarker-based strategy within each pembrolizumab-containing treatment is provided in Supplementary Material 1A–C.
Within the standard of care-based strategy, all patients started with pembrolizumab-containing treatment according to ESMO guidelines. Second-line treatment options were based on guidelines from the ESMO and supplemented with Dutch clinical guidelines [30, 37].
Within the predictive-biomarker-based strategy, the proportion of responding and non-responding patients was estimated for each pembrolizumab-containing treatment regimen using the 1-year progression-free survival rate derived from historical real-world data available in literature [22,23,24]. Patients classified as responders started with pembrolizumab-containing treatment, following thereafter the same sequence as the standard-of-care-based strategy. Patients classified as non-responders, on the contrary, received an alternative, best available, first-line treatment option or best supportive care (Supplementary Material 1A–C). Note that non-responders, who directly received best supportive care as first-line treatment, could only enter the death health state and not receive a second-line treatment upon progression. Similar to the standard-of-care-based strategy, both first-line and second-line treatment options were based on ESMO and Dutch clinical guidelines in the predictive-biomarker-based strategy [30, 37]. We additionally tailored our assumptions to clinical practice on the basis of insights obtained through an online questionnaire that was completed by 18 Dutch pulmonologists specialized in thoracic oncology. The survey included questions regarding alternative first-line treatments and the desired accuracy of the predictive biomarker (Supplementary Material 2).
2.4 Model InputSurvival, utility scores, and costs were predominantly determined on the basis of published peer-reviewed literature and Netherlands cancer registry data for each treatment option within each health state of the three pembrolizumab-containing treatments (Supplementary Material 3A–D). Peer-reviewed literature was derived from PubMed between August 2022 and December 2023 by performing a targeted search on real-world and clinical trial data available for the different treatment options enlisted in Supplementary Material 1A–C. Literature was firstly only used if the treatment option was investigated within the same target population (on the basis of tumor characteristics, line of treatment, and previously received treatments) as our models applied to. However, literature that was only available for a different line of treatment and/or after a different previous-line treatment than simulated within our models was later also included. The model input values and their distribution for each parameter in the standard-of-care-based and predictive-biomarker-based strategy are enlisted in Supplementary Material 3A–D. These values were simulated 1000 times, obeying their specific distributions in the probabilistic analysis.
2.4.1 ProportionsFor the first-line and second-line health states that include more than one available treatment option, the proportion of patients receiving a specific treatment option was based on both literature and insights obtained through expert opinion of two pulmonologists specialized in thoracic oncology (B.P. and M.v.d.H.). The proportions for transition from first-line treatment to second-line treatment versus best supportive care upon progression were based on expert opinion (B.P. and M.v.d.H.) and beta distributed. Dirichlet boundary conditions were applied when more than two treatment options were available to guarantee a cumulative proportion of one. Input parameters for the model can be found in Supplementary Material 3D.
2.4.2 Treatment Effects (Survival Estimates)Survival was based on real-world data, and if not available, clinical trial data derived from literature. Input parameters for the model can be found in Supplementary Material 3A. For each treatment option and for best supportive care, individual patient survival data were extracted from published Kaplan–Meier curves and accompanying risk tables using the IPDfromKM R package, which is based on the Kaplan–Meier estimation method and an iterative Kaplan–Meier algorithm [38,39,40]. Next, multiple survival curves were fitted onto the individual patient survival data using the survival analysis method described by Hoyle et al. [41]. The best fit for survival was selected on the Akaike information criterion (AIC), Bayesian information criterion (BIC), the mean squared error (MSE), and bias during lifetime follow-up. Survival estimates beyond follow-up reported in both real-world studies and clinical trials were aligned with clinical expectations of survival by two pulmonologists specialized in thoracic oncology (B.P. and M.v.d.H.) on the basis of clinical experience. The goodness-of-fit results are shown in Supplementary Material 4. The Weibull function emerged as the most suitable model for accurately fitting overall survival and progression-free survival data, enabling the generation of time-varying transition probabilities for most treatment options. For best supportive care (in both the standard-of-care-based and predictive-biomarker-based strategy, as first-line and second-line treatment options) and responders to pembrolizumab-containing treatment (in the predictive-biomarker-based strategy), survival exhibited the best fit with an exponential function, which was subsequently applied to calculate corresponding transition probabilities. The transition probabilities between health states in the Markov models are directly derived from these survival functions. Uncertainty of parameters of the survival functions were extracted from the fit of the survival function onto the individual patient survival data. Finally, the parameters of the survival function were simulated from a multivariate normal distribution using the MASS R package in the probabilistic model [42].
The survival functions differ between the standard-of-care-based and the predictive-biomarker-based strategy for first-line treatment (Fig. 3).
Fig. 3
Survival functions applying to the overall survival in the first-line health state for the first 3 years. The black dotted line displays the median overall survival. Panel A: standard-of-care overall survival function of the first-line health state treatment composed of pembrolizumab-containing treatment (Weibull, here displayed pembrolizumab monotherapy). Panel B: predictive-biomarker overall survival functions, in green: responders (no death until 1 year, then exponential overall survival function based on individual patient survival data of responders); in red, striped: pemetrexed-platinum (Weibull); in red, dots: gemcitabine-platinum (Weibull); in black: proportionally combined overall survival function of pembrolizumab-containing treatment plus pemetrexed-platinum plus gemcitabine-platinum. Note that an inferior median overall survival for the proportionally combined overall survival function (panel B) is observed when compared with the standard-of-care overall survival function (panel A) due to a relatively high proportion of patients receiving alternative treatment options that are associated with a marked inferior overall survival when compared with pembrolizumab-containing treatment. The proportions of patients receiving each treatment option are included in Supplementary Material 3D
In the standard-of-care-based strategy, one survival function was used for all individuals in first-line treatment, as all individuals received pembrolizumab-containing treatment (Fig. 3A).
In the predictive-biomarker-based strategy, however, two survival functions were used: one function for individuals classified as responders and one survival function for individuals not classified as responders (Fig. 3B). Responders in the predictive-biomarker-based strategy remained alive and progression-free in the first 12 months of treatment, since response was defined as no progression or death within the first 12 months of pembrolizumab-containing treatment. Hence, the proportion of responders corresponds to the proportion of patients that did not experience an event in the real-world pembrolizumab studies that were used [22,23,24]. For the period beyond 12 months, a survival function was applied that was based on individual patient survival data for the subgroup of responders to each pembrolizumab-containing treatment only [22,23,24]. For individuals not classified as responders, survival functions associated with the treatments other than pembrolizumab-containing treatments or best supportive care were applied.
2.4.3 CostsFor each cycle of 6 weeks, costs associated with each treatment option were determined within the health states of the three pembrolizumab-containing treatments. For each treatment option, the costs of (a) the treatment itself, (b) co-medication(s) (if applicable), and (c) stay at the outpatient clinic where intravenous treatments were administered, were calculated. Treatment costs and costs for co-medications were based on costs provided by the Dutch National Health Care Institute [43, 44]. Costs of the outpatient clinic for intravenous administered treatments were calculated by a weighted average cost of the day admissions across three—both academic and non-academic—Dutch hospitals in 2023 (DBC code: 020117017) [45,46,47]. In the probabilistic model, all treatment-associated costs were gamma distributed. Since the costs of the hypothetical predictive biomarker are unknown, a uniform distribution was applied for these costs with minimum and maximum costs of €50 and €1500, respectively. All costs used in the model are in euros (€). Currency values are based on 2023 rates. Input parameters for the model can be found in Supplementary Material 3C.
2.4.4 Quality of Life (Utilities)All QoL values (utilities) were derived from studies that examined the three-level EuroQol 5 Dimension (EQ-5D-3L) index scores collected from multiple relevant phase III clinical trials [48,49,50,51], except for all targeted therapies and first- and second-line best supportive care. For these options, the five-level version of the EQ-5D (EQ-5D-5L) was used [52, 53]. These clinical studies were conducted in several Western countries, and no adjustments were made using a Dutch value set for the EQ-5D index scores, as these were considered comparable to Dutch values. Note that the EQ-5D index scores comprise health-related QoL. The EQ-5D index scores already encompass negative (side) effects (“disutilities”). Therefore, additionally including disutilities in our model was not needed. For most of the phase III clinical trials, baseline characteristics of the included patients with advanced NSCLC are similar to those of the patients in the Netherlands (e.g., histological characteristics, mutation status, disease stage) [49, 50, 52, 54]. A difference, however, can be seen in the type of first-line treatment prescribed for the patients who receive docetaxel or a targeted treatment other than a KRAS inhibitor as second-line treatment. For second-line docetaxel, QoL scores were obtained from the CheckMate 057 trial in which patients were included after progressing on first-line chemotherapy treatment only and not on chemotherapy in combination with ICI treatment [50]. For targeted treatment with a KRAS inhibitor and an agent other than a KRAS inhibitor, we used QoL scores calculated for second-line treatment with osimertinib, which were derived from a trial where osimertinib was only prescribed after progression on previous targeted treatment in patients with advanced NSCLC with an EGFR mutation [53]. Patients who received chemotherapy with or without ICI treatment were therefore not included in this trial. For the QoL scores corresponding to best supportive care in the first line and in subsequent treatment lines, we used scores calculated for first-line and second-line best supportive care, respectively [51, 52]. For best supportive care in the first line, we applied the score calculated for patients with an ECOG performance score of 1, since we assumed that patients who receive best supportive care in the first line are fitter than those receiving best supportive care after having already progressed on different lines of treatment. All utility scores were beta distributed. Input parameters for the model can be found in Supplementary Material 3B.
2.5 Model ValidityModel assumptions and input parameters were checked for validity by consulting two pulmonologists specialized in thoracic oncology (B.P. and M.v.d.H.). The validity was checked and recorded using the Assessment of Validation Status of Health-Economic Decision Models Checklist by two of the authors (L.O. and A.B.) (Supplementary Material 6) [55].
2.6 Analyses2.6.1 Model OutcomesModel outcomes included mean total (a) costs in euros (€), (b) survival (life years (LYs)), (c) survival corrected for QoL (quality-adjusted LYs (QALYs)), and (d) net monetary benefit (NMB) per patient for both the standard-of-care-based and predictive-biomarker-based strategy within each pembrolizumab-containing treatment. In addition, the mean incremental costs, incremental LYs, incremental QALYs, and incremental cost-effectiveness ratio (ICER) were calculated for each pembrolizumab-containing treatment. Furthermore, weighted mean outcomes for the overall population were calculated, taking into account all three pembrolizumab-containing treatment regimens. The outcomes were weighted on the basis of the proportions observed in a real-world Dutch clinical study: 50% for pembrolizumab monotherapy, 33% for pembrolizumab-pemetrexed-platinum and 17% for pembrolizumab-carboplatin-paclitaxel [32]. For the ICER, a willingness-to-pay (WTP) threshold of €80,000 per QALY was applied, corresponding to the official Dutch WTP threshold that is applied in the situation of a cancer patient population with high disease burden in the Netherlands [56, 57]. Survival outcomes were discounted with 1.5%, and costs with 3%, according to Dutch guidelines [58]. On the basis of the Dutch criteria for cost-effectiveness, the implementation of a predictive biomarker was assumed to be cost-effective if it would not decrease survival or if the ICER (in the case of increased survival) would not exceed the threshold of €80,000 per QALY [57]. In case of an equivalence situation, the guidelines are not so clear. There are some publications providing guidelines for equivalence results, where a QALY loss would only be accepted using the position of a confidence interval in relation to a predefined acceptable difference in costs and effects in a non-inferiority trial [59].
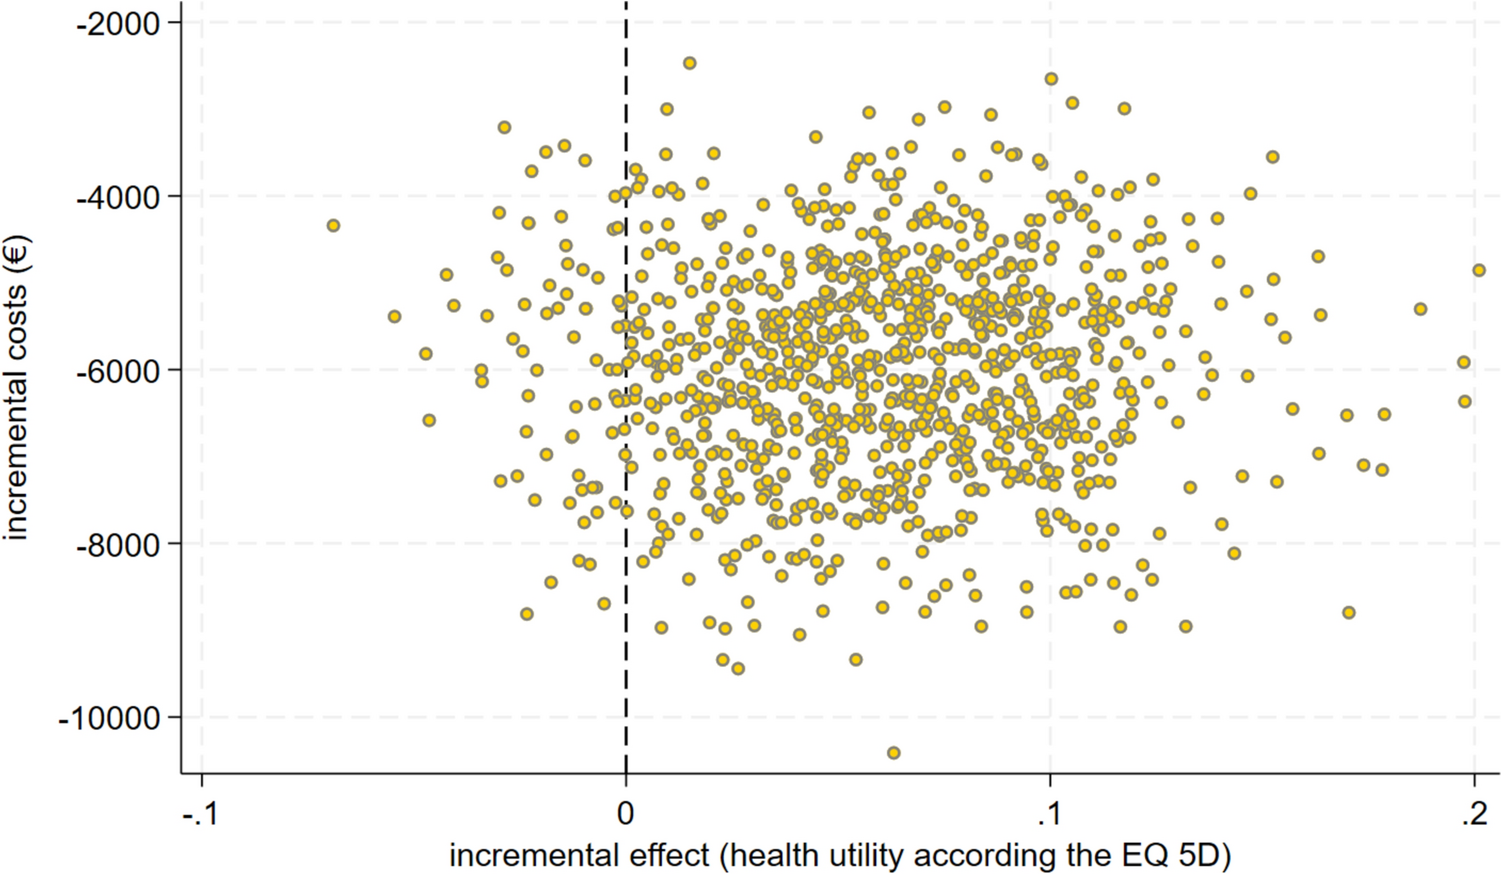
2.6.2 Sensitivity AnalysesTo verify the effect of parameters on the results’ uncertainty, we first performed a probabilistic analysis with 1000 simulations where parameters obeyed distributions as previously mentioned (Supplementary Material 3A–D). From this probabilistic analysis, the 2.5th and 97.5th percentile of each parameter were extracted as lower and upper values. The influences of these parameter’s values were evaluated as lower and upper boundaries in a deterministic one-way sensitivity analysis on incremental costs, LYs, and QALYs to provide a more comprehensive understanding of how plausible variations in these variables could impact the outcomes. Tornado diagrams were employed to evaluate the robustness of parameters and visually represent the results of the deterministic sensitivity analysis, including the top ten parameters with the most substantial influence on our model’s outcomes.
留言 (0)