2.1 Type of Economic Evaluation
This study employed a cost-of-control analysis, a variant of CEA, to evaluate the short-term economic impact of semaglutide 2.4 mg versus liraglutide 3 mg in achieving predefined weight loss targets over 68 weeks. Unlike traditional CEA, which assesses long-term outcomes such as quality-adjusted life years (QALYs) or disability-adjusted life years (DALYs) [26, 27], the cost-of-control approach focuses on specific clinical outcomes, such as the proportion of patients achieving weight-loss thresholds. This framework is particularly suited to short-term evaluations, addressing the needs of healthcare decision-makers managing constrained budgets [31].
The cost-of-control framework aligns closely with the clinical and economic priorities of managing obesity, particularly within this study, where EOPYY evaluates the direct medical costs required to achieve specific weight loss targets. By quantifying the financial resources necessary to meet weight loss goals over a 68-week horizon, this analysis provides decision-makers with practical, evidence-based insights to guide short-term policy decisions. Additionally, it is a valuable complement to traditional long-term cost-effectiveness analyses, which focus on broader, lifetime health outcomes.
2.2 Clinical Data
Clinical data were derived from the STEP-8 clinical trial, a randomized, open-label, 68-week, phase III trial conducted in the USA that compared the efficacy and safety of once-weekly semaglutide 2.4 mg and liraglutide 3 mg (both with diet and physical activity) in adults with BMI ≥ 30 or ≥ 27 with one or more weight-related comorbidities, without diabetes [22].
The baseline characteristics of the STEP-8 participants were balanced across treatment groups. The mean age was 49 years; most participants were white (73.7%) and female (78.4%) [22]. The mean body weight was 104.5 kg, and the mean BMI was 37.5 kg/m2 [22]. Most participants had up to two weight-related comorbidities at screening, with the most common being hypertension and dyslipidemia [22].
Efficacy outcomes included the proportion of patients achieving clinically meaningful weight-loss thresholds (≥ 5%, ≥ 10%, ≥ 15%, and ≥ 20%) and the mean percentage of weight loss from baseline. At 68 weeks, semaglutide 2.4 mg was associated with greater weight loss and a higher proportion of participants achieving all predefined weight-loss thresholds compared with liraglutide 3 mg (p < 0.001) [22]. The analysis did not include clinical data on improvements in obesity-related comorbidities, such as dyslipidemia or hypertension, as these benefits typically manifest over longer time horizons and fall outside the 68-week scope of this short-term cost-effectiveness analysis.
Adverse events, primarily gastrointestinal, which were predominantly mild to moderate in severity, were more frequent in the semaglutide versus the liraglutide group (84.1% versus 82.7%) but consistent with the known safety profile of glucagon-like peptide-1 receptor agonists [22]. The percentage of participants who discontinued treatment for any reason was 13.5% with semaglutide and 27.6% with liraglutide [22].
The STEP-8 reported mean weight change (%) from baseline to week 68, a figure used to calculate the cost per 1% weight reduction. The present cost of control analysis used observed proportions of patients reaching specific endpoints at 68 weeks (Table 1). The treatment policy estimand was employed by utilizing data from all randomized participants from the in-trial period irrespective of treatment adherence or rescue intervention initiation [22]. The decision to utilize efficacy data exclusively from the STEP-8 trial, rather than synthesizing evidence from other studies that compared liraglutide 3 mg and semaglutide 2.4 mg with placebo, was strategically decided to leverage the most direct and clinically relevant comparison between the two treatments.
Table 1 Observed proportion [% (standard error)] of patients achieving weight-loss-treatment targets at 68 weeks (treatment policy estimand)2.3 Cost Data
The present analysis was conducted from the third-party payer’s (EOPYY) perspective; hence, only direct medical costs were considered (Table 2). Indirect costs related to productivity losses, including absenteeism, presenteeism, or premature mortality, were not considered, given the analysis’s short-term time horizon. Additionally, direct nonmedical costs associated with compliance roles, training, monitoring systems, administrative fees, and support services were irrelevant to this study’s scope, as they do not pertain to the direct pharmaceutical costs borne by payers.
Table 2 Drug and consumable acquisition payer costsDrug costs for semaglutide 2.4 mg and liraglutide 3 mg were accounted for over 68 weeks, on the basis of the retail prices of the medicines after subtracting the patients’ co-payment (25%). Since semaglutide 2.4 mg is not currently priced in Greece, an analysis of available prices in Eurozone countries was conducted using official sources, as outlined by the Greek National Medicines Agency (EOF). According to Greek pricing regulations, the ex-factory price is derived from the average of the two different lowest ex-factory prices in Eurozone countries [32]. In the absence of a second Eurozone price beyond Germany, the wholesale price in Denmark (in euros), obtained from the Danish Medicines Agency, was used (Table 2). The list price of liraglutide 3 mg was retrieved from the most recently published drug price bulletin [33].
Both interventions were dosed according to the STEP-8 protocol. Liraglutide involved a 4-week titration period, starting at 0.6 mg per day in week 1 and increasing to 3 mg per day by week 4, followed by 64 weeks at the maintenance dose of 3 mg per day [22]. Semaglutide involved a 16-week titration period, starting at 0.25 mg per week in week 1 and increasing incrementally to 2.4 mg per week by week 16, followed by 52 weeks at the maintenance dose of 2.4 mg per week [22]. Liraglutide required daily injections, while semaglutide was administered weekly and did not require needles.
Costs related to blood glucose monitoring tools (e.g., test strips) were excluded, as resource use was assumed to be similar between treatments. Similarly, comorbidity-related costs (e.g., dyslipidemia and hypertension) were excluded, as their benefits often manifest over extended periods and fall outside this analysis’s 68-week scope.
2.4 Cost-of-Control Calculations
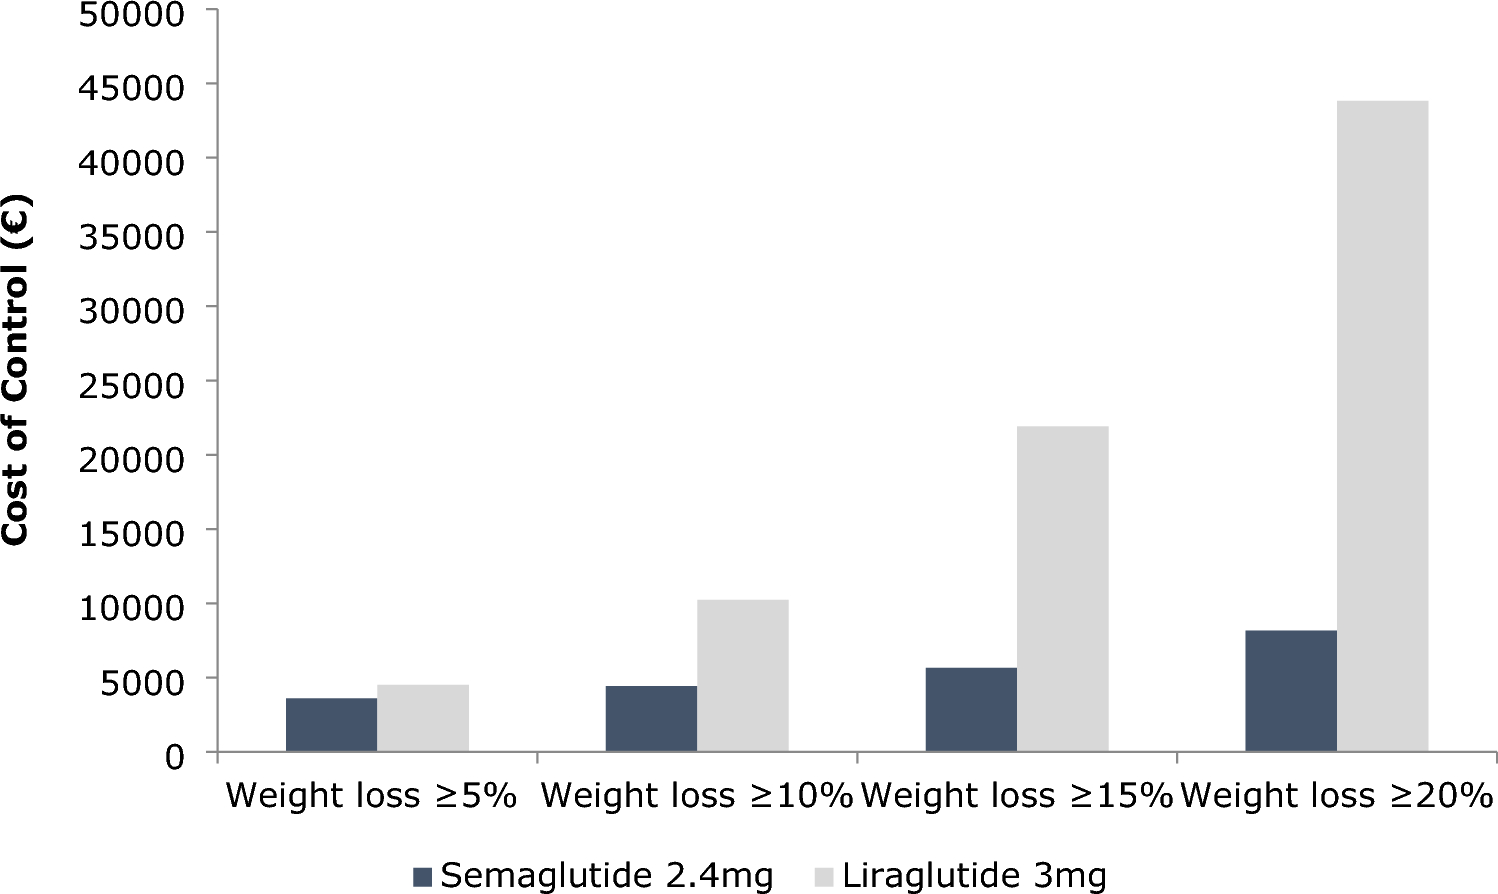
The cost-effectiveness of semaglutide 2.4 mg versus liraglutide 3 mg was evaluated using a cost-of-control (CoC) model constructed in Microsoft Excel. Outcomes were assessed for four clinically relevant weight-loss endpoints: ≥ 5%, ≥ 10%, ≥ 15%, and ≥ 20% weight loss (Table 1). The CoC for each drug at each endpoint was calculated by dividing the total drug acquisition cost by the percentage of patients achieving each target at 68 weeks. This framework offers a transparent and clinically focused approach for examining short-term cost-effectiveness, particularly in obesity management [24, 25, 30].
To further contextualize the results, the number needed to treat (NNT) was calculated to compare the relative efficacy of semaglutide with liraglutide. The NNT represents the number of patients who must be treated with semaglutide instead of liraglutide to achieve one additional patient meeting a specific weight loss target [35]. NNT values were computed for each weight-loss threshold using the formula: 1/(proportion of patients achieving each target) [35]. These NNT results were integrated into the CoC model to estimate the cost per patient achieving each weight loss target. The latter was calculated by multiplying the NNT for each target by the total treatment cost, offering a dual measure of efficacy and cost-effectiveness.
As is standard for economic evaluations with short-term time horizons, no discounting was applied in this analysis, which spans 68 weeks and includes a 52-week maintenance period [23]. The short-term nature of the study negates the need for discounting, aligning with accepted practices in health economics.
Additionally, the relative CoC of the two medications was examined. Relative efficacy was calculated as the ratio of the percentage of patients achieving each weight loss target with liraglutide 3 mg to the corresponding percentage for semaglutide 2.4 mg, as reported in the STEP-8 trial. Similarly, the relative cost was derived by dividing the drug acquisition cost of liraglutide 3 mg by the cost of semaglutide 2.4 mg. These results were presented as relative CoC outcomes, expressed as the cost and efficacy of liraglutide relative to semaglutide (Supplementary File).
The outcomes were visualized on a cost-efficacy plane, where relative efficacy was plotted on the horizontal axis and relative cost on the vertical axis (Supplementary File). Semaglutide 2.4 mg served as the reference point (relative efficacy and cost set at 100%) and was represented by the equality line. Data points above the equality line indicate a worse cost-to-efficacy ratio for liraglutide, reflecting higher costs for equivalent efficacy or lower efficacy for equivalent costs. Conversely, points below the line represent a better cost-to-efficacy ratio for liraglutide, reflecting lower costs for equivalent efficacy or higher efficacy for the equivalent cost.
2.5 Sensitivity Analyses
To evaluate the robustness of the base case results, a deterministic sensitivity analysis (DSA) was conducted by varying key input parameters by ±20% (Supplementary File). These parameters included the two lowest list prices of semaglutide stock keeping units (SKUs) (derived from Eurozone countries) and the list price of liraglutide to account for potential pricing fluctuations. Clinical efficacy inputs, such as the proportions of patients achieving weight-loss thresholds (≥ 5%, ≥10%, ≥ 15%, and ≥ 20%) and the average percentage weight loss per drug as reported in the STEP-8 trial, were also varied. Additionally, the impact of potential deviations in adherence or dosing protocols was assessed by altering the maintenance dosing schedules for semaglutide (2.4 mg weekly) and liraglutide (3 mg daily).
A price scenario analysis was conducted to simulate potential price reductions for liraglutide (ranging from 1 to 90% of its original value) following the introduction of generics. This analysis evaluated whether such reductions could shift the average cost of control (CoC) across all weight loss targets, favoring liraglutide. Furthermore, a two-way scenario analysis examined the impact of simultaneous price reductions (1–90%) for semaglutide and liraglutide on the average CoC difference across all weight loss targets (Supplementary File). Across 8100 simulated scenarios, the analysis identified the pricing conditions under which liraglutide’s CoC could become favorable compared with semaglutide.
Lastly, a probabilistic sensitivity analysis (PSA) was performed using a second-order Monte Carlo simulation, incorporating the standard errors of the proportions of patients achieving the examined weight-loss endpoints. The NORMIV function was employed to simulate these proportions, which was consistent with established practices for modeling clinical outcomes. As Briggs, Claxton, and Schulpher highlighted, the normal distribution is particularly suitable for PSA when sample sizes are sufficiently large to satisfy the normality assumption under the central limit theorem [36]. This approach allows for structured incorporation of uncertainty around mean estimates, which are normally distributed owing to extensive data aggregation, ensuring the simulated results are statistically robust [36].
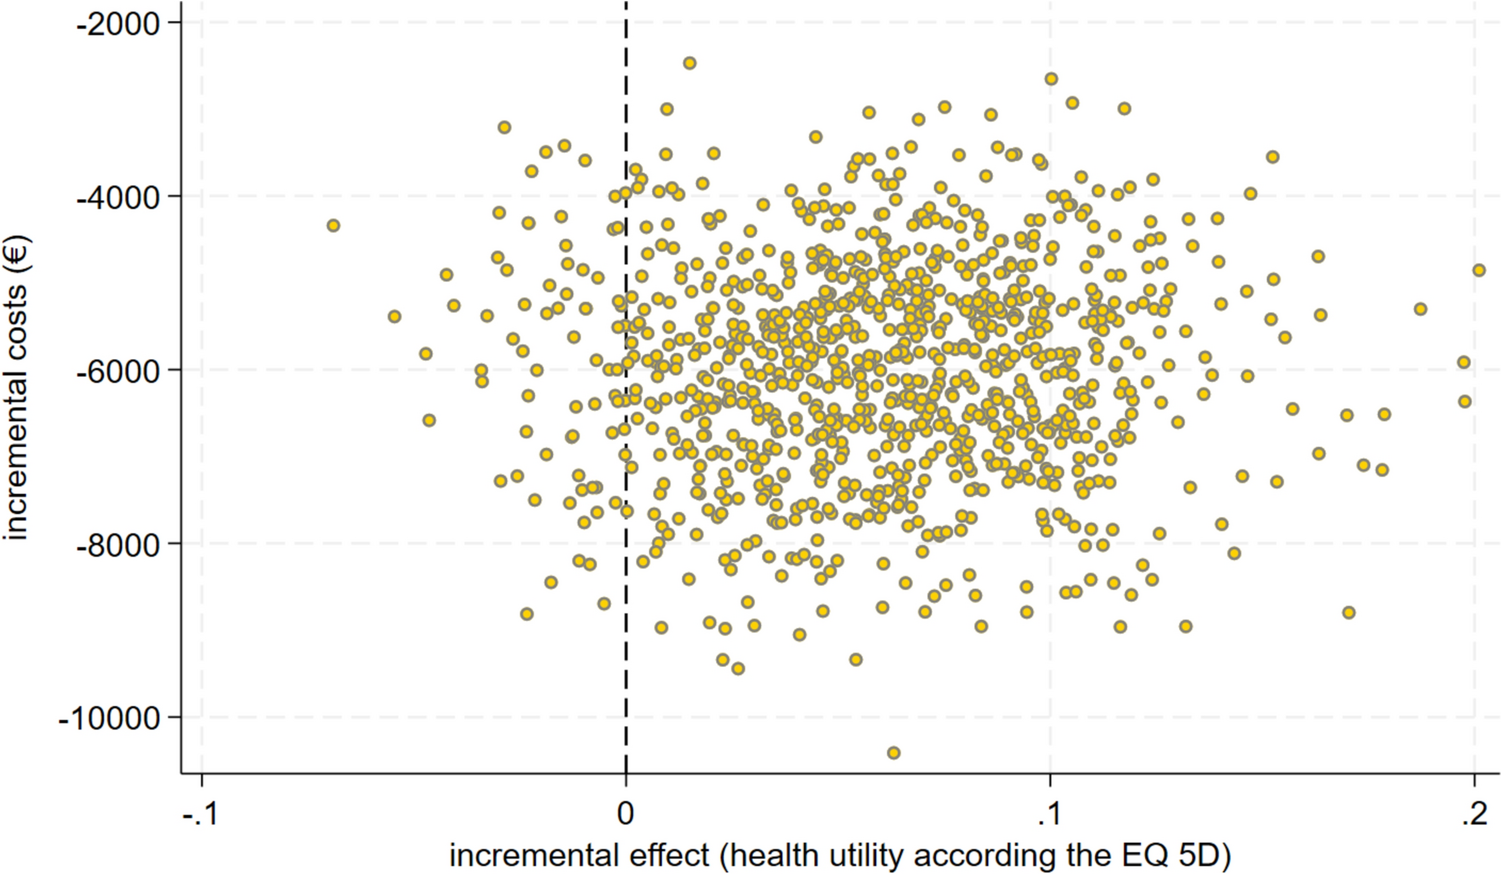
The PSA calculated the CoC for each intervention on the basis of the sampled proportions, repeating the process 1000 times. The results included the mean CoC for each intervention and the corresponding 95% confidence intervals constructed using the percentile method to reflect the variability in outcomes.


留言 (0)