
記住我


C57BL/6J mice were obtained from Hunan SJA Laboratory Animal Company (Hunan, China). Grm3flox/flox mice (Cat# S-CKO-00640), Cas9-EGFP[KI/+] mice (Cat# C001475), Pomc-Cre mice (Cat# C001448) and AgRP-Cre mice (Cat# C001249) were purchased from Cyagen Bioscience. The Avp-Cre mice (Cat# 023530) were purchased from the Jackson Laboratory. Sim1-Cre mice were designed and constructed by Cyagen Bioscience. To generate Sim1-Cre mice, a PCR amplicon containing an optimized internal ribosome entry sequence fused to Cre recombinase was inserted 3 bp after the Sim1 stop codon. Rcn2flox/flox and the complete Rcn2 knockout mice were purchased from BRL Medicine Inc. To generate Rcn2-floxed mice, two flox sequences were inserted into the two termini of Rcn2 exon 2 by using CRISPR/Cas9 technology. For genotyping, related reagent (AG12201) was purchased from ACCURATE BIOTECHNOLOGY(HUNAN) CO.,LTD, ChangSha, China. The genomic DNA was extracted from tail tips, and the primers of genotyping are:
Rcn2-L-loxp-F: TTCGCTCTAGGAGACCCTG;
Rcn2-L-loxp-R: GTCTTTGCTGCTCTTCGTG.
Rcn2-R-loxp-F2: AGTTCTTATGCCTGGAAGGTG;
Rcn2-R-loxp-R2: AAAGGTTTGGGCAAGTGTC.
Grm3-loxp-F: ATGTGGCACTCAGTTCCCAAATTA;
Grm3-loxp-R: GTCCTGCTATAGCTCAGTAGACAA.
Sim1-Cre-F1: TGGTTATGCCCTGGAACACTTAT
Sim1-Cre-R1: CCTTCCATGTGGTATACATGCTT
Sim1-Cre-F2: GCATGCCTATACATTGACTGGTTAT
Sim1-Cre-R2: CTTTGGCGAGAGGGGAAAGAC
Rcn2-KO-F: GAGAGGCCTTAGCAAGAGCG;
Rcn2-KO-R: AAGGTTTGGGCAAGTGTCTC.
Cas9-EGFP-F1: TGAGCGACATCCTGAGAGTG;
Cas9-EGFP-R1: GAGAGCTTTCAGCAGGGTCA.
Cas9-EGFP-F2: AAGGGAGCTGCAGTGGAGTA;
Cas9-EGFP-R2: CCGAAAATCTGTGGGAAGT.
Pomc-Cre-F: GCGGTCTGGCAGTAAAAACTATC;
Pomc-Cre-R: GTGAAACAGCATTGCTGTCACTT.
AgRP-Cre-F: GCTTCTTCAATGCCTTTTGC;
AgRP-Cre-R: AGGAACTGCTTCCTTCACGA.
The mice were housed in standard, specific pathogen-free facility at the Laboratory Animal Research Center of Central South University with controlled temperature (22–24 °C) and a 12-h dark/light cycle. The mice had free access to standard food (Hunan SJA Laboratory Animal Company, China) or high-fat food (Biopike, D12492) and water. The mice were maintained in good health and utilized for in-house mating to ensure an adequate supply for experiments. All animal care protocols and experiments were reviewed and approved by the Animal Care and Use Committees of the Laboratory Animal Research Center at Xiangya Medical School of Central South University.
Human sample studiesThe participants were recruited from Xiangtan First People’s Hospital. Blood samples from participants were centrifuged at 4 °C soon after sampling, then separated and stored at –80 °C. The studies were approved by the Ethics Committee at Xiangtan First People’s Hospital and written informed consents were obtained from all participants before collecting clinical data and samples (Ethical no. 2023110814, Ethical no. 2023063010). Plasma levels of Raptin and other biochemical index were measured using MS analysis and Sandwich ELISA assay.
Human brain tissuesHuman brain tissues used in the study were obtained from Human Brain Bank of Xiangya School of Medicine, Central South University. The studies were approved by the Ethics Committee at School of Basic Medical College, Central South University (Ethical no. 2020KT-37).
Cell cultureHypothalamic GT1-7 neurons and HEK293T cells were cultured in DMEM (Procell, PM150210) containing 10% fetal bovine serum (FBS), 100 U/mL penicillin (Pen), 100 μg/mL streptomycin (Strep) at 37 °C in a 5% CO2 humid atmosphere. Primary hypothalamus neurons were prepared from E18/19 mouse embryos as previously described.66 Briefly, the hypothalamus was dissected from E18/19 mouse embryos and kept in ice-cold dissection buffer containing HBSS (without CaCl2 and MgCl2), 1 M HEPES, and 1% Pen/Strep (v/v). A single-cell suspension was obtained through papain dissociation. Cells were then resuspended in neuronal plating media, composed of neurobasal media supplemented with 2% B27, 0.5 mM L-GlutaMAX, 55 μM β-mercaptoethanol, 10% FBS (all from Thermo Fisher Scientific), and 30 μg/mL insulin (Sigma Aldrich). The cell culture was maintained at 37 °C in a humidified incubator chamber under a 5% CO2 atmosphere.
For the experiments of glutamate treatment, GT1-7 neurons were cultured in DMEM supplemented with 10% fetal calf serum. To maintain a low concentration of ambient glutamate, cells were co-transfected with the cDNA of the glutamate transporter EAAC1 and incubated in DMEM Glutamax medium for at least 2 h before the different drugs were administered. Then GT1-7 cells were treated with glutamine-free medium containing 10 ng/mL Raptin or 50 μM glutamate for 30 min.
For the experiments of testing Raptin accumulation in cell lysates, the cells were treated with brefeldin A (5 ng/mL) plus monensin (5 ng/mL).
For the experiments testing Raptin accumulation in cell culture medium, the medium was collected and concentrated via ultrafiltration tube. The aprotinin (HY-P0017), LY2794193 (HY-119243), LY379268 (HY-103558), LY341495 (HY-70059) and VU0650786 (HY-108710) were purchased from MCE.
SF modelFor construction of SF mouse model, the intervention was performed as previously described.67 Each mouse was placed in an SF separate chamber. Mouse sleep is polyphasic, resulting in multiple bouts of sleep lasting 2–4 min throughout their sleep cycle. Thus, the sweep bar mounted at the bottom of the chamber moved along the bottom of the cage every 2 min during the ZT0–ZT16 to interrupt the sleep and was stationary during the ZT17–ZT24 for 8 or 9 weeks. The period of ZT0–ZT12 was around onset of the sleep cycle with high sleep need. Therefore, the SF resulted in decreasing sleep duration and bout length, and in increasing sleep state transition and waking. Mice in the SF chamber was maintained in a standard, specific pathogen-free facility at a controlled temperature (22–24 °C), with a 12 h dark/ light cycle (07:00 to 19:00 light on), with standard food and water provided ad libitum and environmental enrichments.
Metabolic cagesIndirect calorimetry was performed using a promethion metabolic cage system (Sable Systems International, USA). Mice were placed individually in chambers for 3 days under controlled conditions at a controlled temperature with 12-h light/dark cycles. Mice had free access to food and water. Respiratory measurements were taken at 20-min intervals following an initial acclimation period. Energy expenditure was calculated using the Lusk equation: energy expenditure in Kcal/h = (3.815 + 1.232 × RER) × \(}_}}\) in mL/min. Food intake was monitored within the metabolic chambers.
MS analysisFor MS analysis, proteins were extracted from the hypothalamus of mice with or without SF intervention. After digestion, samples were desalted using C18 Cartridges (Empore SPE Cartridges C18 standard density, bed I.D. 7 mm, volume 3 mL, Sigma Aldrich), concentrated by vacuum centrifugation and reconstituted in 40 mL of 0.1% (v/v) formic acid. LC-MS/MS sequencing and data analysis were conducted by Jingjie PTM BioLab (Hangzhou). Co. Inc. In brief, 100 mg peptide mixture of each sample was labeled using TMT reagent according to the manufacturer’s instructions (Thermo Fisher Scientific), and the mass of the peptides was identified by a Q-Exactive mass spectrometer equipped with a Nanospray Flex source (Thermo Fisher Scientific, USA). The MS/MS data were compared against the mouse fasta from UniProt using an in-house Proteome Discoverer (V2.4, Thermo Fisher Scientific, USA). Only peptides assigned to a given protein group were considered unique.
Western blot analysisWestern blot was performed as previously described.68,69 Cells and tissues were lysed in the RIPA buffer (P0013B, Beyotime) with protease inhibitors and phosphatase inhibitors (C600387, Sangon). The proteins of cell lysate were separated by SDS-PAGE and blotted onto polyvinylidene fluoride (PVDF) membranes. After blocking in 5% BSA, membranes were then incubated with the primary antibody at 4 °C overnight, followed by incubation with HRP-conjugated secondary antibody at 37 °C for 1 h. Protein bands were visualized using a chemiluminescence reagent and imaged by ChemiDoc XRS Plus luminescent image analyzer. The primary antibodies used were as follows: Rcn2 (10193-2-1201 AP, 1:1000, Proteintech), Flag (14793, 1:1000, Cell Signaling Technology), Tubulin (11224-1-AP, 1:5000, Proteintech), His (TA150088, 1:1000, Origene), p-Akt (4060, 1:1000, Cell Signaling Technology), T-Akt (4691, 1:1000, Cell Signaling Technology), Grm3 (ab283572, 1:1000, Abcam), β-Actin 1202 (81115-1-R, 1:5000, Proteintech), Khc (1:2000), Cyto1 (4272, 1:1000, Cell Signaling Technology). Silver staining was performed using fast silver stain kit (P0017S, Beyotime) according to the manufacturer’s instructions.
scRNA-seq analysisscRNA-seq data were obtained from the NCBI SRA database (GSE87544, GSE119960, GSE132355, GSE132730, and GSE148568).70,71,72,73 The scRNA-seq data were integrated using the Canonical Correlation Analysis (CCA) algorithm, resulting in a final integrated reference dataset. Cells with gene counts below 500 or mitochondrial content exceeding 10% were excluded through quality control. Subsequently, 50,087 high-quality single cells meeting these criteria were retained for downstream analysis. Dimension reduction and clustering were performed using functions from Seurat V5.0.1. The cells were grouped into 27 clusters utilizing the FindClusters function with the top 20 principal components and a resolution parameter set at 0.7. Visualization was achieved through a 2D Uniform Manifold Approximation and Projection (UMAP) algorithm using the RunUMAP and DimPlot functions. Marker genes for each cluster were identified using the FindAllMarkers function in Seurat, which compared positive markers within a given cluster against all remaining clusters.
Screening for endopeptidasesEndoprotease screening of RCN2 protein was performed in the MEROPS database. The MEROPS website (https://www.ebi.ac.uk/merops) and database were established in 1996 to present the classification and nomenclature of proteolytic enzymes. This database contains all the world’s known peptidases and their substrate cleavage site information. In the database, each protease is assigned a unique number (Peptidase Code). In brief, the endoprotease was screened by inputting the amino acid sequence around the cleavage site of Raptin (NDGR-LDPQ) in the database for subsequent research.
Immunofluorescence staining and histochemistryMice were anesthetized and 4% paraformaldehyde (PFA, w/v in PBS) solutions were infused intracardially. Subsequently, the brains, adipose tissues or stomachs were paraffin embedded. The same embedding procedure was applied to human brains. Brain, stomach, and adipose tissue slices with a thickness of 5–10 µm were cut using a microtome (Leica VT1200). After paraffin removal and antigen retrieval of the slices, sections were blocked with blocking solution at room temperature for 2 h. Then they were incubated with the primary antibody working solution (diluted with blocking solution) at 4 °C for 48 h. The primary antibodies used in this study were as follows: RCN2 (10193-2-AP, 1:200, Proteintech), NeuN (ab177487, 1:500, Abcam), Iba1 (sc-32725, 1:100, Santa Cruz Biotechnology), GFAP (3670S, 1:200, Cell Signaling Technology), KLK4 (26547-1-AP, 1:200, Proteintech), KLK1 (10815-1-AP, 1:200, Proteintech), GRM3 (ab283572, 1:200, Abcam), c-Fos (ab208942, 1:200, Abcam), AVP (20069, 1:200, Immunostar), VIP (63269, 1:200, Cell Signaling Technology), GRP (20073, 1:200, Immunostar), Anti-His (12698, 1:200, Cell Signaling Technology), POMC (ab254257, 1:200, Abcam), NPY (ab120208, 1:200, Abcam). Subsequently, the sections were incubated with the secondary antibody working solution (diluted with blocking solution; 1:500, Thermo Fisher, including Alexa Fluor 488, Alexa Fluor 555, Alexa Fluor 647, Alexa Fluor 594) at room temperature for 2 h. The slides were mounted by antifade with DAPI. Images were visualized on microscope or confocal microscope.
For multi-fluorescence staining, Tyramide signal amplification (TSA) technology was used when performing co-staining with primary antibodies of the same species origin. In brief, the first round of non-covalently bound antibodies was washed out by microwave treatment, and then a second round of incubation was performed with a secondary antibody. The cycle was repeated until all antibody incubations were completed, and the final images were obtained via microscope.
Full-length Rcn2 and Raptin synthesisFull-length human RCN2 was purchased from Abcam (ab105594). Full-length mouse Rcn2 and Raptin were both synthesized by Sino Biological Inc (China). Briefly, protein expression was performed as follows: 1) The target gene sequence (GCGGAGGAACTGCACTACCCGCAGGGCGAGCACCGGGCGGACTACGACCGCGAAGCGCTGCTGGGTGTCCAGGAAGACGTCGATGAGTATGTTAAACTTGGCCACGAAGAGCAGCAAAGACGATTGCAGTCGATCATAAAGAAAATTGACTCGGACTCTGATGGCTTTCTTACTGAAAATGAACTCAGTCAGTGGATTCAGATGTCTTTTAAGCATTACGCTATGCAAGAAGCCAAGCAGCAGTTTGTGGAGTATGATAAGAACAGCGACGGCGCTGTGACGTGGGATGAGTACAACATCCAGATGTACGACCGGGTGATTGACTTTGATGAGAACACTGCTCTGGATGACACAGAAGAGGGGTCGTTCAGGCAGCTTCATCTAAAGGATAAGAAGCGATTTGAAAAAGCTAACCAGGATTCAGGTCCTGGTCTGAGTCTTGAAGAGTTCATTGCGTTTGAGCACCCTGAAGAAGTTGACTATATGACGGAGTTCGTCATCCAAGAGGCTTTGGAAGAACATGACAAAAATGGCGATGGGTTTGTTAGTTTGGAAGAATTTCTTGGCGATTACAGGCGGGATCCAACTGCAAATGAAGACCCAGAATGGATACTTGTTGAAAAGGACAGATTTGTGAATGATTATGACAAAGATAATGATGGCCGGATCACCACCATCACCACCATCATCACCATTAA) was inserted into baculovirus vector followed by the generation of the recombinant baculovirus according to the manufacturer’s manual. 2) Recombinant baculovirus was amplified in cells to prepare high-titer virus stocks. 3) For protein expression, cells were infected with recombinant baculovirus following standard protocols and target protein was expressed under optimal conditions. Protein purification and analysis were performed as follows: 1) Cell culture supernatant was collected via centrifugation and loaded onto an affinity purification column. 2) Target protein was eluted from the column using elution buffer. Fractions containing the protein of interest were pooled and subjected to buffer exchange into formulation buffer. 3) Protein concentration of the final product was determined by UV or BCA assays. 4) The purity of the final product was analyzed by SDS-PAGE.
Raptin treatmentFor cell experiments, Raptin was used at 10 ng/mL for 30–60 min. Control group was treated with vehicle (PBS).
For electrophysiological experiments, Raptin was dissolved in ACSF at a concentration of 1 ng/mL and incubated with brain slices for 5–20 min. The firing rates of neurons were detected before and during Raptin incubation.
For ICV infusion of Raptin in vivo, Raptin was loaded into a sustained release pump and sustained released at a dose of 40 ng/h/g body weight at the indicated time ( ~12 days or 4 weeks). In the study of WT mice with HFD feeding, ICV infusion was initiated at 9 weeks and sustained for 12 days. In the study of SF mice or Sim1Cre;Rcn2flox/flox mice, ICV infusion was initiated at the 5th week of SF intervention and sustained for 4 weeks. In the study of Sim1Cre;Rcn2flox/flox mice with HFD, ICV infusion was sustained for 4 weeks.
Raptin was administered into dual tissue-specific Grm3 knockout mice via tail vein at a dose of 1 mg/kg/day every other day for 8 weeks. Raptin was injected intraperitoneally into WT mice once at a dose of 1 mg/kg/day. Control, vehicle-treated mice were injected with PBS.
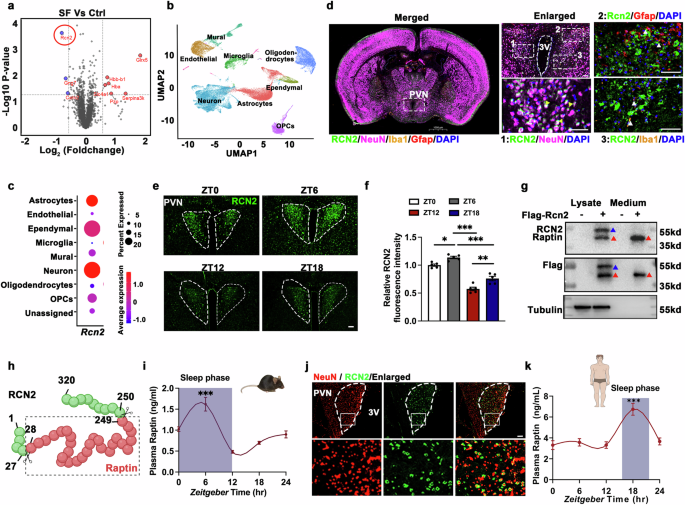
Antibody developmentTo evaluate plasma full-length RCN2 and Raptin levels, we produced two antibodies in company: antibody 1 specifically recognizing the RCN2 ranging from 28–249 amino acids; antibody 2 specifically recognizing the RCN2 ranging from 250–320 amino acids. The brief methods were described as follows: 10 male Balb/c mice (2–3 months, each weighing ~16–20 g) were immunized at a dose of 50 mg/mouse with the immunogen RCN2 fragment (232–267 amino acids of RCN2, LVEKDRFVNDYDKDNDGRLDPQELLSWVVPNNQGIA; this sequence includes the common fragment and different fragment of full-length RCN2 and Raptin) or His-tagged Raptin (28–240 amino acids of RCN2, AEELHYPQGEHRADYDREALLGVQEDVDEYVKLGHEEQQRRLQSIIKKIDSDSDGFLTENELSQWIQMSFKHYAMQEAKQQFVEYDKNSDGAVTWDEYNIQMYDRVIDFDENTALDDTEEGSFRQLHLKDKKRFEKANQDSGPGLSLEEFIAFEHPEEVDYMTEFVIQEALEEHDKNGDGFVSLEEFLGDYRRDPTANEDPEWILVEKDRFVNDYDKDNDGRHHHHHHHHHH) mixed with an equal volume of adjuvant (complete/incomplete Freund’s adjuvant). The adjuvant was purchased from BD Company (263910). After being mixed, they were injected subcutaneously at multiple points in the abdomen, with the second immunization at an interval of 2 weeks and the third immunization at another interval of 3 weeks. Serum titer was then measured after three immunizations. Spleens were taken for hybridoma fusion 3 days after enhanced immunization. One week after the last immunization, 50–60 mL blood was collected from the orbital vein cluster of mice. After standing at 4 °C overnight, the upper serum was separated by centrifugation for detection. An appropriate amount of detection protein was diluted to 5 mg/mL with coating buffer, then 100 μL was added to each well of the 96-well plate and coated overnight at 4 °C. The plate was washed with washing buffer at 200 μL/well once. Then the plate was sealed with 300 μL/well sealing buffer at room temperature for 1 h. The plate was washed with washing buffer twice, and then sample (gradient dilution sample and sample diluent at 100 μL/well) and detection antibody (100 μL/well to 96-well plate) were added to incubate at room temperature for 2 h. The plate was washed and added with reaction buffer at 200 μL/well, and placed at room temperature for 12 min. Finally, 50 μL/well termination buffer was added to stop the reaction, and the detection was carried out with a microplate analyzer at 450 nm wavelength. All spleen cells of immunized mice were mixed with mouse myeloma cells at a ratio of 1:1, and hybridoma cells were obtained by electrofusion method. Antigen protein was used to coat the well, the cell supernatant was analyzed by ELISA, and clones in positive wells were selected by dilution until a hybridoma cell line that stably secreted monoclonal antibodies was obtained.
ELISAA 96-well microplate was initially coated with 100 μL per well of the diluted Raptin capture antibody. Freshly diluted plasma samples were then added to the wells, and the plate was incubated at room temperature for 2 h. Subsequently, the HRP-Raptin detection antibody was added, and reacted with the TMB solution, leading to color change in the system. The reaction was halted with the addition of stop solution, and the absorbance at 370 nm was measured and standardized to determine Raptin concentration.
Raptin capture antibody and Raptin detection antibody were developed by Sino Biological Company. We labeled the detection antibody with HRP using HRP Labeling Reagent Kit (Innoreagents). In brief, the detection antibody was mixed with the reaction starter at 10:1 and incubated at 37 °C for 2 h. Subsequently, a termination agent was added to remove excess HRP at room temperature for 1 h. We had determined the most effective antibody combination of HRP-Raptin detection antibody and capture antibody through the following indicators and ultimately developed two available ELISA kits to test Raptin plus full-length RCN2 (called kit1 as below) or full-length RCN2 (called kit2 as below).
To ensure the reliability of Raptin concentration, we evaluated its performance from the following indicators: 1) Intra-assay accuracy: in a test, we conducted 14 repeated detections on each of three samples according to the above method. Then coefficient of variation (CV) for each sample was calculated to evaluate intra-assay accuracy. The CV for samples detected by two ELISA kits were both < 10%. 2) Inter-assay accuracy: we tested three samples in different 96-well microplates on different days, with each sample repeated 12 times. The CV for samples detected by two ELISA kits were both < 10%, which indicated good repeatability of this ELISA. 3) Dilution linearity: dilute three known concentration samples at a ratio of 1:10, 1:20, 1:40, 1:80, 1:160, and 1:320. Then, we detected the protein concentration of each diluted sample and compared the measured value with the expected value to evaluate the dilution linearity of two kits. 4) Rate of recovery: we added 1 µL target protein (Raptin or full-length Rcn2) to 100 μL blank plasma from complete Rcn2 knockout mice, mixed well, and then detected its concentration. The ratio of measured value to expected value after dilution was the recovery rate. The experiment was repeated three times, with an average recovery rate of 116.7% and 121.4%, respectively. 5) Sensitivity: we performed 64 independent tests on blank plasma and calculated the average value. The sensitivity is determined by adding two standard deviations to average value. The sensitivity is 0.22 pmol for kit1 and 0.46 pmol for kit2. 6) The detection range are 0.54 pmol–2.17 nmol (kit1) and 0.91 pmol–1.82 nmol (kit2).
To ensure the accuracy of ELISA kits, we added target protein (Raptin or full-length mouse Rcn2 or full-length human RCN2) to 100 µL plasma from complete Rcn2 knockout mice at a dilution rate of 1:1, 1:20, 1:40, 1:80, 1:160, and 1:320. Subsequently, the actual added concentration and actual measured concentration were found to be close without significance. In addition, we also added Raptin or full-length mouse Rcn2 simultaneously at a ratio of 1:1 into 100 µL plasma from complete Rcn2 knockout mice, and then measured the concentration using the two kits separately to ensure that we got the acute concentration of plasma Raptin through the value of kit1 (a pmol) minus the value of kit2 (b pmol). The final concentration of plasma Raptin equals to 0.046 × (a – b) ng/mL. The same processes were confirmed by human RCN2.
Viral vectorsWe used the following viruses:
AAV-Rcn2-Cre-EGFP, AAV-Rcn2-Cre, AAV-DIO-H2B-T2A-TVA, RV-EnvA-N2C(ΔG)-tdTomato, AAV-DIO-RVG, scAAV2/1-hSyn-Cre-WPREs, AAV-Avp-Flp-mCherry, AAV-fDIO-mCherry, AAV-fDIO-hM3D(Gq), AAV-fDIO-hM4D(Gi), AAV-EF1a-DIO-GCaMp6s-EGFP, AAV-DIO-hM3D(Gq)-WPREs/AAV-DIO-hM3D(Gq)-mCherry-WPREs, AAV-DIO-hM4D(Gi)-WPREs/AAV-DIO-hM4D(Gi)-mCherry-WPREs, AAV-DIO-WPRE-hGH-pA/AAV-DIO-mCherry-WPRE-hGH-pA, AAV-DIO-ChR2, AAV-fDIO-ChR2, AAV-Avp-Cre-mCherry, AAV-hSyn-EGFP, AAV-hSyn-Rcn2-EGFP, AAV-Nos1-Cre, AAV-Grm3-Flp-EGFP, AAV-Grm3-Cre-EGFP, AAV-hSyn-shKhc-EGFP. All viruses were purchased from BrainVTA (Wuhan, China) or Hanbio Tech (Shanghai, China), and the virus titers were greater than 5 × 10¹² v.g/mL.
Cre-DIO system and Flp-FRT system are both well-established ways to manipulate the neuronal activity.74 The AAV-Avp-Flp-mCherry or AAV-Avp-Cre-mCherry was injected into SCN to label SCNAVP neurons, AAV-Rcn2-Cre-EGFP were used to mark PVNRCN2 neurons, and AAV-Grm3-Cre-EGFP and AAV-Grm3-Flp-EGFP were used to mark PVNGRM3 neurons. To construct AAV-Rcn2-Cre-EGFP, we used the genomic region of the corresponding promoter of Rcn2, 2.3 kb chr9:55946941-55949240 (mouse GRCm39/mm39); to construct AAV-Grm3-Cre-EGFP, we used the genomic region of the corresponding promoter of Grm3, chr5:9775072-9777270 (mouse GRCm39/mm39).
Stereotaxic injectionsMice were anaesthetized with 0.5%–1.5% isoflurane (RWD Life Science Co., China) and fixed on the stereotaxic apparatus (RWD Life Science Co., China). Following the exposure and disinfection of the skin area above the skull, a small incision was made to expose the skull. Bilateral small holes were drilled using a fine burr drill over the specified stereotaxic coordinates. A microsyringe containing 50–150 nL of AAV was injected bilaterally into the target area at a rate of 50 nL/min. The coordinates, defined as dorsal–ventral (DV) from the brain surface, anterior–posterior (AP) from bregma and medial–lateral (ML) from the midline, were as follows: PVN (AP: –0.9 mm; DV: –4.7 mm; ML: ±0.25 mm) or SCN (AP: –0.58 mm; DV: –5.4 mm; ML: ±0.1 mm). After completion of the injection, which included a 10-min delay, the injection pipette was gradually withdrawn, and the scalp was sutured. After the surgery, mice were given time to recover from anesthesia on a heating mat before being placed back in their home cages.
RNAScope ISHTo detect mRNAs of Rcn2, Grm3 and Avp, RNAScope probes were constructed (Sunpharma Co., Ltd.). The probe sequences were listed as follows: Rcn2, 5′- GCCAAGUUUAACAUACUCAUCGACGUCUUC-3′;Grm3, 5′- ACACUGCUGUACGAACCGCCAAUGACUCCUG-3′; Avp, 5′- ACUCCCGUGUCCCAGCCAGCUGUACCAGCCUUA-3′. As previously described,75 ISH was performed with a detection kit (R0306S, Beyotime). Briefly, the slides were dehydrated in graded EtOH (50, 75, and 100%) for 3 min each and dried with cool air using an ImmEdge Pen prior to allowing the development of a hydrophobic barrier around the tissue. Samples were incubated in proteinase solution at room temperature for 10 min before washing in PBS, and then incubated with Rcn2, Grm3 or Avp probe at 60 °C for 16 h. All remaining washing steps were performed using wash buffer in the kit, unless otherwise stated. ISH signals for Rcn2, Grm3 or Avp were detected with Zeiss confocal microscope.
Retrograde tracingFor retrograde monosynaptic tracing, helper viruses including AAV-DIO-RVG, AAV-Rcn2-Cre and AAV-DIO-H2B-T2A-TVA were co-injected (1:1:1 ratio in 390 nL) into PVN of WT mice. Three weeks later, the ΔG-RV that encoded tdTomato (RV-EnvA-ΔG-tdTomato, 400 nL) was injected into the PVN region. Ten days after the last injection, the mice were perfused and the brain slices were collected for detecting the tdTomato signals of SCN and immunostaining with AVP-, VIP- or GRP-specific antibodies.
Anterograde tracingAnterograde tracing was performed as previously described. To anterogradely trace the SCN to PVN projection, scAAV2/1-hSyn-Cre-WPRE was bilaterally delivered into the SCN of mice and Cre-dependent virus (AAV-DIO-mCherry) was bilaterally injected into the PVN. Four weeks later, the mice were perfused, and its brain was sectioned for microscopy and incubated with RNAScope probe targeting Rcn2 mRNA.
In vivo fiber photometry for recording GCaMp signalsTo investigate functional transmission from SCNAVP neurons to PVNRCN2 neurons, viruses including AAV-AVP-Flp-mCherry, AAV-fDIO-hM4Di/hM3Dq/control were injected into the SCN of WT mice. Meanwhile, AAV-Rcn2-Cre and AAV-DIO-GCaMp6s-EGFP were injected into the PVN. As previously described,16,76 after virus injection, a ceramic ferrule with an optical fiber (200 mm in diameter, N.A. 0.37) was implanted with the optical fiber tip on top of PVN. The ferrule was secured on the skull with dental cement. After optical fiber implantation, antibiotics were applied to the surgical wound.
Three weeks after optical fiber implantation, GCaMp6s signals were recorded by a fiber photometry system (Thinker Tech, Nanjing, China). Recording steps were as follows: 1) Baseline recording: perform calcium signal recording under free-moving conditions for 15 min. 2) Intraperitoneal administration: mice received an intraperitoneal injection of CNO at a dose of 2 mg/kg body weight. 3) Post-administration recording: after intraperitoneal administration, continue measuring calcium signals in freely moving mice for 45 min. 4) The excitation light of 405 nm, 470 nm, and 570 nm light sources were merged into one beam through a dichroic mirror, which is then focused by an objective lens and coupled into the same multimode fiber. The laser beam was delivered by the optical fiber to excite GCaMP6s expressed in the target brain area. The excited fluorescence was collected by the same multimode optical fiber and converted into electrical signals reflecting different neuronal activity information by two weak-light detectors at the detection end. Data were analyzed using established methods. Briefly, we fit the calcium-independent isosbestic signal to the calcium-dependent signal and calculated change in fluorescence over baseline fluorescence (ΔF/F).
Chemogenetic manipulation in vivoFor chemogenetic manipulations of SCNAVP neurons, viruses (AAV-DIO-hM4Di-WPREs or AAV-DIO-WPREs) were injected into the SCN of Avp-Cre mice, respectively. Mice were intraperitoneally injected with CNO at a dose of 2 mg/kg body weight. After 1 h, the plasma Raptin level was measured and fluorescence staining of brain slice was performed. The 1-h or 5-h food intake was monitored upon CNO treatment.
For chemogenetic manipulations of PVNRCN2 neurons, viruses (AAV-Rcn2-Cre-EGFP with AAV-DIO-hM4Di-mCherry-WPREs or AAV-DIO-mCherry-WPREs or AAV-DIO- hM3Dq-mCherry-WPREs) were injected into the PVN of mice. Mice were then intraperitoneally injected with CNO at a dose of 2 mg/kg body weight. The plasma was collected for Raptin detection after 1 h of CNO treatment.
For chemogenetic manipulations of PVNGRM3 neurons or stomachGRM3 neurons, viruses (AAV-Grm3-Cre-EGFP with AAV-DIO-WPREs or AAV-DIO-hM3Dq-WPREs) were injected into PVN or stomach of mice. Mice were then intraperitoneally injected with CNO at a dose of 2 mg/kg body weight. After 1 h, the plasma Raptin, gastric emptying, and fluorescence staining of tissue slice were assessed. The 5-h food intake was monitored upon CNO treatment.
Electrophysiology in vitroCas9-EGFP[KI/+];Pomc-Cre mice and Cas9-EGFP[KI/+];AgRP-Cre mice were constructed to mark ARCPOMC neurons or ARCAgRP neurons. Grm3flox/flox or Sim1Cre;Grm3flox/flox mice were injected with AAV-Grm3-Flp-EGFP to mark PVNGRM3 neurons.
As previously described,77,78 the above mice were anesthetized with 1% pentobarbital sodium and subjected to cardiac perfusion with ice-cold NMDG cutting solution saturated with 95% O2/5% CO2 containing 93 mM NMDG, 93 mM HCl, 2.5 mM KCl, 1.2 mM NaH2PO4, 30 mM NaHCO3, 25 mM D-glucose, 20 mM HEPES, 5 mM Na-ascorbate, 2 mM thiourea, 3 mM Na-pyruvate, 10 mM MgSO4, and 0.5 mM CaCl2, pH 7.35 with NMDG or HCl. The brain was subsequently removed and sliced slowly with a vibrating microtome (VT 1200S; Leica Inc.). Coronal brain slices containing ARC or PVN were recovered at 37 °C for 90 min in a chamber filled with oxygenated ACSF containing 118 mM NaCl, 25 mM NaHCO3, 3 mM KCl, 1.2 mM NaH2PO4, 2 mM CaCl2, 2 mM MgSO4, and 10 mM glucoses, equilibrated with 95% O2/5% CO2. One half and an hour later, the holding chamber with slices was placed at room temperature and the slices were ready for patch-clamp recordings.
Slices were transferred to a recording chamber and carbogen-saturated ACSF was perfused constantly at a flow rate of 2–3 mL/min at room temperature. Raptin was added to ACSF at a concentration of 1 ng/mL. Neurons in ARC or PVN were visualized under a fluorescent infrared-phase-contrast (IR-DlC) Axioskop 2FS upright microscope, which was equipped with a Hamamatsu C2400-07E infrared camera. Recording electrodes (3–5 MΩ) were pulled with a Flaming-Brown Micropipette Puller (Sutter Instruments, Novato, CA, USA) using thin-walled borosilicate glass capillaries. Current-clamp recordings were conducted using electrodes filled with an intracellular recording solution containing 145 mM potassium gluconate, 1.3 mM MgCl2, 4 mM Na2ATP, 0.4 mM Na3GTP, 5 mM EGTA, 10 mM HEPES. Patch-clamp recordings were obtained with a MultiClamp 700B amplifier (Molecular Devices), a Digidata 1440 A analog-to-digital converter (Molecular Devices), and pClamp 10.7 software (Molecular Devices).
For optogenetics and electrophysiological recording in vitro,79Avp-Cre mice injected with AAV-DIO-ChR2 into the SCN and AAV-Rcn2-Cre-EGFP into the PVN were anesthetized with pentobarbital sodium. Then the brain slices containing SCN and PVN were ready for patch-clamp recordings as described above. Synaptic currents were evoked using a 473-nm laser (20 mW, 20 Hz, 5 s) through an optical fiber placed near the slice and connected to an intelligent optogenetic system (NEWDOON, Aurora-220). Photostimulation was triggered by TTL signals from Clampex software. Action potentials of PVNRCN2 neurons were recorded before and during photostimulation of SCNAVP neurons.
Optogenetics in vivoTo investigate the activation effect of SCNAVP neuron’s terminals on PVNRCN2 neurons and Raptin release, we expressed ChR2 in SCNAVP neurons via injection of AAV-DIO-ChR2 into the SCN of Avp-Cre mice or injection of AAV-DIO-ChR2 with AAV-Avp-Cre into the SCN of Sim1Cre;Rcn2flox/flox mice, while AAV-Rcn2-Cre were injected into the PVN to label PVNRCN2 neurons. In the study of combining chemogenetic and optogenetic manipulations, AAV-fDIO-ChR2 and AAV-Avp-Flp were injected into the SCN of mice, while AAV-Rcn2-Cre with AAV-DIO-mCherry or AAV-DIO-hM4Di-mCherry were injected into the PVN.
After virus injection, as previously described,80 the PVN of the above mice was implanted with a ceramic ferrule carrying an optical fiber (200 mm in diameter, N.A. 0.37). The ferrule was secured on the skull with dental cement. Antibiotics were applied to the surgical wound. 21 days after optical fiber implantation, a 473-nm laser was applied for generation of light pulses to activate SCNAVP neuronal terminals on PVN. The laser power was 20 mW, 20 HZ. Mice received 60 min of photostimulation. Plasma Raptin and food intake were monitored before and after photostimulation.
Glucose and insulin tolerance testsAs described previously,81 for the glucose tolerance tests, mice were intraperitoneally administered with glucose at a dose of 1.5 g/kg following an overnight fast. Blood glucose levels were monitored using the ACCU-CHEK active glucometer (Roche) at 0 min, 15 min, 30 min, 60 min and 120 min. In the insulin tolerance tests, mice were intraperitoneally treated with insulin at a dosage of 0.75 U/kg after a 6-h fast. Blood glucose levels were monitored at 0 min, 15 min, 30 min, 60 min, 90 min and 120 min.
ICV infusionThe experiment of ICV infusion was performed as described previously.77,82 For cannulae implantation, the mice were anesthetized with 4% isoflurane and their heads were fixed on a stereotaxic instrument (RWD). The calvaria was exposed, a 0.5 mm hole was drilled in the foredeep, and a 28-gauge cannula (brain infusion kit 2, ALZA) was implanted into the third ventricle (AP: –0.94 mm; DV: –4.8 mm; ML: 0 mm) by comparing the typical bregma-lambda distance with the one measured in the experimental animal. The cannula was fixed to the skull with cyanoacrylate and connected to a perfusion osmotic pump (ALZA) placed in the subcutaneous space of the mouse back with a tube and the skin was sutured. After the surgery, mice were given time to recover from anesthesia on a heating mat before being placed back in their home cages. For Raptin infusion, Raptin dissolved in PBS was added to the perfusion osmotic pump and the delivery rate of Raptin into the third ventricle was 40 ng/h/g body weight and the final metabolic phenotype was analyzed at the indicated time according to the experimental needs.
Intra-PVN cannulae and drug infusionAs previously described,82 for cannula implantation, mice with stereotaxic injection of AAV-Ctrl or AAV-shKhc were implanted with guide cannula for direct intra-PVN infusions. A 26-gauge stainless steel internal cannula that was 0.5 mm longer than the guide cannula (4.2 mm long, RWD) was used. For this purpose, animals were deeply anesthetized with 4% isoflurane and their heads were fixed in a stereotaxic frame. The skull was exposed, a single hole was drilled according to coordinates (PVN, AP: –0.9 mm; DV: –4.7 mm; ML: ±0.25 mm) and a guide cannula was implanted. Two screws were fixed to the caudal part of the skull to have an anchor point for the dental cement. Acrylic dental cement was finally used to fix the cannula and the skin was sutured.
For drug infusion, we used 0.5 μL injections containing either vehicle (0.9% NaCl) or GRM3 agonist (LY354740, 1 nM, MCE, HY-18941) dissolved in 0.9% NaCl. For this procedure, an internal cannula was lowered into the guide cannula, connected via polyten tubing to a Hamilton syringe that was placed in an infusion pump, and 0.5 μL of liquid was injected into PVN over a 2-min-period. After the injection procedure, the injectors were kept in place for an additional 1 min to allow a complete diffusion of liquid throughout the tissue.
Pair feedingThe pair-feeding experiments were performed as previously described.83,84 Briefly, each mouse was housed in a separate cage and pair-fed animals received the same amount of food as ingested by the corresponding groups. Mice with ICV infusion of Raptin had free access to fed HFD, and food intake was measured and averaged daily. Spillage and grind of food in cages was carefully monitored every day. The corresponding amount of food was given to the mice with ICV infusion of PBS. Food weight was recorded at a fixed time point every day to better calculate the amount of food paired fed to the mice.
EEG/EMG implantation and recordingThe mice received a prefabricated head mount containing 2 channels of electroencephalographic (EEG) and 1 channel of electromyographic (EMG) on cervical paraspinal muscles as described previously.85 The mice were allowed to recover for at least 10 days before initiation of sleep recording.
For EEG/EMG implantation, after the mice were anesthetized with isoflurane, their heads were placed horizontally and fixed on a brain stereotaxic apparatus. Mouse hair was removed, the scalp was disinfected with alcohol, and then the scalp was cut open to fully expose the skull. Then, the anterior fontanelle was used as the reference point, and the left prefrontal cortex (AP: +2.1 mm; ML: +0.5 mm) and the right parietal cortex (AP: –1.7 mm; ML: +1.0 mm) were selected as the EEG electrode implantation area. After that, the skull drill was used to drill holes in the corresponding skulls in the brain area, and the EEG electrode was slowly screwed into the skull hole. At the same time, a hole was drilled in the skull above the cerebellum position of the mouse, and the implanted electrode was used as a reference electrode and a grounding electrode. The small screw was fixed on the surface of the mouse skull with dental cement. After the dental cement was hard, the silver wire was connected to the EEG adapter. The bare metal wire at the end of the EMG signal line was inserted into the neck muscle and fixed with a surgical suture, and then the neck skin was sutured. Finally, the mice were placed on a heating pad. After the mice were fully awake, they were placed back in the cage and given sufficient water and food.
For EEG/EMG recordings, the mice recovered for one week after operation, and the wound condition of the mice was closely observed during the period. If there was exudation, iodine disinfection should be given in time. The recovered mice were placed in a soundproof, well ventilated, 12-h/12-h automatic light cycle sleep recording room with constant humidity and constant temperature. After that, the mice were connected to the recording system for 2 days, and then the sleep-wake recording began. Using sleepy Score software, the sleep/wake state is divided into NREM sleep (high amplitude, 1–4 Hz delta frequency, tense EEG and EMG signals), REM sleep (high amplitude, 6–9 Hz Theta frequency, EEG and EMG signal relaxation) or wakefulness (low amplitude, fast EEG and high amplitude, variable EMG signals). EEG/EMG traces were recorded for 48 h for HFD-fed mice, Sim1Cre;Rcn2flox/flox mice, Sim1Cre;Grm3flox/flox mice and the corresponding control mice, and data from the second day were extracted for analysis.
Isolation of sub-hypothalamic brain regionsTo label the region of PVN, the Cas9-EGFP mice were mated with PVN-specific Rcn2 or Grm3 knockout mice. Mice were anesthetized with 1% pentobarbital sodium and subjected to cardiac perfusion with ice-cold NMDG cutting solution saturated with 95% O2/5% CO2 containing 93 mM NMDG, 93 mM HCl, 2.5 mM KCl, 1.2 mM NaH2PO4, 30 mM NaHCO3, 25 mM D-glucose, 20 mM HEPES, 5 mM Na-ascorbate, 2 mM thiourea, 3 mM Na-pyruvate, 10 mM MgSO4, and 0.5 mM CaCl2, pH 7.35 with NMDG or HCl. The brain was subsequently removed into ice-cold NMDG cutting solution and sliced slowly with a vibrating microtome (VT 1200S; Leica Inc.). The brain slices (100 μm) containing PVN were recognized by EGFP fluorescence under Leica DMi8 inverted microscope and isolated using a 26 G needle on a 1 mL syringe. Isolated brain regions were immediately put into a 1.5 mL microcentrifuge tube containing RIPA protein lysate, and the tissue was sheared through frozen tissue grinder. After that, the lysate was centrifuged at 12,000 rpm for 10 min, and the supernatant was collected and stored in a –80 °C refrigerator for subsequent research.
trFRET measurements24 h after transfection of SNAP-tagged GRM3 plasmids, HEK293 cells were incubated at 37 °C for 1 h with a solution of 100 nM of SNAP-Lumi4-Tb and 60 nM of SNAP-Green in Tag-Lite buffer for labeling. After being labeled, cells were washed three times with Tag-Lite, and Raptin or glutamate was added.
The trFRET measurements were performed in Greiner black 96-well plates on a PHERAstar FS microplate reader with the following setup: after excitation with a laser at 337 nm (40 flashes per well), the fluorescence was collected at 520 nm for a 50-µs reading after a 50-µs delay after excitation (window 1) or for a 400-µs reading after a 1200-µs delay (window 2). The acceptor ratio was determined by dividing the signal measured in window 1 by the signal measured in window 2 and then was plotted on logarithmic scale. The intensity level of window 2 was above noise level by at least a factor of 5 to avoid erroneous divisions. We chose this representation because, in the range of acceptor ratio measured, the log ratio is correlated linearly with the distance between Lumi4Tb and the Green acceptor used (Förster radius of pair is 4.6 nm).
ImmunoprecipitationProtein A/G magnetic beads (HY-K0202, MCE) were incubated with anti-His antibody for 2 h at room temperature. His-Raptin was incubated with cell lysates from hypothalamic GT1-7 neurons for 2 h at room temperature. Then, we mixed the above two complexes at 4 °C overnight. After rinsing two times, immunoprecipitants were separated by SDS-PAGE, and the gel was used for MS analysis or transferred onto a PVDF membrane for further study.
Saturation binding assayDifferent doses of biotin-labeled His-Raptin were incubated with HEK293T cells, with or without GRM3 overexpression or mutant GRM3-VFT (NM_000840.3, amino acids of R30–S500) overexpression, for 30 min at room temperature. To assess nonspecific binding, 50-fold excess unconjugated His-Raptin was used. After three washes with PBS, streptavidin-HRP was added to the cells. The absorbance was measured at 450 nm, and the results were normalized to protein content.
Molecular dynamics simulation and protein–protein dockingThe AlphaFold structure of the RCN2 protein was obtained from the RCSB Protein Data Bank. Six Ca2+ ions were manually placed in the EF-hand domain of the protein using UCSF Chimera. Molecular dynamics (MD) simulations were performed on the Yinfo Cloud Computing Platform (YCCP) using the AmberTools 20 package and AMBER ff19SB force fields for protein. The system was solvated with a truncated 34 octahedron water box using the OPC water model and a 10 Å margin. Periodic boundary conditions (PBCs) were used, and the net charge was neutralized with Na+ ions. Nonbonded van der Waals interactions were calculated using Lennard-Jones 12- 6 potentials with a 10 Å cutoff, and long-range electrostatics were treated using the Particle Mesh Ewald (PME) algorithm. The SHAKE algorithm was applied to constrain hydrogen atom bonds. To remove improper atom contacts, the structure was minimized using a combination of steepest descent and conjugate gradient methods under a harmonic constraint. The system was then gradually heated to 300 K through a 20 ps NVT simulation. Two equilibrations were carried out, including a 200 ps NPT simulation with constraints on heavy atoms and a 1 ns NVT simulation without restraints. Temperature was maintained at 300 K using the Berendsen thermostat, and pressure was maintained at 1 atm using the Monte Carlo barostat. Finally, a 40 ns NVT simulation with a 2 fs time step was performed, and the last frame of the simulation was used for subsequent calculations. The crystal structure of GRM3 (PDB: 3SM9) was automatically downloaded from the RCSB Protein Data Bank (http://www.rcsb.org/). Protein–protein docking of GRM3 and Raptin was performed using the ZDOCK server. The top 10 predictions of complexes were selected for further MD simulations. All ten complexes were subjected to MD simulations following the same protocol. Initially, a 2 ns NVT simulation was conducted for each system. Afterwards, the molecular mechanics/Poisson-Boltzmann surface area (MM/PBSA) method was used to calculate the binding free energy along the trajectory. The system with the most favorable binding free energy was chosen for a 100 ns NVT simulation, and the binding free energy was recalculated based on the MD trajectory. The CPPTRAJ module was utilized for analysis of root-mean-square deviation (RMSD) and hydrogen bonds. Clustering was performed using the DBSCAN algorithm. In the simulation process of 100 ns, there are always hydrogen bonds between GRM3 and RCN2, and the number of hydrogen bonds is mainly maintained in the range of 5–8. Among them, 7 pairs of hydrogen bonds with a proportion of > 20% can be seen in the key residue hydrogen bond data.
Stomach virus injectionAs previously described,55 after anesthesia, the mouse abdomen was shaved and cleaned, followed by a midline incision. The stomach was exposed through this incision. Corresponding viruses were loaded into a Nanofil™ 36 G beveled needle (NF36BF-2, WPI) and Silflex™ tubing (SILFLEX-2, WPI), connected to a Nanofil™ 10 μL syringe, mounted on a Pump. Multiple 30 nL careful manipulation of the needles tip to avoid major blood vessels of stomach. After completing the infusions, the needle was kept in place for 5 s before extraction to ensure full absorption. Each animal received a total volume of 1 μL. Sterile suture was then applied to the skin. The mice were given time to recover from anesthesia on a heating mat before being placed back in their home cages.
The virus of AAV9-Nos1-Cre was injected into the gastric intermuscular layer of Grm3flox/flox mice to achieve specific knockout of Grm3 in the stomach. The virus of AAV-Grm3-Cre and AAV-DIO-hM3Dq was injected into the gastric intermuscular layer of mice to chemogenetically activate GRM3+ neurons in the stomach.
Acetaminophen absorption testThe gastric emptying was assessed by acetaminophen absorption. Briefly, a vehicle composed of saline, containing 1.5% (w/v) carboxymethyl cellulose (Aladdin, 9004-32-4), 1% (w/v) acetaminophen (an absorbable marker, MedChimExpress, 103-90-2) and 2% ethanol, was used to assess the gastric emptying rate. Mice were fasted and given configured suspension via oral gavage. Tail vein blood samples were collected before (0 min) and 30 min, 60 min, and 120 min after administration. Blood samples were immediately mixed with heparin and placed on ice. Plasma was separated by centrifugation at 3000 rpm for 10 min at 4 °C, and then stored at −80 °C until analysis. Plasma acetaminophen concentrations were measured using an acetaminophen detection kit (Glenbio Ltd).
Phenol red testThe suspensions contained phenol red (5 mg/kg body weight, Sigma Aldrich, P0290), as a non-absorbable marker, to assess the gastric emptying rate. In brief, after the mice were fasted overnight, the solution containing phenol red was intragastrically administered to the mice. After 15 min, the mice were sacrificed and quickly dissected. The cardia and pylorus were clamped with a vascular clamp and the stomach was quickly removed. The stomach content was flushed twice with cold saline, and the washout solution was then collected. The debris was removed by centrifugation at 8400× g for 10 min at 4 °C. After adding 1 N NaOH to the supernatant (1/10 volume of the supernatant), the concentration of phenol red was spectrophotometrically measured at 560 nm. The gastric emptying rate was calculated as follows: Gastric emptying rate (%) = ((the amount of phenol red administered (mg) – the amount of phenol red remaining in the stomach (mg))/the amount of phenol red administered (mg)) × 100%
PhosphoproteomicsGlobal quantitative phosphoproteomic analysis was performed on hypothalamic GT1-7 neurons treated with Raptin or PBS. The phosphopeptides were enriched using a published protocol. Briefly, peptides were digested with a solution containing 800 mL of acetonitrile (ACN), 150 mL of 3.2 M KCl, 55 mL of 150 mM KH2PO4, and 95 mL of trifluoroacetic acid. TiO2 beads were then added to peptides, pelleted, and washed. The beads were suspended in 100 mL of a transfer buffer (80% ACN and 0.5% acetic acid) and transferred onto the top of a C18 StageTip (Thermo Fisher Scientific). The bound phosphopeptides were eluted twice with 30 mL of an elution buffer (40% ACN and 15% NH4OH; high-performance liquid chromatography grade). Subsequently, samples of the phosphopeptides were concentrated in a SpeedVac for 15 min. The eluted phosphopeptides were desalted for subsequent LC-MS/MS analysis.
Plasmid and siRNA transfectionGrm3 siRNA sequence is: CCATGTGAGCCCTATGAAT; Khc siRNA/shRNA sequence is: GGAUGAGAUUAAUGAGAAATT. For transfection of siRNA or plasmids, cells were inoculated into 12-well plates and transfected using Lipofectamine 3000 (Thermo Fisher Scientific) according to the manual. Western blot was performed to detect transfection efficiency or for functional validation.
Live-cell imaging and analysisFor live-cell imaging, neurons were imaged in special petri dish (801001, NEST) pre-equilibrated with Hibernate A low fluoresce
留言 (0)