Melanin-concentrating hormone (MCH) is a 17-amino acid peptide that is expressed in the hypothalamus of the mammalian brain (Bittencourt, 2011). MCH-expressing neurons are distributed extensively within the hypothalamus, with particularly high density in the lateral hypothalamus (LH), the medial hypothalamus (MH), as well as the adjacent zona incerta (ZI). MCH neurons also project widely throughout the brain in a pattern consistent with the MCH1 receptor expression (Bittencourt et al., 1992; Chee et al., 2013), and these broad projections are thought to imbue MCH neurons with the ability to regulate many physiological functions including energy and glucose homeostasis, sleep, motivated behavior, memory, and mood (Qu et al., 1996; Borowsky et al., 2002; Alon and Friedman, 2006; Adamantidis et al., 2008; Kong et al., 2010; Izawa et al., 2022; Subramanian et al., 2023).
To underscore the wide range of physiological functions in which MCH neurons are involved, recent research has identified subpopulations of MCH neurons with distinct anatomical and/or neurochemical properties. A topographical organization of MCH neurons based on specific co-expressed neurochemicals (Fujita et al., 2021; Miller et al., 2024) or projection targets has been described (Chometton et al., 2014; Haemmerle et al., 2015). For example, MCH neurons that co-express cocaine and amphetamine-regulated transcript (MCH/CART+) are found predominantly in the MH and ZI, while MCH/CART− neurons are concentrated in the LH (Fujita et al., 2021; Wang et al., 2021; Miller et al., 2024). MCH/CART− neurons preferentially project toward the spinal cord, while MCH/CART+ neurons mainly send ascending inputs to innervate the cerebral cortex and medial septal complex, although some species differences have been reported (Cvetkovic et al., 2004; Croizier et al., 2010). In addition, the pattern of axonal inputs to the hypothalamus and ZI are also known to be specific to the source of projections (Fujita et al., 2021; Wang et al., 2021). Thus, MCH neurons found in different nuclei such as the LH, MH and ZI may constitute separate functional groups with distinct connectivity.
Previous studies have characterized the electrophysiological properties of MCH subpopulations subdivided by their neurochemical phenotype. These studies found differences in active and passive properties such as input resistance, action potential waveform, spike adaptation and excitatory synaptic properties between MCH neurons with or without CART expression (Fujita et al., 2021; Miller et al., 2024). Furthermore, some of these properties differ in a sex-dependent manner (Miller et al., 2024). Here, in an effort to harmonize the findings in the field, we characterized the electrophysiological properties of anatomical and neurochemical subpopulations of MCH neurons using whole-cell patch clamp. Our results add to the current understanding of the electrophysiological properties that define subpopulations of MCH neurons. These differences may be important in shaping specific patterns of activity necessary to produce certain functional outcomes.
Materials and methods AnimalsAll animal experiments followed the guidelines of the Canadian Council on Animal Care and were approved by Memorial University Institutional Animal Care Committee (Protocol number 18-02-MH). C57BL/6NCrl mice were obtained from Charles River Laboratory (Quebec, Canada), while MCH-tdTomato mice were bred at Memorial University and used to visualize MCH-expressing neurons. MCH-tdTomato mice were generated by crossing a Mch-cre mouse (originally generated by Dr. Brad Lowell, Harvard University and breeders were kindly provided by Dr. Melissa Chee, Carleton University) with a cre-dependent tdTomato reporter mouse (stock number 007909, Jackson Laboratory). All mice used were 6–12 weeks old at the time of experimentation. Animals were kept on a 12/12 h light/dark cycle and fed ad libitum with standard chow.
ElectrophysiologyMice were deeply anesthetized with isoflurane and decapitated, and the brain was isolated. Coronal slices (250 μm) of the hypothalamus were obtained with the vibratome (VT-1000, Leica Microsystems) in cold artificial cerebrospinal fluid (ACSF) containing (mM): 126 NaCl, 2.5 KCl, 2 CaCl2, 1.2 NaH2PO4, 1.2 MgCl2, 18 NaHCO3, 2.5 glucose, and bubbled with 95% O2/5% CO2. Slices were then incubated at 32°C in ACSF for 30 min or in recovery solution (in mM: 92 NMDG, 2.5 KCl, 1.25 NaH2PO4, 30 NaHCO3, 20 HEPES, 25 glucose, 5 ascorbic acid, 2 thiourea, 3 sodium pyruvate, 10 MgSO4, and 0.5 CaCl2) for 15 min before being transferred into ACSF for another 15 min. Then, slices were left in ACSF at room temperature until recording. Solutions were continuously bubbled with 95% O2/5% CO2. No differences in electrophysiological parameters were found in identified MCH neurons due to the recovery solution (data not shown), thus data were combined.
Hemisected brain slices were placed in the recording chamber and perfused continuously with ACSF at 27–30°C. An infrared differential interference contrast microscope (DM LFSA, Leica Microsystems) was used to visualize neurons. Whole cell patch clamping was performed using Multiclamp 700B and pClamp 10 software (Molecular Devices). An internal solution composed of (in mM): 123 K-gluconate, 2 MgCl2, 1 KCl, 0.2 EGTA, 10 HEPES, 5 Na2ATP, 0.3 NaGTP, and 2.7 biocytin was used to fill glass electrodes with a tip resistance of 3–6 MΩ. Once whole cell mode was attained, a series of hyperpolarizing and depolarizing current (600 ms) in 50-pA or 20-pA increments was applied in current clamp mode, and resulting voltage responses were filtered at 5 kHz and acquired at 10 kHz. To test the effect of tetrodotoxin (1 μM, Alomone Labs) or ZD 7288 (50 μM, Hello Bio), aliquots of the compounds were diluted to the final concentration in ACSF and applied in the bath.
ImmunohistochemistryFollowing recording, immunohistochemistry was performed to confirm the neurochemical phenotype. First, brain slices were fixed in 10% neutral-buffered formalin overnight at 4°C following electrophysiology. Next, fixed slices were incubated in rabbit anti-MCH antibody (1:1000, H-070-47, Phoenix Pharmaceuticals Inc.) for 3 days at 4°C. Slices were then treated overnight with an appropriate secondary antibody and AMCA-streptavidin to visualize biocytin (1:500; 016–150-084, Jackson ImmunoResearch). For MCH-tdTomato mice, MCH peptide staining was not performed. To identify co-localization of CART in MCH neurons, brain slices were treated with a cocktail of goat anti-MCH antibody (1:500; sc14509, Santa Cruz Biotechnology Inc.) and rabbit anti-CART antibody (1:500; H-003-62, Phoenix Pharmaceuticals Inc.), followed by appropriate secondary antibodies and AMCA-streptavidin. Stained sections were imaged using a confocal or epifluorescence microscope to identify the co-localization of biocytin with MCH or tdTomato and CART. Only cells that were confirmed to be MCH neurons (i.e., MCH-immunoreactive or tdTomato-positive) were included in the analysis.
Data analysisMembrane capacitance (Cm) and resistance (Rm) were measured in voltage clamp mode by applying 5-mV step pulses at a holding potential of −70 mV using the membrane test function of pClamp. Membrane time constant (τ) was calculated as τ = Cm × Rm. Unique electrophysiological responses to hyperpolarizing and depolarizing current injections were used to identify putative MCH neurons (Parsons and Hirasawa, 2011; Linehan et al., 2015) and to assess active and passive membrane properties using Clampfit 10 (Molecular devices) as previously described (Linehan and Hirasawa, 2018). Briefly, the number of action potentials (APs) and the latency to first spike were assessed during 600-ms positive current injections. AP waveform was analyzed using the following definitions: AP threshold was the membrane potential where the slope of the trace reached 10 mV/ms; AP amplitude was the membrane potential from the baseline to the peak, where baseline was defined as the membrane potential 30 ms before the threshold; half-width was the time between the rise and decay phase of AP at half amplitude; and after hyperpolarization (AHP) amplitude was the difference between baseline and the peak of AHP. If no AP was elicited, the duration of the current injection (600 ms) was assigned as the latency and AP waveform analysis was not performed. In case an AP was fired immediately after the start of positive current injection, the second AP was analyzed; otherwise, the first AP was used for AP waveform analysis. Voltage sag/H-current amplitude was the difference between the peak of membrane hyperpolarization and the steady-state membrane potential at the end of hyperpolarizing current injections. H-current density was calculated by dividing H-current amplitude by Cm. All recorded membrane potentials were corrected for liquid junction potential (−14.9 mV according to pClamp LJP calculator). Cells with series/access resistance greater than 25 MΩ were excluded from analysis.
Statistical tests were performed using Prism 9 (GraphPad Software Inc), p < 0.05 was considered significant. Two-way ANOVA (ordinary or repeated measures) was performed to compare multiple groups in both sexes and when significant main effect or interaction was found, Tukey’s multiple comparison test was performed. One-way ANOVA was used when male and female cells were pooled. Simple linear regression analysis was performed to assess for any correlation between two factors. Kruskal–Wallis test was used for assessing H-currents in different cell subgroups. The sample size and main effects are indicated in Table 1 and figure legend, while the post-test results are shown in the figures. Results are presented as mean ± SEM. Quantile–quantile (Q–Q) plots of indicated variables were generated in Prism 9 and are shown in Supplementary Figure S1.

Table 1. Sample size and statistical test information. p-values that reached significance (i.e. p<0.05) are bolded.
ResultsMelanin-concentrating hormone neurons, visualized by immunohistochemistry or tdTomato expression, were distributed in loose clusters in three anatomical areas (Figure 1A), namely the ZI, LH (ventral to the ZI and lateral to the fornix), and the MH (medial to the fornix). We performed patch clamp recordings of MCH neurons (Figure 1B) and classified them into subgroups according to their localization in these three anatomical areas for comparison of their electrophysiological properties (Figure 2A).
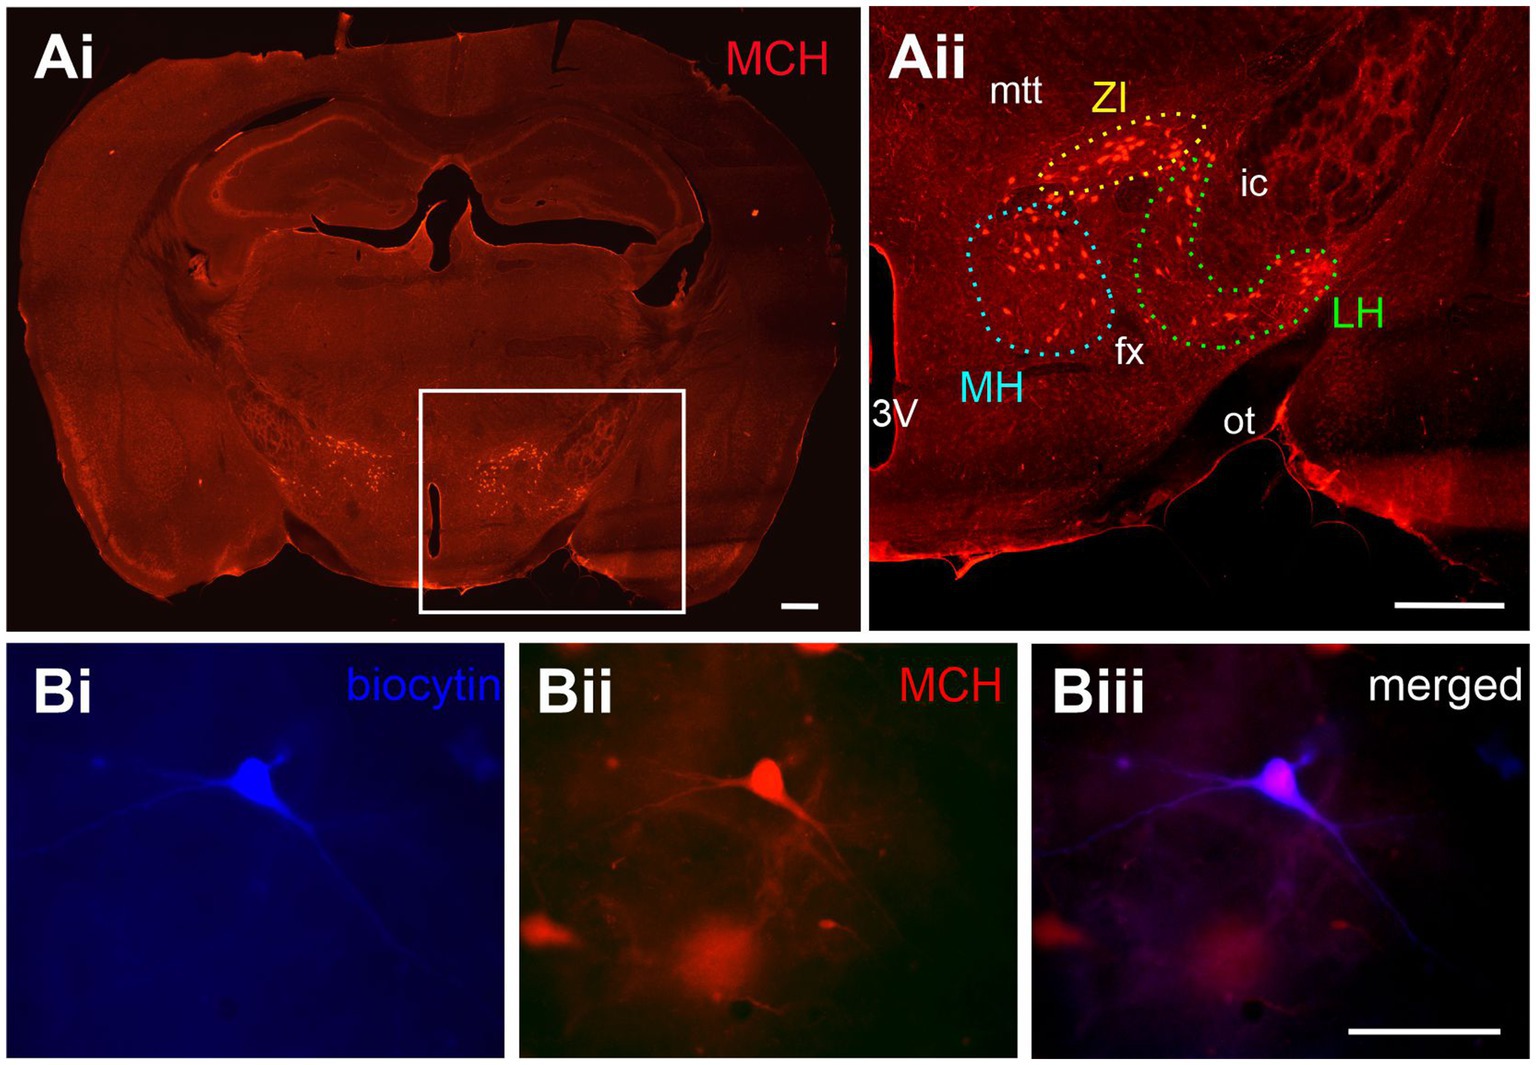
Figure 1. Anatomical distribution of MCH neurons. (A) MCH immunoreactivity in the mouse brain. An area with a high density of MCH neurons in the whole coronal brain image (Ai, white box) is shown at a higher magnification (Aii). Anatomical subpopulations of MCH neurons were identified within the medial hypothalamus (MH), lateral hypothalamus (LH) and zona incerta (ZI) according to their position relative to the third ventricle (3V), fornix (fx), optic tract (ot), mammillothalamic tract (mtt) and internal capsule (ic). (B) Representative image of a neuron filled with biocytin during patch clamp recording (Bi) and later confirmed to co-localize with the MCH peptide (Bii,Biii). Scale bar: (Ai,Aii) 500 μm. (Bi-Biii) 100 μm.
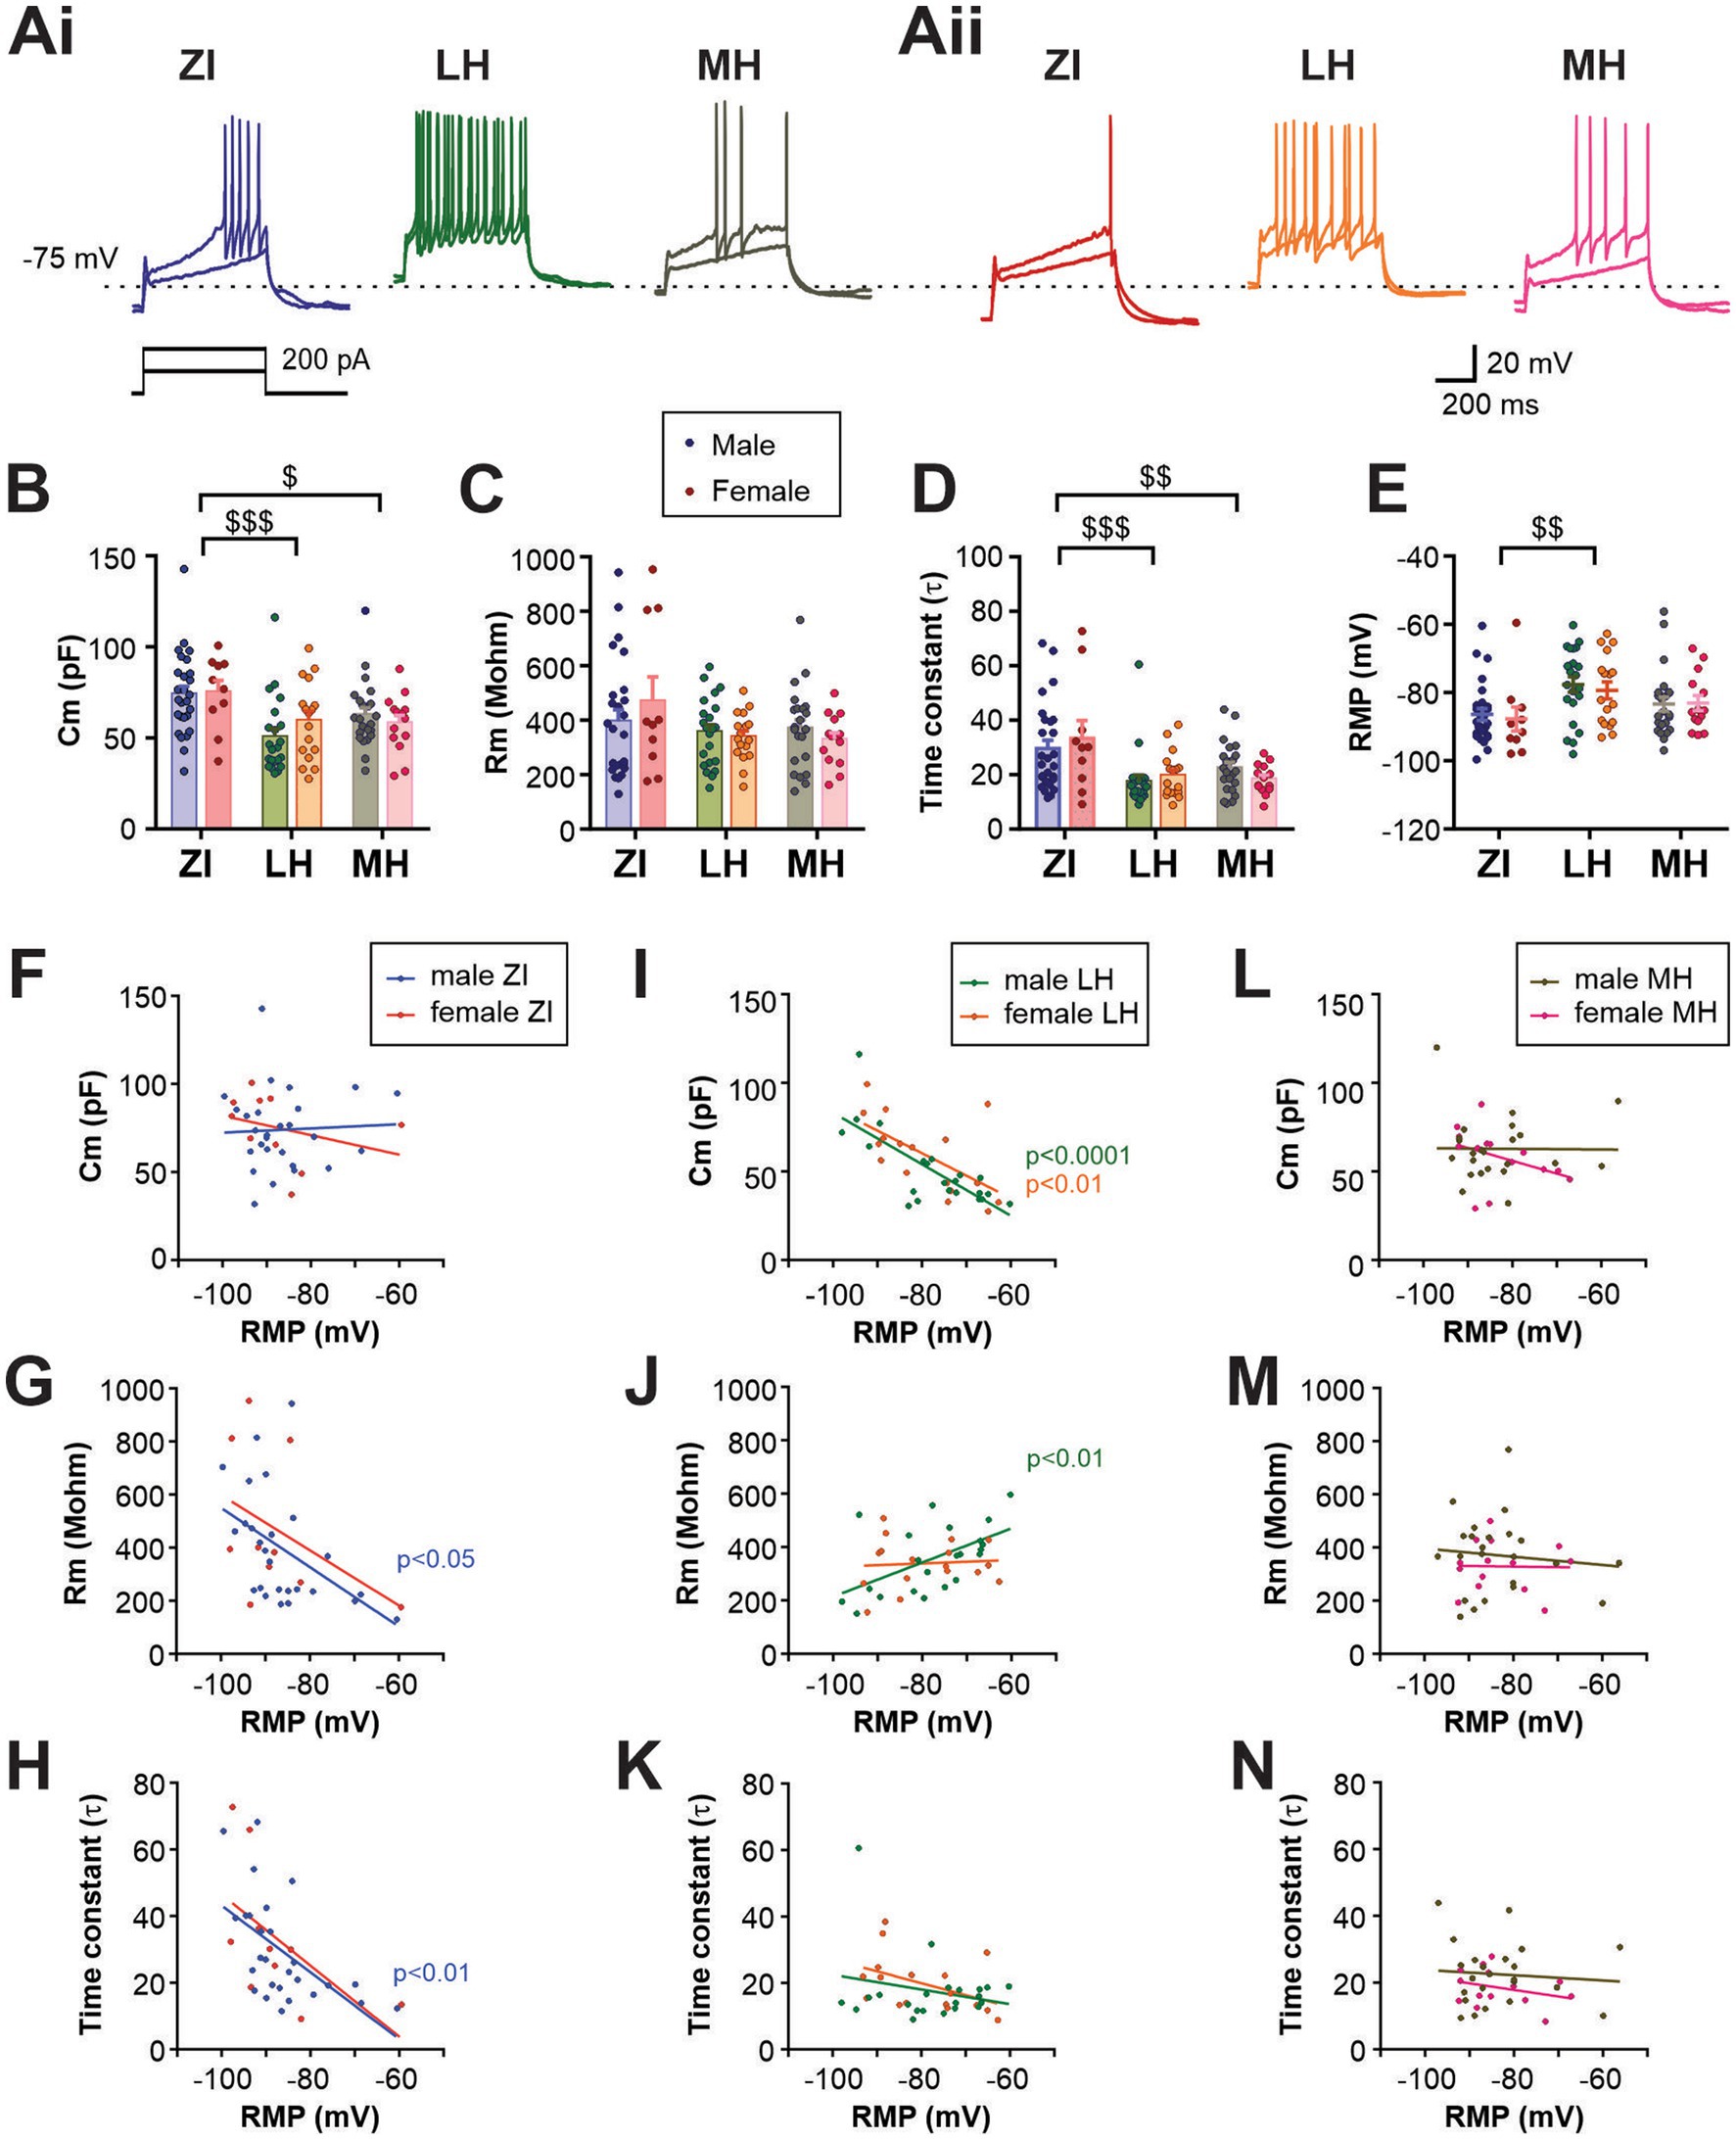
Figure 2. Electrophysiological characteristics of anatomical subpopulations of MCH neurons in male and female mice. (Ai,Aii) Representative ex-vivo current clamp recording of MCH neurons from male (Ai) and female mice (Aii) in three anatomical regions as indicated. Traces show the response to 100- and 200-pA driving currents for 600 ms. (B–D) Membrane capacitance (Cm, B), resistance (Rm, C) and time constant (τ, D) of MCH subpopulations measured at −70 mV in voltage clamp mode. (E) Resting membrane potential (RMP) of MCH neurons in different anatomical regions. (F–N) Correlation analysis between RMP and other passive membrane properties of MCH neurons. Male and female MCH neurons are grouped according to their anatomical localization in the ZI (F,G), LH (I–K), and (L–N). Data shown in panels B–E are used for the regression analysis. $p < 0.05, $$p < 0.01, $$$p < 0.001 multiple comparisons between areas. Mean ± SEM are shown.
Among the passive membrane properties examined, no effect of sex was observed (main effect and interaction), while area differences were found in membrane capacitance (Cm) and time constant (τ) but not in membrane resistance (Rm) (Figures 2B–D). ZI cells had a greater Cm, which corresponded with a larger soma area of biocytin-filled cells in the ZI (Supplementary Figure S2), suggesting that the difference in soma size accounts for the larger Cm. Area-dependent differences were also seen in the resting membrane potential (RMP, Figure 2E). The application of a voltage-gated Na+ channel blocker tetrodotoxin did not alter RMP, thus this area difference is due to intrinsic properties (Supplementary Figure S3). As the RMP values were highly variable within each group, regression analysis between RMP and other passive membrane properties was performed (Figures 2F–N). We found that in male ZI cells, RMP was negatively correlated with Rm or time constant (Figures 2G,H), suggesting that hyperpolarized ZI cells may have greater membrane permeability at rest. RMP of LH cells was negatively correlated with Cm in both males and females (Figure 2I), whereas RMP and Rm were positively correlated in male LH cells (Figure 2J). Thus, depolarized cells in the LH may be smaller and have higher membrane resistance. No significant correlation between RMP and other measures were found in the MH.
When stimulated by positive driving current injections, the latency and frequency of elicited AP were also found to be different among the areas (Figures 3A,B and Supplementary Figure S4). Specifically, ZI MCH neurons were the least excitable with hyperpolarized RMP and less evoked firing, while LH MCH neurons were the most excitable, particularly those of male mice. The AP waveform was analyzed for cells that fired APs during positive driving currents, which revealed that AP threshold, AP amplitude and AHP amplitude were similar among spatially-defined groups and between sexes (Figures 3C–E). The AP half-width, however, was shorter in LH cells without differences between the sexes (Figure 3F).
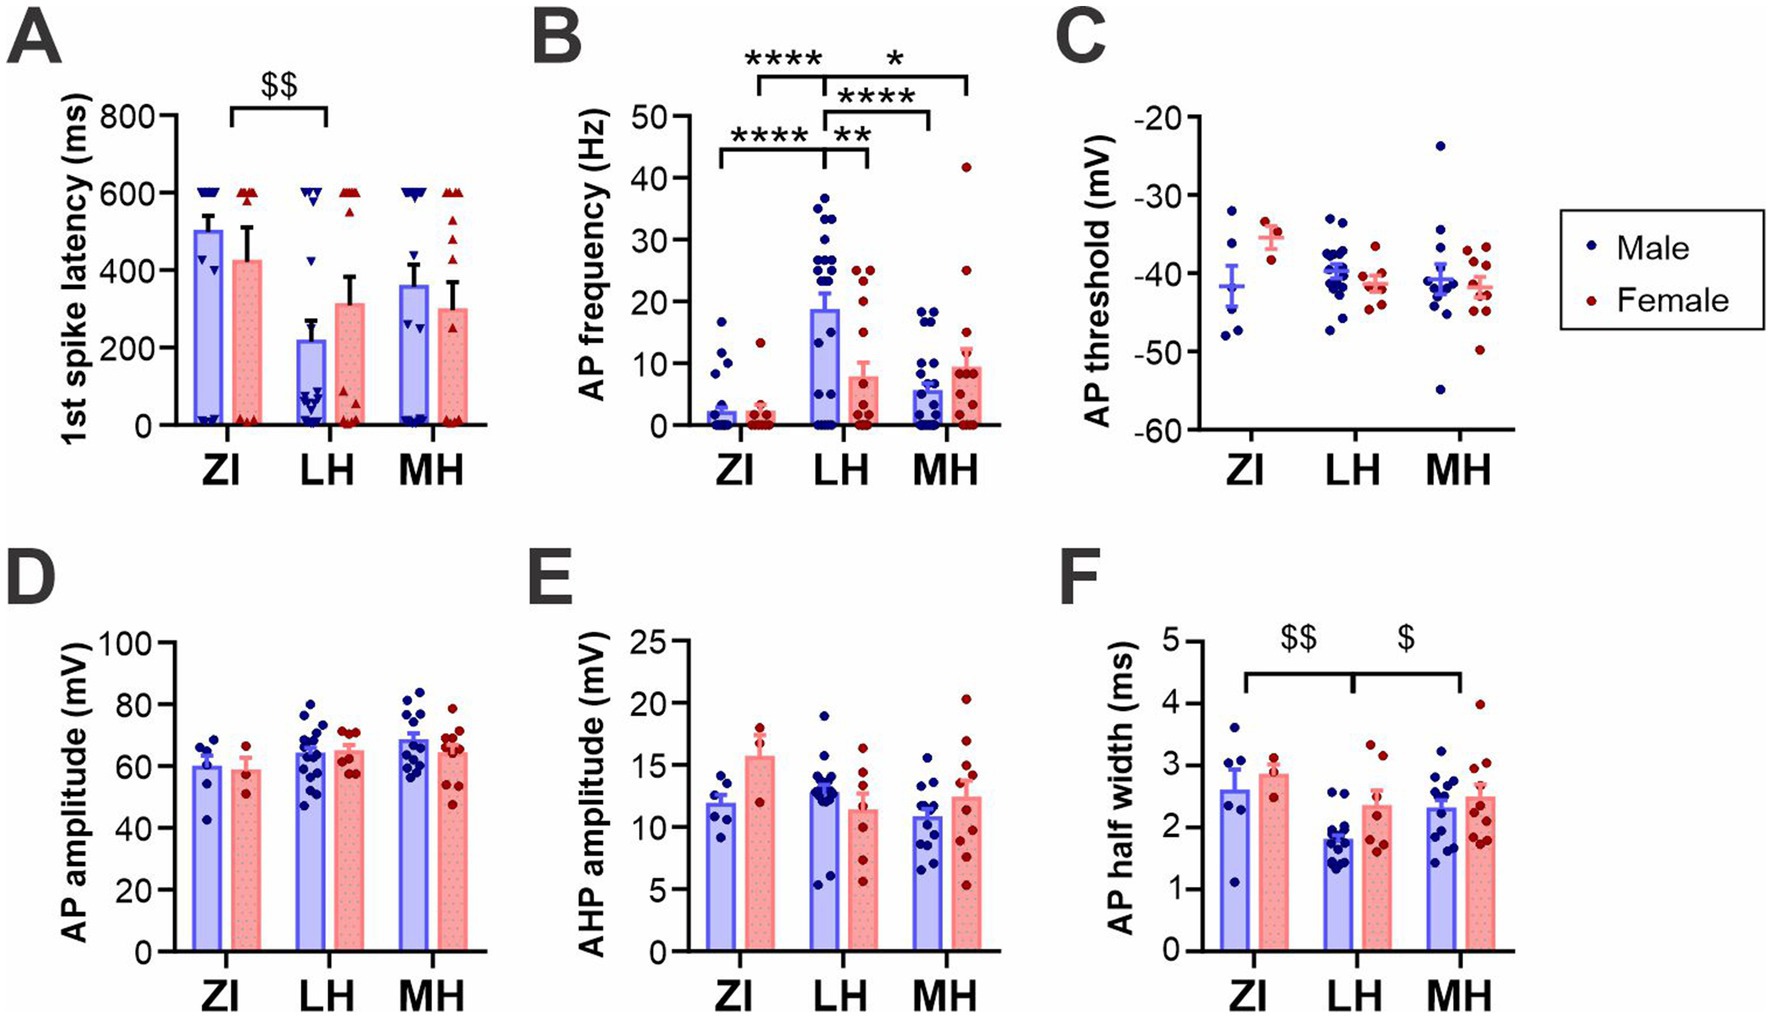
Figure 3. Active membrane properties of anatomical subpopulations of MCH neurons. (A,B) Latency to the first action potential (AP) (F) and AP frequency (G) during 600-ms, 200 pA driving current injections. When no AP was elicited, the latency was noted as 600 ms. (C,D) AP waveform analysis of MCH subpopulations showing the AP threshold (H) and amplitude (I). (E) Amplitude of afterhyperpolarization (AHP). (F) Half-width of APs. *p < 0.05, **p < 0.01, ****p < 0.0001 multiple comparisons between individual groups. $p < 0.05, $$p < 0.01 multiple comparisons between areas. Mean ± SEM are shown.
We noted that approximately half of MCH neurons recorded remained silent when challenged with positive current injections, even during the maximum driving current used in this study (+200 pA). Thus, to further assess the electrophysiological properties of MCH neurons, a subset of these neurons was held at a subthreshold potential (−65 mV) and then positive driving currents were applied (Figure 4). As no difference in RMP was found between male and females in the three anatomical regions, cells from both sexes were combined for this assessment. We found that MCH neurons within different brain areas had distinct levels of excitability, as measured by AP frequency (Figure 4B) and the first spike latency (Figure 4C). Specifically, ZI-MCH neurons were less excitable than those in other areas despite being held at the same baseline holding potential. An AP waveform analysis of these recordings revealed area-dependent differences in AP threshold, half-width and AHP amplitude, but not AP amplitude (Figures 4D–G).
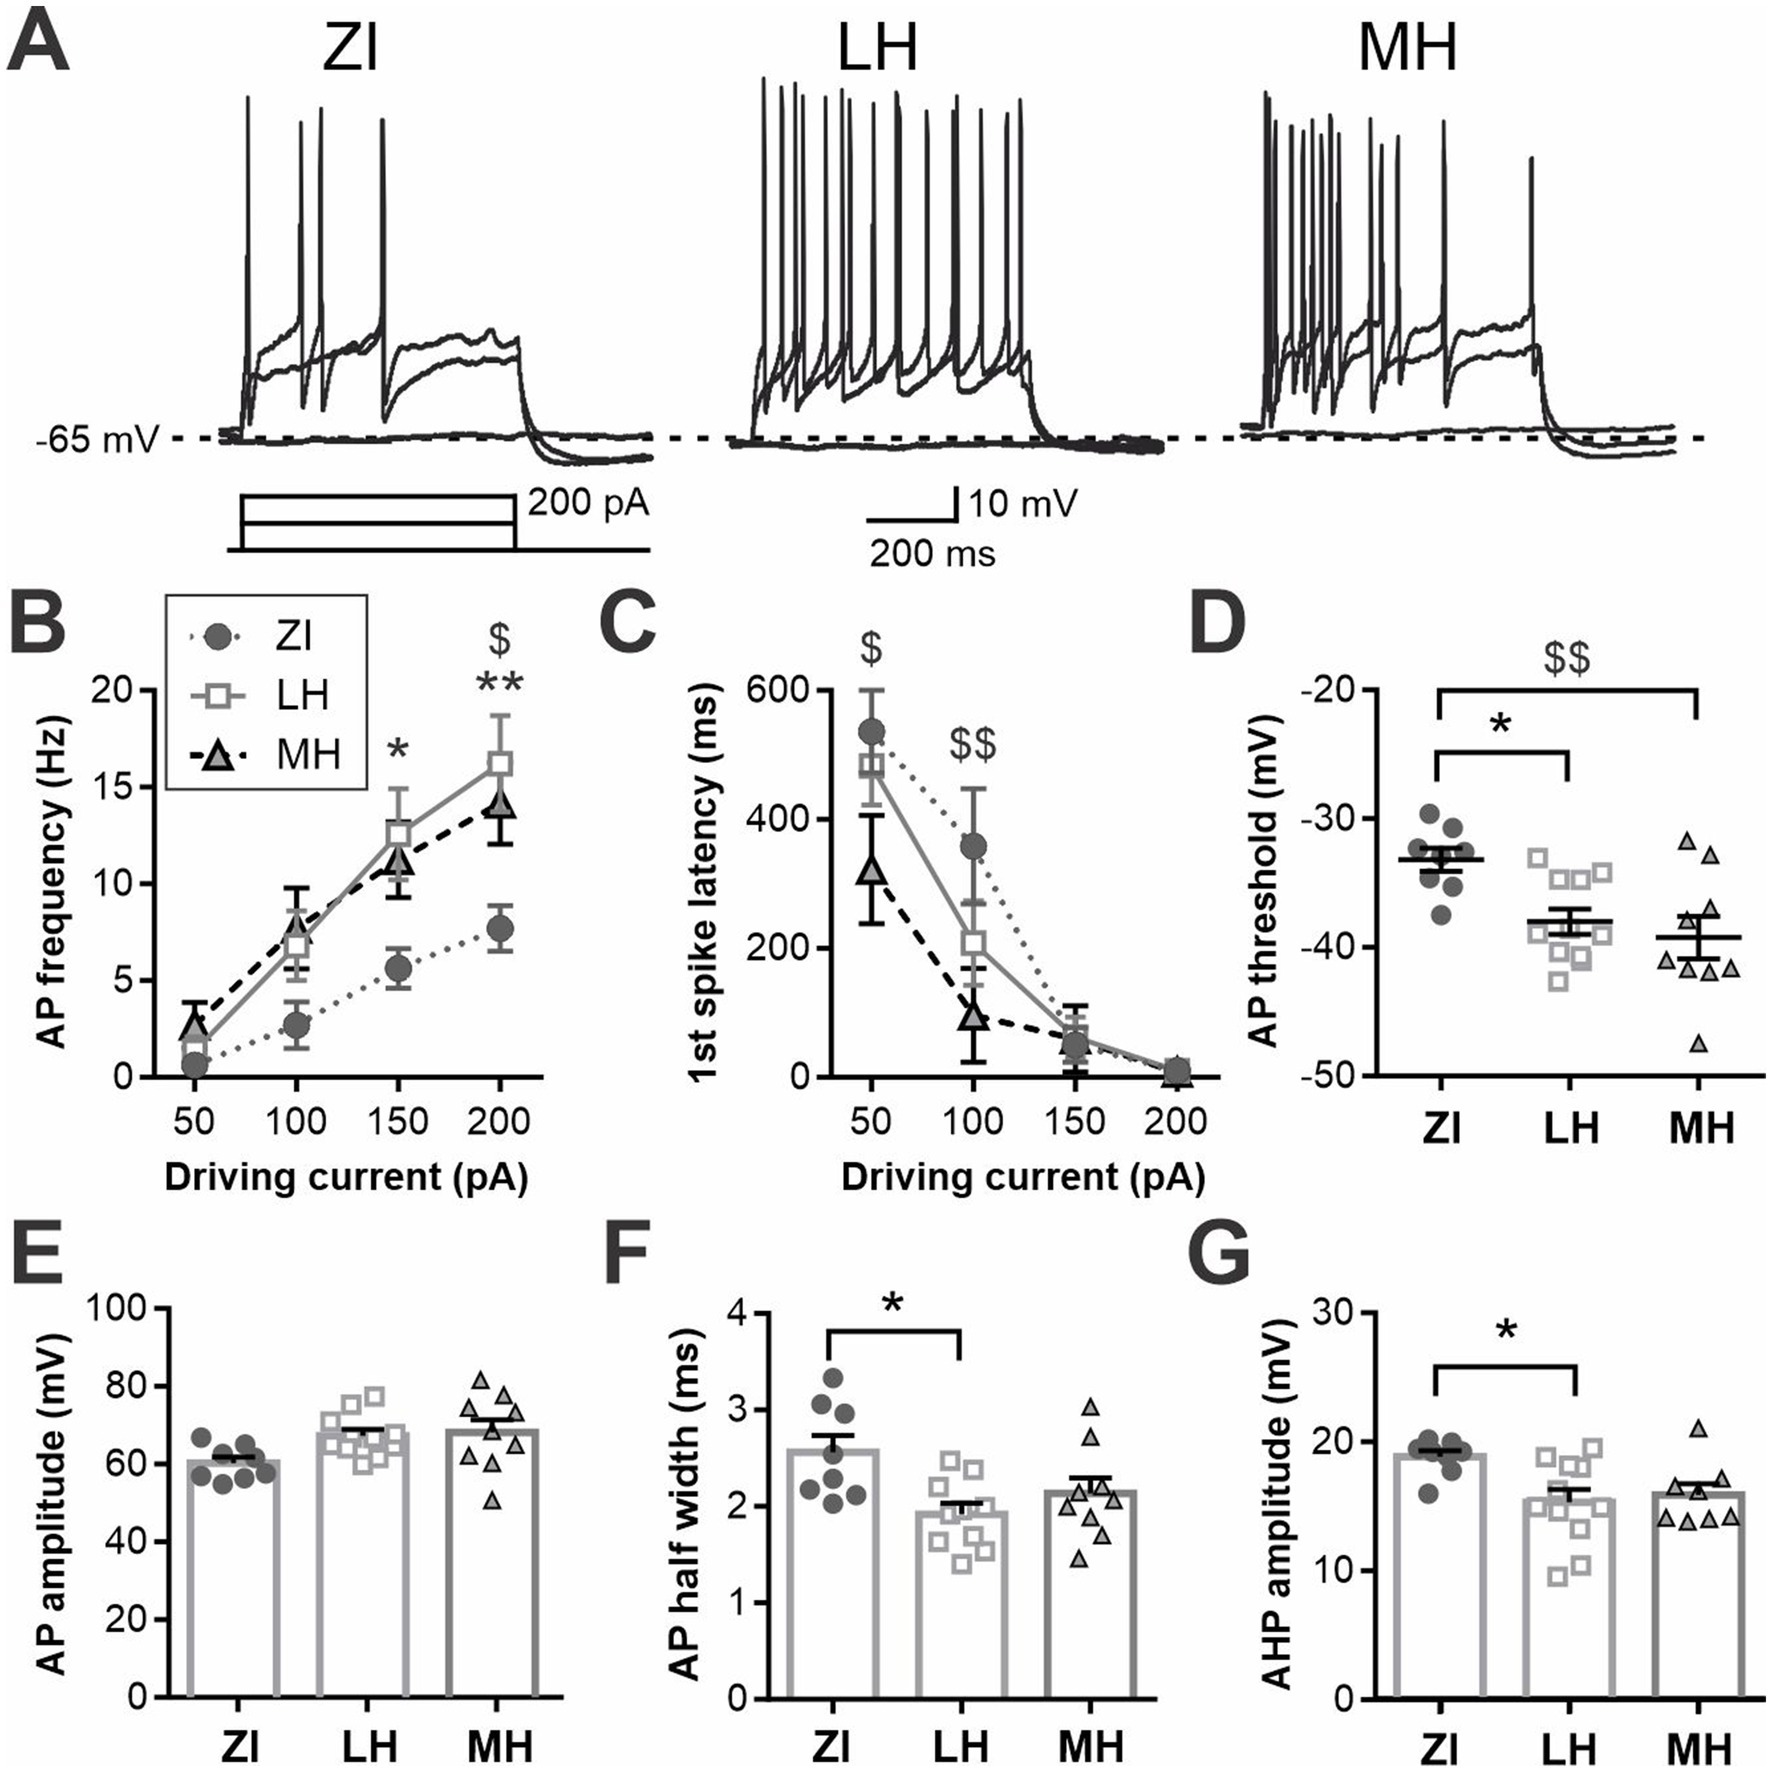
Figure 4. Differential excitability of anatomical subpopulations of MCH neurons is not solely due to the difference in RMP. (A) Representative recording of MCH neurons at a subthreshold potential (−65 mV) and challenged with driving currents. (B,C) AP frequency (B) and latency to 1st spike (C) during driving current injections. (D–G) AP waveform measures showing threshold (D), amplitude (E), half-width (F) of APs and AHP amplitude (G). *p < 0.05, **p < 0.01 LH vs. ZI; $p < 0.05, $$p < 0.01 ZI vs. MH. Mean ± SEM are shown.
Another way to classify MCH neurons is by the co-expression of CART. CART expression was found in regions with a high concentration of MCH neurons (Figure 5A). Most CART immunopositive (CART+) MCH neurons were found localized to the ZI and MH, while double staining was far less common in the LH. Consequently, we were only able to conduct electrophysiological assessment on MCH/CART− cells within the LH, which were then compared to MCH/CART+ cells in all three regions (Figures 5B,C, 6A).
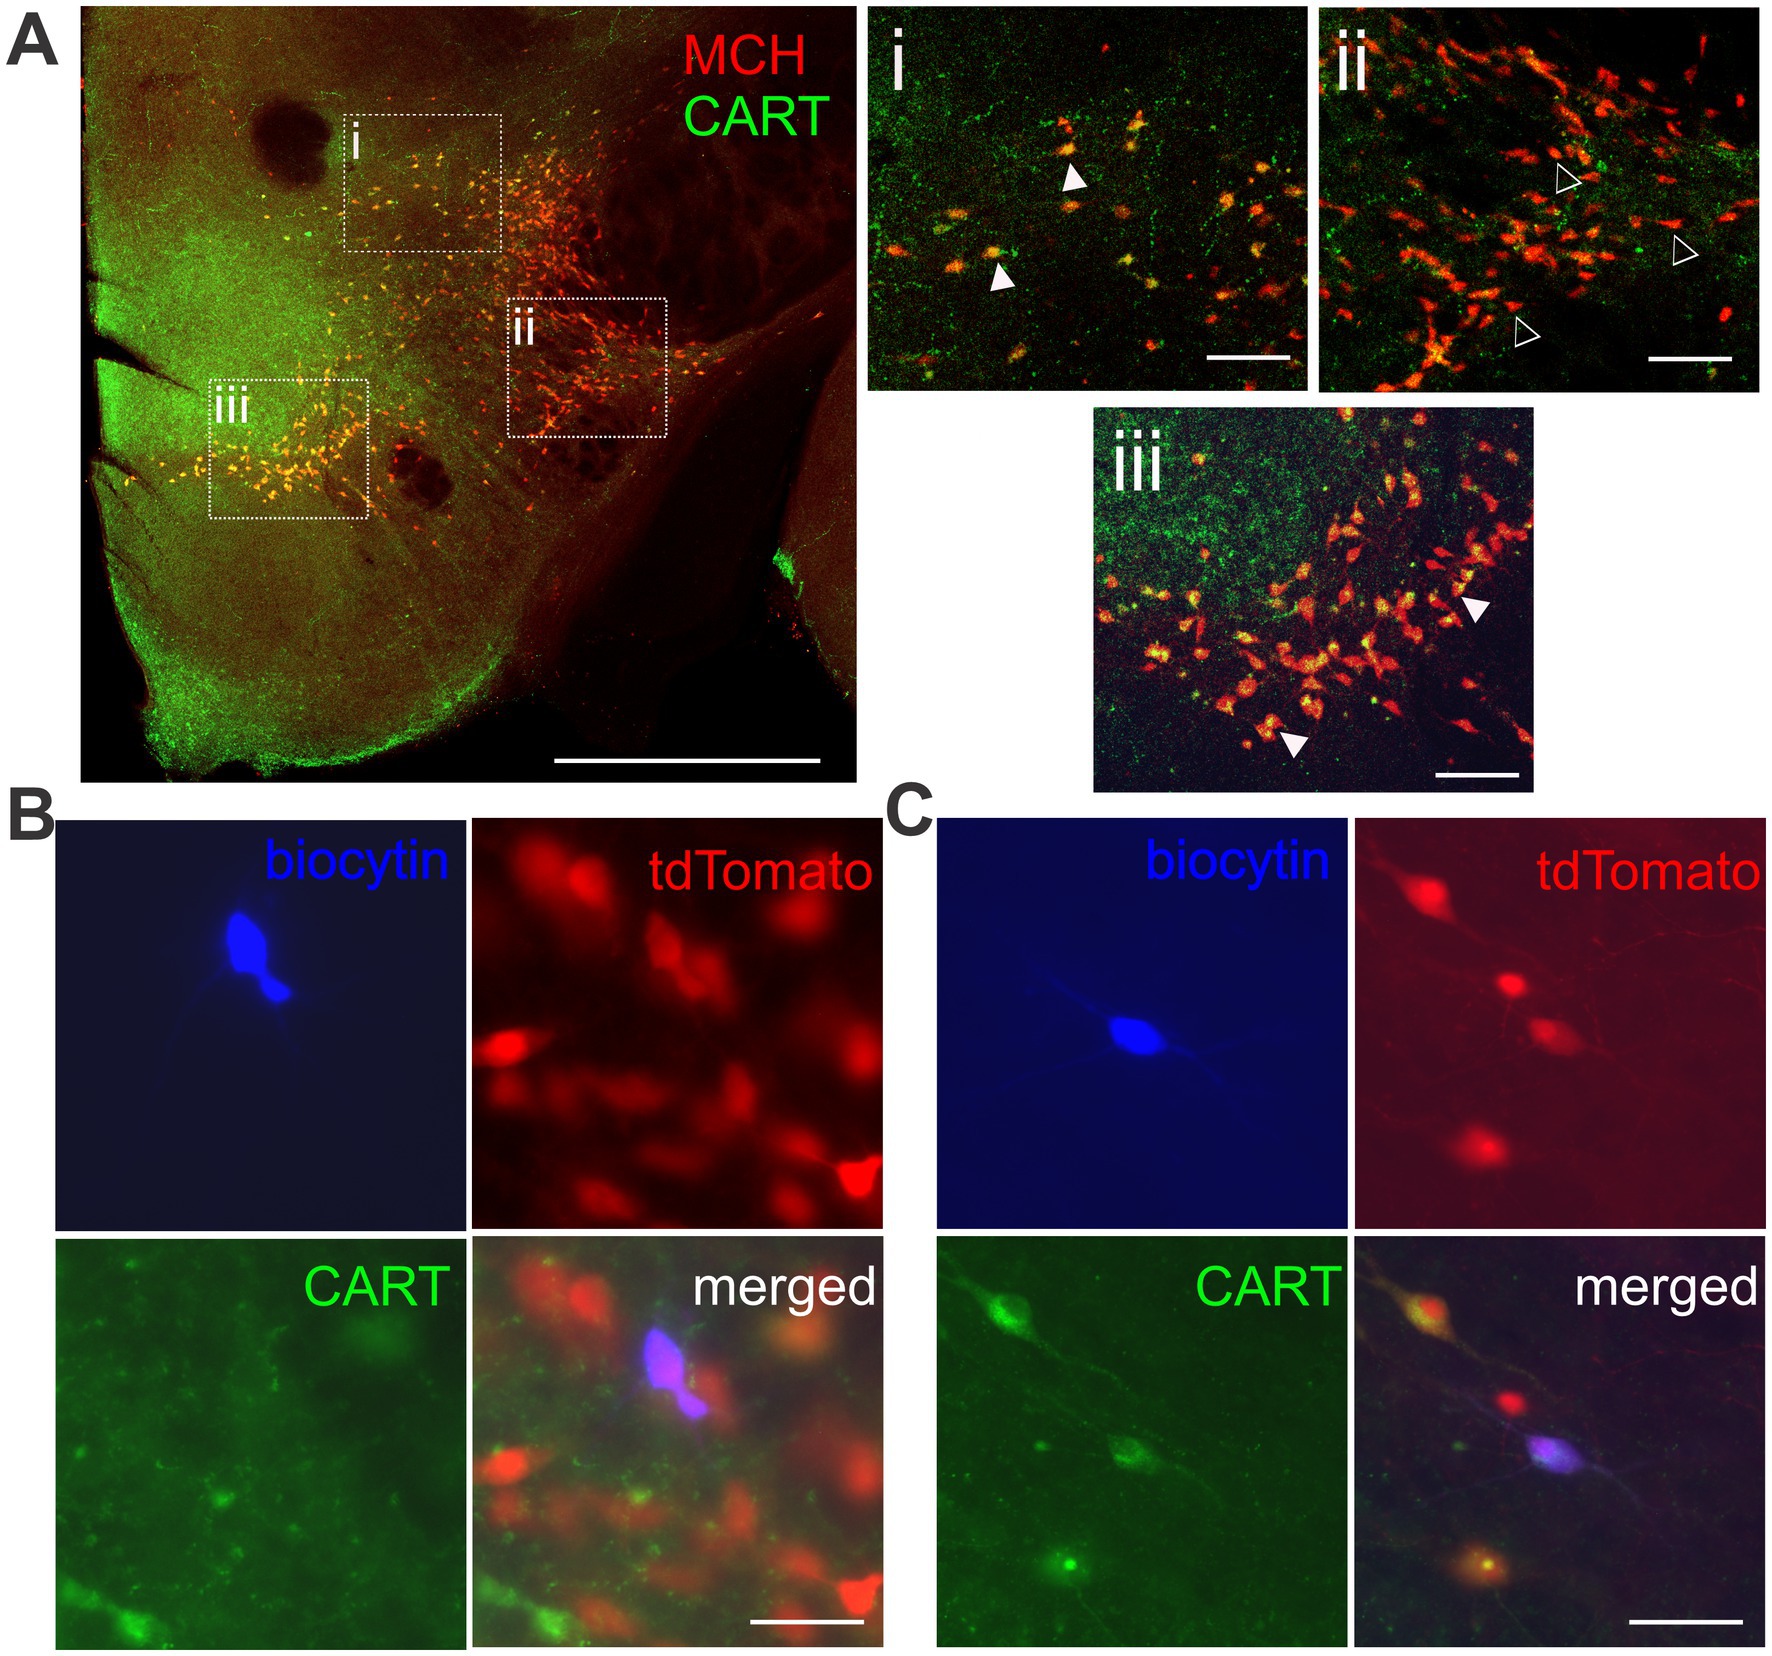
Figure 5. Immunohistochemical detection of CART co-expression in MCH neurons. (A) Double immunofluorescence of MCH and CART. Boxed areas in the left image show the ZI (i), the LH (ii), and the MH (iii), enlarged in the insets (right). MCH neurons with co-localization of CART (filled arrowheads) are more common in the ZI and MH. MCH/CART− neurons (open arrowheads) are more frequently found in the LH. Scale bar: (Left) 1 mm, (Right, insets) 100 μm. (B,C) Representative images of tdTomato-expressing MCH neurons filled with biocytin during patch clamp recording, classified as CART-negative (B) or CART-positive (C). Scale bar: 50 μm.
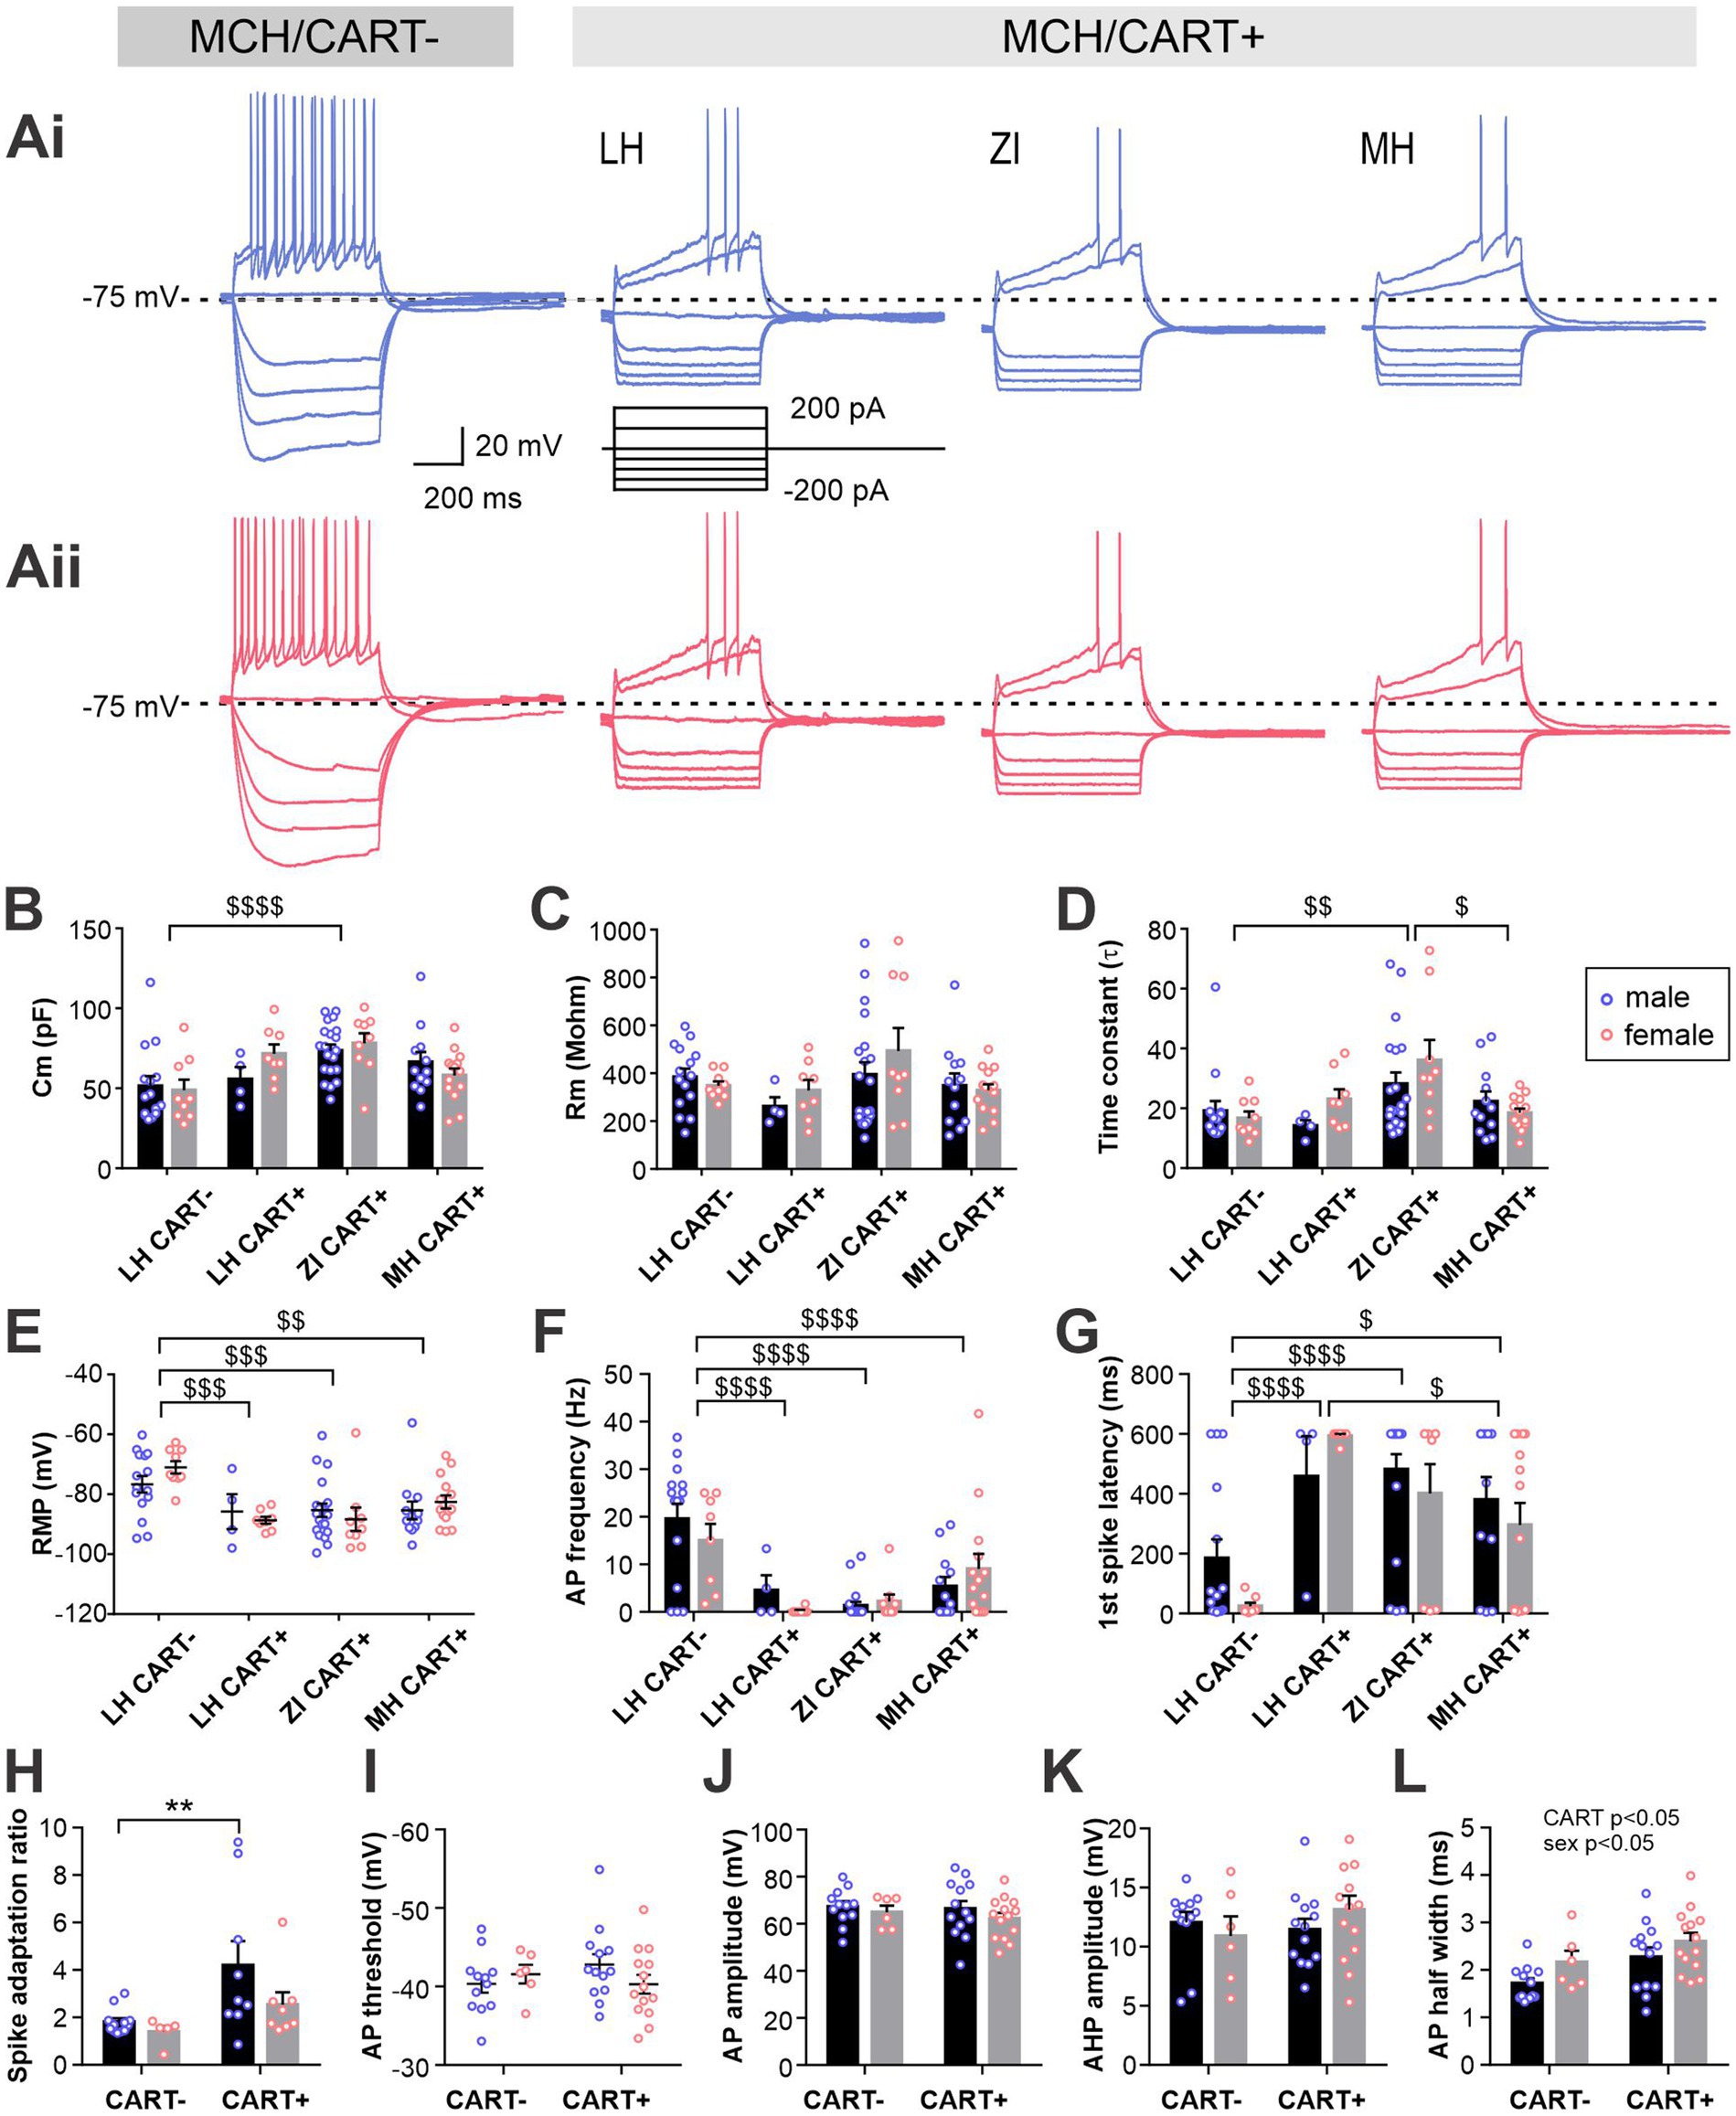
Figure 6. Electrophysiological characteristics of MCH neurons with or without CART expression. (Ai,Aii) Representative current clamp recording of CART-negative and -positive MCH neurons in different brain regions in male (Ai) and female mice (Aii). (B–E) MCH neurons are grouped according to the CART expression and anatomical localization: MCH/CART− cells in LH (LH CART−) and MCH/CART+ cells in LH, ZI and MH. Graphs show passive membrane properties including Cm (B), Rm (C), time constant (D) and RMP (E). (F,G) AP frequency (F) and latency to first AP (G) during 600-ms, 200-pA current injections. (H) Spike adaptation (ratio of first and last AP intervals). (I–L) Comparisons of AP waveform characteristics between male and female MCH neurons with or without CART expression, including AP threshold (I), AP amplitude (J), AHP amplitude (K) and half-width (L). MCH/CART+ cells in all three anatomical areas are combined. $p < 0.05, $$p < 0.01, $$$p < 0.001, $$$$p < 0.0001, multiple comparisons between areas. **p < 0.01, multiple comparison between individual groups. Mean ± SEM are shown.
This comparison of MCH neuron subgroups revealed a significant difference in Cm and time constant without any difference in Rm (Figures 6B–D), corroborating our initial finding that ZI CART+ cells were larger (i.e., larger membrane area). There was a striking difference in RMP, where LH CART− cells had a more depolarized RMP than CART+ cells in all three regions (Figure 6E). Furthermore, when APs were evoked by depolarizing currents, LH CART− cells had a shorter firing latency and fired more frequently than CART+ cells (Figures 6F,G and Supplementary Figure S5).
For additional analysis of APs, data from different anatomical regions were combined, as MCH/CART+ cells were less excitable and often did not fire any APs. Among the cells that fired at least four APs, which allowed the assessment of the spike adaptation ratio, CART+ cells were found to show greater adaptation than CART− cells, particularly in males (Figure 6H). A comparison of the AP waveform found no differences in AP threshold, AP amplitude or AHP amplitude according to the neurochemical identity or sex (Figures 6I–K). However, a main effect of CART expression and sex were found for the AP half-width (Figure 6L). Taken together, these results indicate that MCH/CART− cells in LH are more excitable than MCH/CART+ cells in LH, ZI and MH, whereas MCH/CART+ cell have similar electrophysiological properties regardless of their location.
One of the hallmarks of MCH neurons is the lack of an H-like current (Fang et al., 2023; Belanger-Willoughby et al., 2016). Surprisingly, however, some MCH neurons displayed a voltage sag, defined as the difference between the peak membrane potential and subsequent stead-state potential reached upon injection of hyperpolarizing currents, which was specific to CART− neurons in both males and females. MCH/CART+ neurons did not show any voltage sag regardless of anatomical region (Figures 7A–E). This voltage sag was inhibited by the H-current inhibitor ZD 7288 (Figures 7F–H).
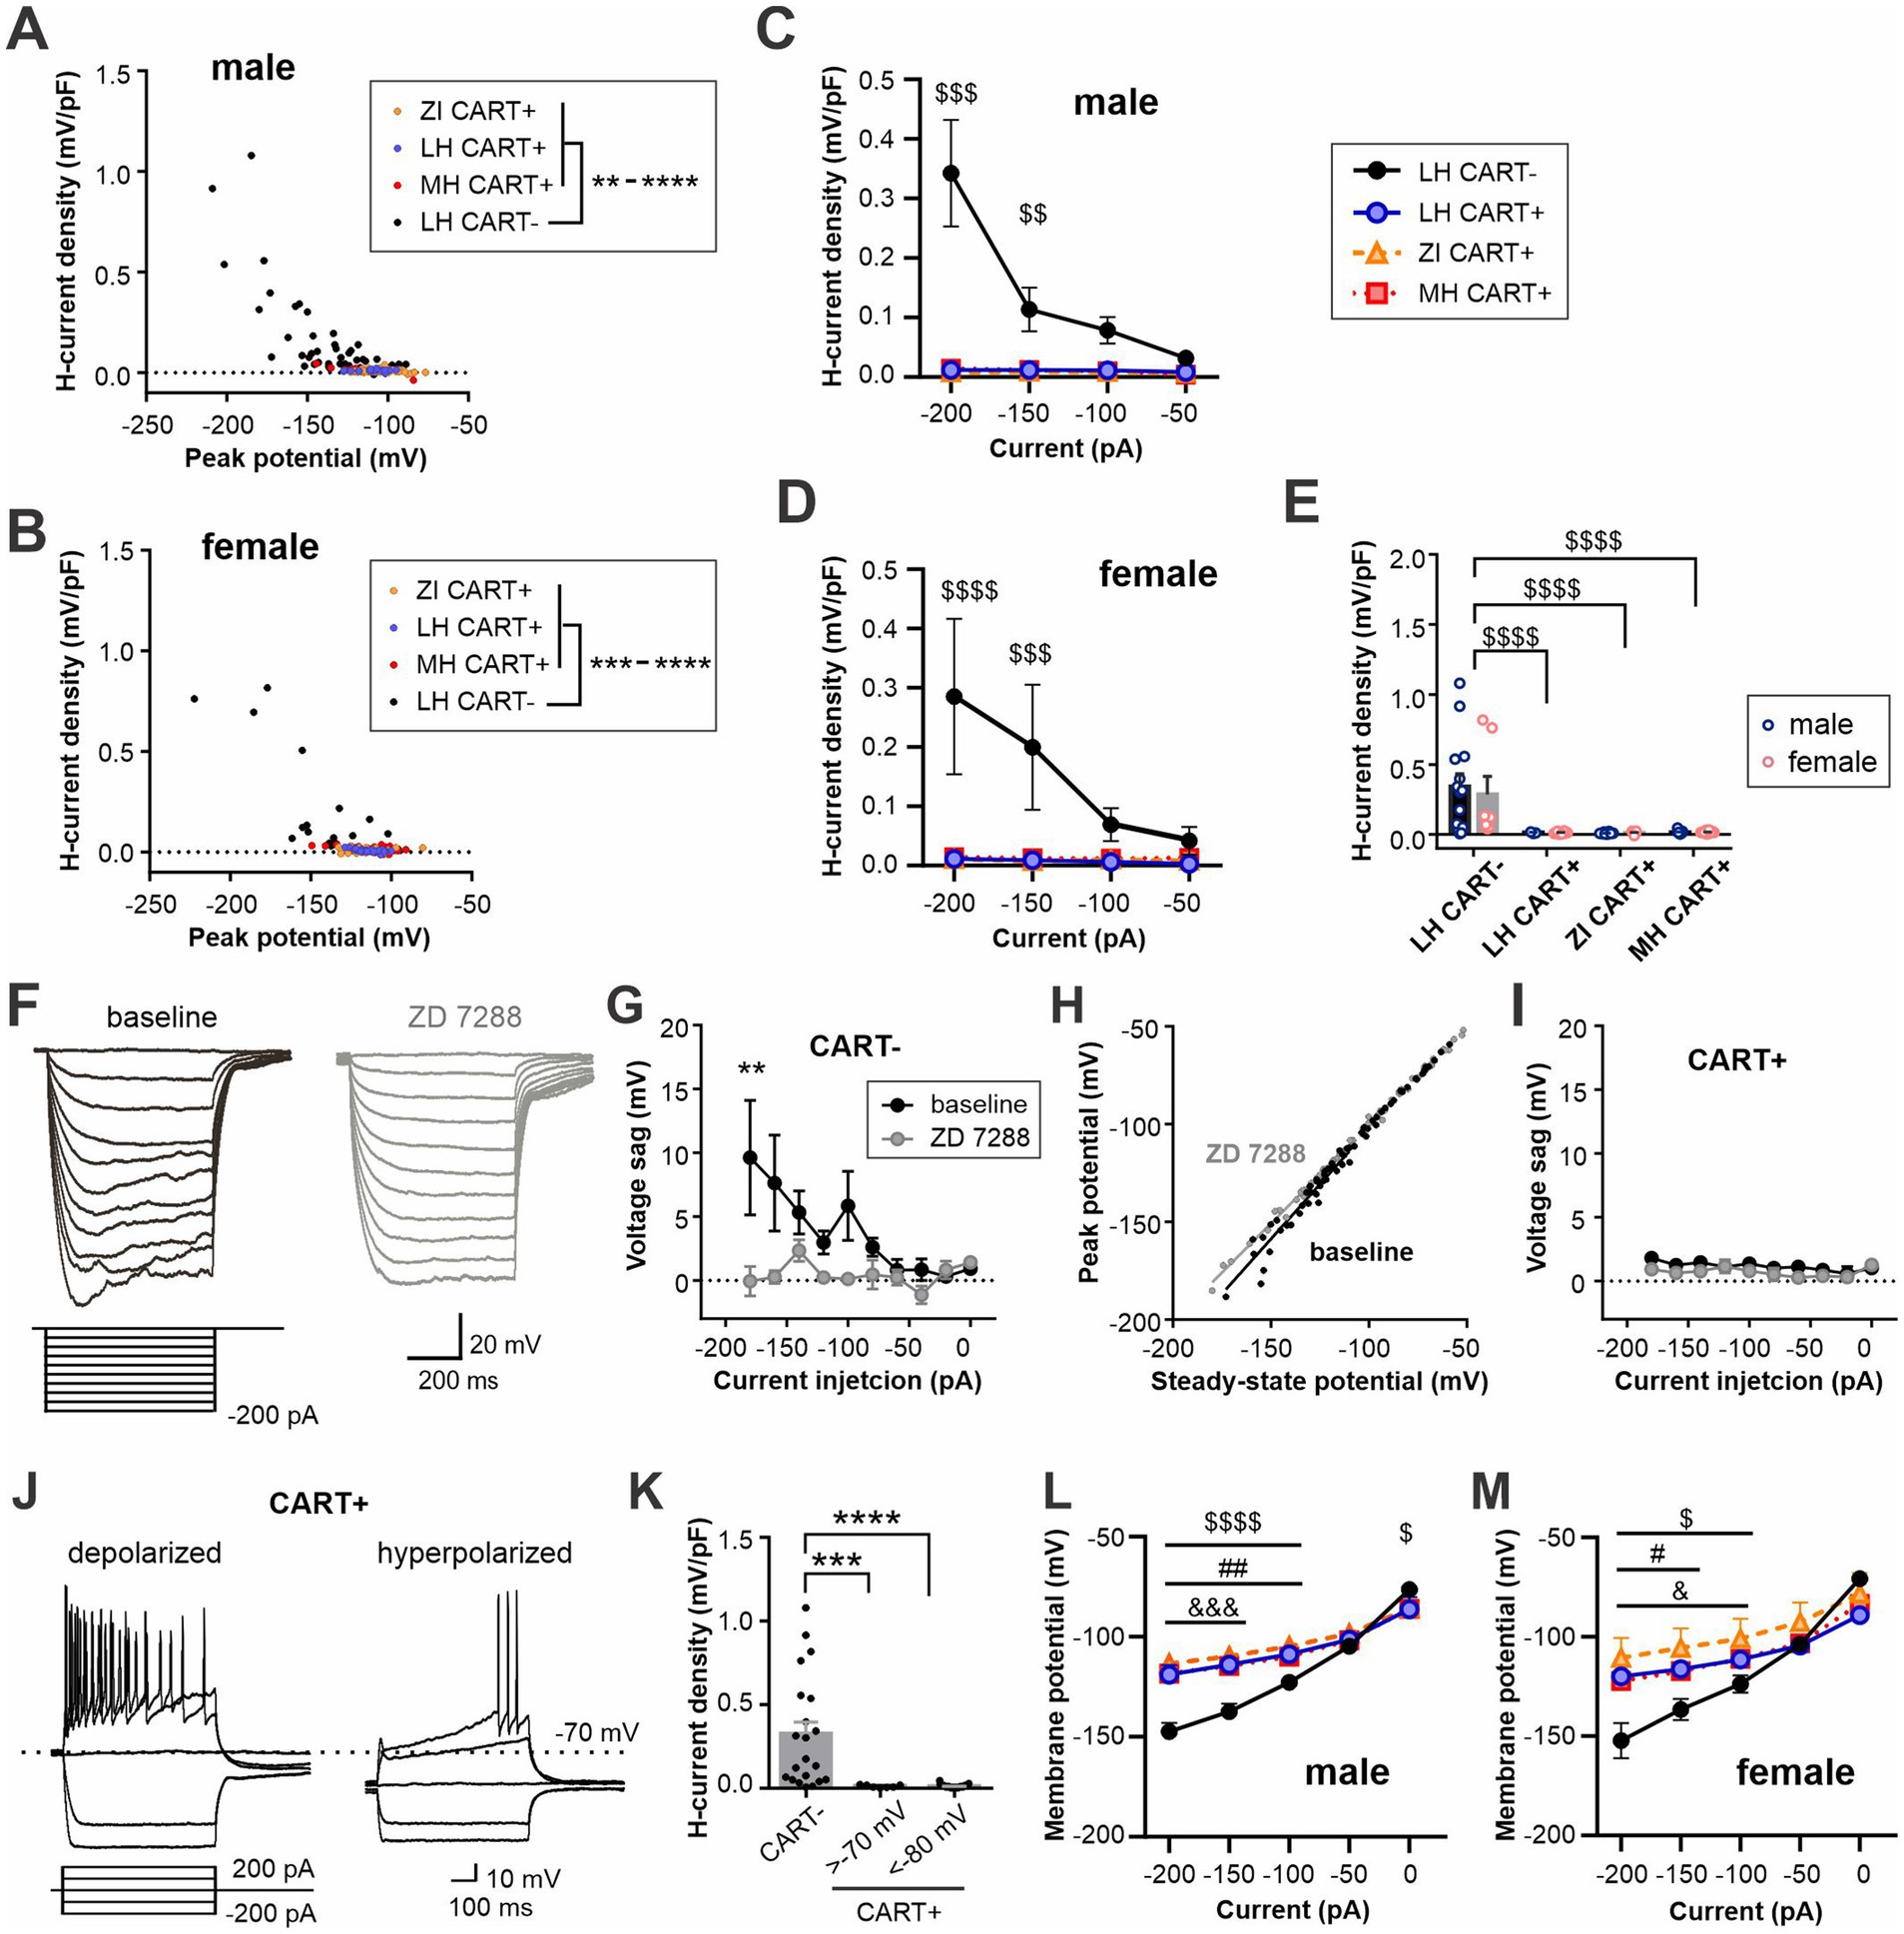
Figure 7. CART-negative MCH neurons display H-currents. (A,B) X–Y scatter plot of H-current density recorded after the peak membrane potential reached in response to hyperpolarizing current steps applied to male (A) and female (B) MCH neurons. The current steps ranged from −200 to −50 pA. Values from individual cells are pooled according to cell type. (C,D) H-current density in response to a range of hyperpolarizing current injections in male (C) and female cells (D). (E) A summary plot showing H-current density recorded from −200 pA injection. (F) Representative current clamp recording from a MCH/CART− cell before (baseline) and during ZD 7288 application. (G) Repeated measures of voltage sag at baseline and in the presence of ZD 7288 in MCH/CART− cells. (H) X–Y scatter plot of the membrane potential at the peak of a voltage sag and ensuing steady-state in MCH/CART− cells shown in (G). (I) Repeated measures of voltage sag at baseline and in the presence of ZD 7288 in MCH/CART+ cells. (J) Example recording of depolarized and hyperpolarized CART-positive MCH neurons. A minor population of MCH/CART+ neurons shows depolarized RMP like that of CART− neurons (>−70 mV) but lacks H-current. (K) A summary graph showing that H-current is unique to MCH/CART− neurons. (L,M) Steady-state potential in response to 600-ms hyperpolarizing current steps of varying magnitude in male (L) and female (M) MCH neurons. (C–E) $$p < 0.01, $$$p < 0.001, $$$$p < 0.0001, LH CART− vs. all CART+ groups. (G,K) **p < 0.01, ***p < 0.001, ****p < 0.0001. (L,M) $p < 0.05, $$$$p < 0.0001, LH CART− vs. ZI; #p < 0.05, ##p < 0.01, LH CART− vs. LH CART+; &p < 0.05, &&&p < 0.001, LH CART− vs. MH. Mean ± SEM are shown. For (G–K), male and female cells were pooled since no sex differences were found in H-current density (E).
Since MCH/CART− neurons had relatively depolarized RMP, it is possible that this is a characteristic of depolarized MCH neurons regardless of CART expression. However, we found that MCH/CART+ neurons, either depolarized (RMP > −70 mV), like CART− cells, or hyperpolarized (RMP < −80 mV), did not show a significant H-current (Figures 7J,K). Thus, H-current is a unique feature of MCH/CART− neurons, which has previously gone unnoticed.
Another unique feature of MCH neurons is inward rectification at negative membrane potentials. The steady-state membrane potential reached during a series of current injections displayed inward rectification in MCH/CART+ cells, which was more prominent than that in MCH/CART− cells in both males and females (Figures 7L,M), in agreement with a previous study (Miller et al., 2024).
DiscussionThe present study shows that discrete subpopulations of MCH neurons have distinct electrophysiological characteristics. Our primary finding denotes MCH neurons found in the LH to be more excitable than those found in the ZI or MH. When these cells were held at the same subthreshold potential, this difference in excitability between LH and ZI cells persisted, whereas MH cells became as excitable as LH cells. AP properties were similar between MH and LH cells, while ZI cells had a depolarized AP threshold. The higher AP threshold of ZI MCH neurons explains why these cells are less excitable than those in the other two regions. On the other hand, a modest difference in the firing response between MH and LH neurons may be due to some differences in active conductance that are yet to be investigated.
Another key finding of this study is that a subset of MCH neurons co-expressing CART have different electrophysiological properties compared to those devoid of CART. The previously described general electrophysiological properties of MCH neurons include a relatively hyperpolarized RMP, lack of spontaneous activity at rest, A-type current, spike adaptation upon injecting positive current, and absence of an H-current (Eggermann et al., 2003; Van Den Pol et al., 2004; Belanger-Willoughby et al., 2016). In our study, MCH/CART+ neurons displayed these aforementioned characteristics, consistent with previous studies. On the other hand, MCH/CART− neurons were relatively depolarized at rest and fired more APs upon stimulation with driving currents. As MCH/CART− neurons were primarily localized in the LH and sparsely elsewhere, their unique electrophysiological properties likely accounted for the area-dependent differences. Supporting this notion is our finding that the electrophysiological properties of MCH/CART+ neurons are largely the same across anatomical areas.
A striking feature specific to MCH/CART− neurons found in our study is the H-current. H-current is mediated by the hyperpolarization-activated cyclic nucleotide gated (HCN) channels, which are regulated by the second messenger cyclic AMP (cAMP) (Lüthi and McCormick, 1998; Wang et al., 2002). Thus, the presence of HCN channels provides a mechanism for neuromodulators acting via a cAMP-dependent pathway, such as adenosine and norepinephrine, to modulate this subpopulation of MCH neurons.
We also found that MCH/CART− neurons had a shorter AP half-width, which is consistent with a previous report (Fujita et al., 2021). Furthermore, another study found an intense spike adaptation in MCH/CART+ cells but not in MCH/CART− cells (Miller et al., 2024), which is in accordance with our finding that MCH/CART+ cells display a greater spike adaptation. However, this report did not find differences in the RMP of MCH/CART+ and MCH/CART− cells (Miller et al., 2024). This contrasts with our result showing significantly depolarized RMP of MCH/CART− neurons in the LH. The reasons for this discrepancy are unclear, but may include limiting the sampling of MCH/CART− neurons within the LH in our study, different chemical compositions of solutions used or housing conditions such as diet and room temperature.
Taken together, our study shows that MCH/CART− neurons in the LH are equipped with ionic mechanisms that allow them to be more excitable, including a depolarized RMP, H-current, and minimal spike adaptation. On the other hand, MCH/CART+ cells have largely similar electrophysiological properties, despite their relatively diffuse distribution across the hypothalamus and the zona incerta. This indicates that functional distinctions among these cells are more likely dependent on their extrinsic characteristics. It is worth noting that the hypothalamus receives inputs from diverse brain regions, some of which are spatially segregated, with the LH, MH and ZI receiving distinct range of inputs (Fujita et al., 2021; Wang et al., 2021). Conversely, MCH/CART+ and MCH/CART− neurons have different projection patterns (Cvetkovic et al., 2004). Specifically, MCH/CART+ neurons follow an ascending path to cortical areas, while MCH/CART− neurons project more caudally, innervating the brainstem and spinal cord. Thus, MCH neurons within different anatomical localization may constitute a unique functional subgroup with discrete connectivity within a broader network. Therefore, accurate reporting of the anatomical and/or neurochemical features of MCH neurons in future studies would enhance our understanding of the MCH system.
Data availability statementThe raw data supporting the conclusions of this article will be made available by the authors, without undue reservation.
Ethics statementThe animal study was approved by Memorial University Institutional Animal Care Committee. The study was conducted in accordance with the local legislation and institutional requirements.
Author contributionsRA: Formal analysis, Investigation, Writing – original draft. MC: Investigation, Formal analysis, Writing – review & editing. LF: Writing – review & editing, Conceptualization, Investigation. MH: Writing – review & editing, Conceptualization, Formal analysis, Funding acquisition, Supervision, Validation, Visualization, Writing – original draft.
FundingThe author(s) declare that financial support was received for the research, authorship, and/or publication of this article. This study was funded by the Canadian Institutes of Health Research (CIHR) Project Grant (PJT-153173) to MH. LF was a recipient of the CIHR Doctoral Award.
Conflict of interestThe authors declare that the research was conducted in the absence of any commercial or financial relationships that could be construed as a potential conflict of interest.
Publisher’s noteAll claims expressed in this article are solely those of the authors and do not necessarily represent those of their affiliated organizations, or those of the publisher, the editors and the reviewers. Any product that may be evaluated in this article, or claim that may be made by its manufacturer, is not guaranteed or endorsed by the publisher.
Supplementary materialThe Supplementary material for this article can be found online at: https://www.frontiersin.org/articles/10.3389/fncel.2024.1439752/full#supplementary-material
ReferencesAdamantidis, A., Salvert, D., Goutagny, R., Lakaye, B., Gervasoni, D., Grisar, T., et al. (2008). Sleep architecture of the melanin-concentrating hormone receptor 1-knockout mice. Eur. J. Neurosci. 27, 1793–1800. doi: 10.1111/j.1460-9568.2008.06129.x
PubMed Abstract | Crossref Full Text | Google Scholar
Alon, T., and Friedman, J. M. (2006). Late-onset leanness in mice with targeted ablation of melanin concentrating hormone neurons. J. Neurosci. 26, 389–397. doi: 10.1523/JNEUROSCI.1203-05.2006
PubMed Abstract | Crossref Full Text | Google Scholar
Belanger-Willoughby, N., Linehan, V., and Hirasawa, M. (2016). Thermosensing mechanisms and their impairment by high-fat diet in orexin neurons. Neuroscience 324, 82–91. doi: 10.1016/j.neuroscience.2016.03.003
PubMed Abstract | Crossref Full Text | Google Scholar
Bittencourt, J. C. (2011). Anatomical organization of the melanin-concentrating hormone peptide family in the mammalian brain. Gen. Comp. Endocrinol. 172, 185–197. doi: 10.1016/J.YGCEN.2011.03.028
PubMed Abstract | Crossref Full Text | Google Scholar
Bittencourt, J. C., Presse, F., Arias, C., Peto, C., Vaughan, J., Nahon, J. L., et al. (1992). The melanin-concentrating hormone system of the rat brain: an immuno- and hybridization histochemical characterization. J. Comp. Neurol. 319, 218–245. doi: 10.1002/cne.903190204
PubMed Abstract | Crossref Full Text | Google Scholar
Borowsky, B., Durkin, M. M., Ogozalek, K., Marzabadi, M. R., DeLeon, J., Lagu, B., et al. (2002). Antidepressant, anxiolytic and anorectic effects of a melanin-concentrating hormone-1 receptor antagonist. Nat. Med. 8, 825–830. doi: 10.1038/nm741
PubMed Abstract | Crossref Full Text | Google Scholar
Chee, M. J. S., Pissios, P., and Maratos-Flier, E. (2013). Neurochemical characterization of neurons expressing melanin-concentrating hormone receptor 1 in the mouse hypothalamus. J. Comp. Neurol. 521, 2208–2234. doi: 10.1002/cne.23273
PubMed Abstract | Crossref Full Text | Google Scholar
Chometton, S., Cvetkovic-Lopes, V., Houdayer, C., Franchi, G., Mariot, A., Poncet, F., et al. (2014). Anatomical organization of MCH connections with the pallidum and dorsal striatum in the rat. Front. Syst. Neurosci. 8:185. doi: 10.3389/fnsys.2014.00185
PubMed Abstract | Crossref Full Text | Google Scholar
Croizier, S., Franchi-Bernard, G., Colard, C., Poncet, F., la Roche, A., and Risold, P. Y. (2010). A comparative analysis shows morphofunctional differences between the rat and mouse melanin-concentrating hormone systems. PLoS One 5:e15471. doi: 10.1371/journal.pone.0015471
PubMed Abstract | Crossref Full Text | Google Scholar
Cvetkovic, V., Brischoux, F., Jacquemard, C., Fellmann, D., Griffond, B., and Risold, P. Y. (2004). Characterization of subpopulations of neurons producing melanin-concentrating hormone in the rat ventral diencephalon. J. Neurochem. 91, 911–919. doi: 10.1111/j.1471-4159.2004.02776.x
PubMed Abstract | Crossref Full Text | Google Scholar
Eggermann, E., Bayer, L., Serafin, M., Saint-Mleux, B., Bernheim, L., Machard, D., et al. (2003). The wake-promoting hypocretin-orexin neurons are in an intrinsic state of membrane depolarization. J. Neurosci. 23, 1557–1562. doi: 10.1523/jneurosci.23-05-01557.2003
PubMed Abstract | Crossref Full Text | Google Scholar
Fang, L. Z., Linehan, V., Licursi, M., Alberto, C. O., Power, J. L., Parsons, M. P., et al. (2023). Prostaglandin E2 activates melanin-concentrating hormone neurons to drive diet-induced obesity. Proc. Natl. Acad. Sci. 120:e2302809120. doi: 10.1073/pnas.2302809120
PubMed Abstract | Crossref Full Text | Google Scholar
Fujita, A., Zhong, L., Antony, M. S., Chamiec-Case, E., Mickelsen, L. E., and Kanoski, S. E.. (2021). Neurokinin B-expressing neurons of the central extended amygdala mediate inhibitory synaptic input onto melanin-concentrating hormone neuron subpopulations. J. Neurosci. 41, 9539–9560. doi: 10.1523/JNEUROSCI.2600-20.2021
PubMed Abstract | Crossref Full Text | Google Scholar
Haemmerle, C. A. S., Campos, A. M. P., and Bittencourt, J. C. (2015). Melanin-concentrating hormone inputs to the nucleus accumbens originate from distinct hypothalamic sources and are apposed to GABAergic and cholinergic cells in the Long-Evans rat brain. Neuroscience 289, 392–405. doi: 10.1016/j.neuroscience.2015.01.014
PubMed Abstract | Crossref Full Text | Google Scholar
Izawa, S., Yoneshiro, T., Kondoh, K., Nakagiri, S., Okamatsu-Ogura, Y., Terao, A., et al. (2022). Melanin-concentrating hormone-producing neurons in the hypothalamus regulate brown adipose tissue and thus contribute to energy expenditure. J. Physiol. 600, 815–827. doi: 10.1113/JP281241
PubMed Abstract | Crossref Full Text | Google Scholar
Kong, D., Vong, L., Parton, L. E., Ye, C., Tong, Q., Hu, X., et al. (2010). Glucose stimulation of hypothalamic MCH neurons involves KATP channels, is modulated by ucp2, and regulates peripheral glucose homeostasis. Cell Metab. 12, 545–552. doi: 10.1016/j.cmet.2010.09.013
PubMed Abstract | Crossref Full Text | Google Scholar
Linehan, V., and Hirasawa, M. (2018). Electrophysiological Properties of Melanin-Concentrating Hormone and Orexin Neurons in Adolescent Rats. Front. Cell. Neurosci. 12:70. doi: 10.3389/fncel.2018.00070
PubMed Abstract | Crossref Full Text | Google Scholar
Linehan, V., Trask, R. B, Briggs, C., Rowe, T. M., and Hirasawa, M. (2015). Concentration-dependent activation of dopamine receptors differentially modulates GABA release onto orexin neurons. Eur. J. Neurosci. 42, 1976–1983. doi: 10.1111/ejn.12967
PubMed Abstract | Crossref Full Text | Google Scholar
Miller, P. A., Williams-Ikhenoba, J. G., Sankhe, A. S., Hoffe, B. H., and Chee, M. J. (2024). Neuroanatomical, electrophysiological, and morphological characterization of melanin-concentrating hormone cells coexpressing cocaine- and amphetamine-regulated transcript. J. Comp. Neurol. 532:e25588. doi: 10.1002/cne.25588
留言 (0)