The Mycobacterium abscessus complex (MABC) is a major group of nontuberculous mycobacteria (NTM) that has recently garnered increasing attention due to the rising incidence of infections worldwide (Johansen et al., 2020). MABC encompasses a high degree of genomic diversity, comprising three subspecies: M. abscessus subsp. abscessus, M. abscessus subsp. bolletii, and M. abscessus subsp. massiliense, commonly referred to as M. abscessus (MabA), M. bolletii (MabB), and M. massiliense (MabM), respectively (Bryant et al., 2021). These mycobacteria are ubiquitous in various environments, including water, soil, and dust (Falkinham, 2009). Transmission typically occurs indirectly via fomite contamination or persistent infectious aerosols; however, person-to-person transmission has also been reported, particularly among cystic fibrosis patients, who are more susceptible due to their compromised lung function and frequent hospitalizations (Bryant et al., 2013).
Recently, MABC strains have been increasingly implicated in pulmonary infections, complex skin and soft tissue infections, and disseminated diseases with often poor prognoses (Johansen et al., 2020). Notably, MABC accounts for 22.5% of all NTM clinical isolates in China, and the prevalence of NTM infections among suspected tuberculosis cases has reached 6.3% (Yu et al., 2016; Zhou et al., 2020). A recent study in Shanghai found that MABC was responsible for 16.2% of nontuberculous mycobacterial pulmonary disease (NTM-PD) cases, underscoring its significant prevalence and geographic variability in the region (Zhang et al., 2024).
Although MABC was originally thought to only be independently acquired from the environment, these isolates have evolved from environmental organisms into true pulmonary pathogens (Lopeman et al., 2019). Currently, over 70% of infections in CF patients are caused by genetically clustered isolates, the majority of which belong to seven dominant circulating clones (DCCs) (Bryant et al., 2016; Ruis et al., 2021). These DCCs, first emerging around 1960, have been linked to higher virulence, increased resistance, and worse clinical outcomes compared to unclustered isolates (Bryant et al., 2021).
Whole-genome sequencing (WGS) has proven invaluable for molecular outbreak investigations, source tracking, and population structure analysis, as evidenced by studies in the UK, Germany, and Portugal (Lipworth et al., 2021; Wetzstein et al., 2022; Carneiro et al., 2023). To support standardized molecular surveillance, Diricks et al. developed a core genome multilocus sequence typing (cgMLST) scheme for MABC, linking DCCs to a reference genome with fewer than 250 alleles, and showing that 99% of pairwise comparisons between epidemiologically related isolates had fewer than 25 alleles, with 90% under 10 alleles (Diricks et al., 2022).
In China, WGS-based research on MABC has primarily focused on antibiotic resistance mechanisms (Ye et al., 2019; Jin et al., 2022; Yang et al., 2024). While these studies have provided valuable insights into the genetic basis of drug resistance, there is a notable lack of research into the population genetics, pan-genome, and molecular epidemiology dynamics of MABC. Understanding these aspects is crucial for implementing effective public health interventions and controlling the spread of this pathogen.
This study aims to fill this gap by analyzing the population genomics of MABC in China using publicly available genome sequences. We implemented cgMLST to identify DCCs and detect potential transmission events. Additionally, we explored genetic diversity through population genetics, pan-genome analyses, and profiling of virulence factors (VFs), antimicrobial resistance genes (ARGs), and mobile genetic elements (MGEs). This work would enhance the understanding of MABC population genetic diversity in China, thereby informing public health strategies and clinical management.
2 Materials and methods2.1 Genome collection, quality control and characterizationWe retrieved all publicly available MABC genome assemblies from the Bacterial and Viral Bioinformatics Resource Center (BV-BRC) as of May 28, 2024, using the search criteria: “GENOMES = Mycobacterium abscessus,” “genome status = WGS,” and “genome quality = good.” The BV-BRC database was chosen for its extensive and high-quality collection of publicly accessible genomic sequences and other omics-related data for bacterial research, rendering it an optimal choice for population genomics studies (Olson et al., 2023). BV-BRC defines “good” genome quality based on criteria such as high-quality sequencing data, minimal contamination, and a complete genome assembly with high coverage, ensuring reliable downstream analysis. All strains were of human origin. Corresponding metadata were obtained from the BV-BRC and cross-verified with the NCBI GenBank database (Supplementary Table S1). The strains were classified into Chinese and Global strains based on the “Isolation Country” information in the metadata. Additionally, we included raw WGS data from two Chinese MABC strains (NCBI SRA: SRR28113991 and SRR26200315) sourced from recent studies (Liao et al., 2024; Peng et al., 2024). The raw reads underwent quality control using fastp and genome assembly with Unicycler, both with default settings (Wick et al., 2017; Chen et al., 2018).
We assessed the quality of the genome assemblies using QUAST v5.0.2, CheckM v1.1.3, and fastANI v1.34 (Gurevich et al., 2013; Parks et al., 2015; Jain et al., 2018). All genomes met the quality criteria with contamination levels below 5%, completeness over 90%, and an average nucleotide identity (ANI) greater than 98% compared to the reference genome GZ002 (RefSeq: NZ_CP034181.1).
2.2 Genome annotationWe annotated all MABC genomes using Prokka v1.14.5 with default parameters. ARGs were identified via RGI v6.0.3, referencing the CARD database v3.2.9 (Alcock et al., 2023). VF genes were screened using the VFDB database (Liu et al., 2022). Prophages were detected and extracted with Phigaro (Starikova et al., 2020). Plasmid content was reconstructed using MOB-suite v3.0.3, specifically MOB-recon, which included relaxase and replicon typing, and generated MOB-cluster codes and host range data (Robertson and Nash, 2018). The identification and characterization of insertion sequence (IS) elements, down to the family level, were performed using digIS (Puterová and Martínek, 2021). Integrative and conjugative elements (ICEs) were identified with ICEberg v2.0 (Liu et al., 2019). Genome visualization was performed using the Proksee website (Grant et al., 2023).
2.3 Molecular genotyping and genomic clusteringAssemblies were compared to a reference sequence for each of the three subspecies, and whole-genome ANI scores were calculated using fastANI. Our reference genomes were ATCC19977 (NCBI RefSeq: NC_010397) for MabA, GO06 (NC_018150) for MabM, and FLAC003 (NZ_CP014950) for MabB. Genomes were assigned to a subspecies based on an ANI of at least 98% with one reference strain (Commins et al., 2023). The specific sequence type (ST) of each genome was identified with pyMLST v2.1.6 using PubMLST typing schemes (Jolley et al., 2018; Biguenet et al., 2023).
The core genome multilocus sequence typing (cgMLST) allelic profiles were determined using chewBBACA v3.1.2 based on a 2,904-loci schema from the RIDOM Nomenclature Server (https://www.cgmlst.org/) developed by Diricks and colleagues (Silva et al., 2018; Diricks et al., 2022). Pairwise cgMLST distances were generated using cgmlst-dists v0.4.0 based on the core genome genes present in more than 95% of the collected genomes. The 95% threshold was chosen to ensure that only core genes, which are highly conserved and present in the majority of isolates, were included in the analysis, thereby minimizing the influence of strain-specific variations and ensuring robust and reliable distance calculations. A minimum spanning tree (MST) was constructed using GrapeTree v1.5.0 with the MSTv2 algorithm (Zhou et al., 2018).
2.4 Phylogenetic reconstructionCore genome alignment and SNP calling (cgSNP) were performed with Parsnp v1.2 from the HarvestTools kit, using GZ002 as the reference (Treangen et al., 2014). Phylogenetic trees were then constructed using RAxML v8.2.9 with the core genome SNP alignment after predicted recombination sites were removed by Gubbins v2.1.0 (Stamatakis, 2014; Croucher et al., 2015). We used a general-time reversible nucleotide substitution model with a GAMMA correction for site variation and applied 1,000 bootstrap replicates with Lewis ascertainment correction for tree construction. Phylogenetic trees were visualized using the Interactive Tree of Life (iTOL) website (Letunic and Bork, 2021).
2.5 Pangenome investigationThe pangenome was reconstructed using Panaroo v1.5.0 in “strict” mode to filter out potential contamination and erroneous annotations (Seemann, 2014; Tonkin-Hill et al., 2020). The resulting gene presence-absence matrix, along with associated metadata, was analyzed in R using the Pagoo framework for principal component analysis (PCA) and to define pangenome structure (Ferrés and Iraola, 2021). The R package micropan was employed to estimate pangenome size and openness according to Heap’s law model and to compute genomic fluidity (Snipen and Liland, 2015). Gene gain and loss rates between different subspecies were calculated using Panstripe v0.3 (Tonkin-Hill et al., 2023).
2.6 Population genetic analysisCore genes from each subspecies, as inferred by Panaroo, were aligned using MAFFT v7.525 (Katoh and Standley, 2013). Nucleotide diversity (π) and Tajima’s D values for each core gene were calculated with the R package pegas (Paradis, 2010). Genome alignments between subspecies, constructed from Parsnp, were input into ClonalFrameML v1.13 to infer the recombination rate (R/θ), the ratio of recombination to mutation rates (R/m), and the locations of recombination sites within and between subspecies (Didelot and Wilson, 2015).
3 Results3.1 Overview of Chinese MABC isolatesIn this study, we obtained 360 MABC genome assemblies from China, following a database screening on May 28, 2024. These isolates, collected between 2018 and 2021, came from twelve studies across eight provinces and municipalities (Supplementary Table S1). The isolates were all clinically relevant, with the majority (93.9%, 338/360) derived from in vitro culture of pulmonary samples. Shanghai had the highest number of isolates, representing 89.2% (n=321) of the total, followed by Zhejiang Province with 6.1% (n=22), while other regions contributed only a small number of isolates.
3.2 Phylogenetic structure of Chinese MABC isolatesMolecular genotyping using ANI identified 273 isolates (75.8%) as MabA and 87 (24.2%) as MabM (Supplementary Table S2). MLST analysis based on the scheme from PubMLST database revealed 68 distinct STs among 350 isolates, with 11 STs having more than 10 members. ST5 was the most predominant (n=63), followed by ST3 (n=46). Additionally, 34 STs were represented by only a single isolate each. We further applied the cgMLST scheme developed by Diricks et al., using a threshold of 250 allelic differences (ADs) for DCC classification (Diricks et al., 2022) and identified six DCCs, comprising 120 (33.3%) Chinese isolates (Supplementary Table S3A).
To refine the evolutionary relationships among Chinese MABC, we reconstructed a phylogenetic tree for all 273 isolates, mapping it with ST, collection location and DCC (Figure 1). Phylogenetic analysis revealed a clear divergence between MabA and MabM. The terminal branch lengths, reflecting the degree of genetic divergence and accumulated evolutionary changes, were significantly shorter for MabA isolates compared to MabM isolates (Supplementary Figure S1).
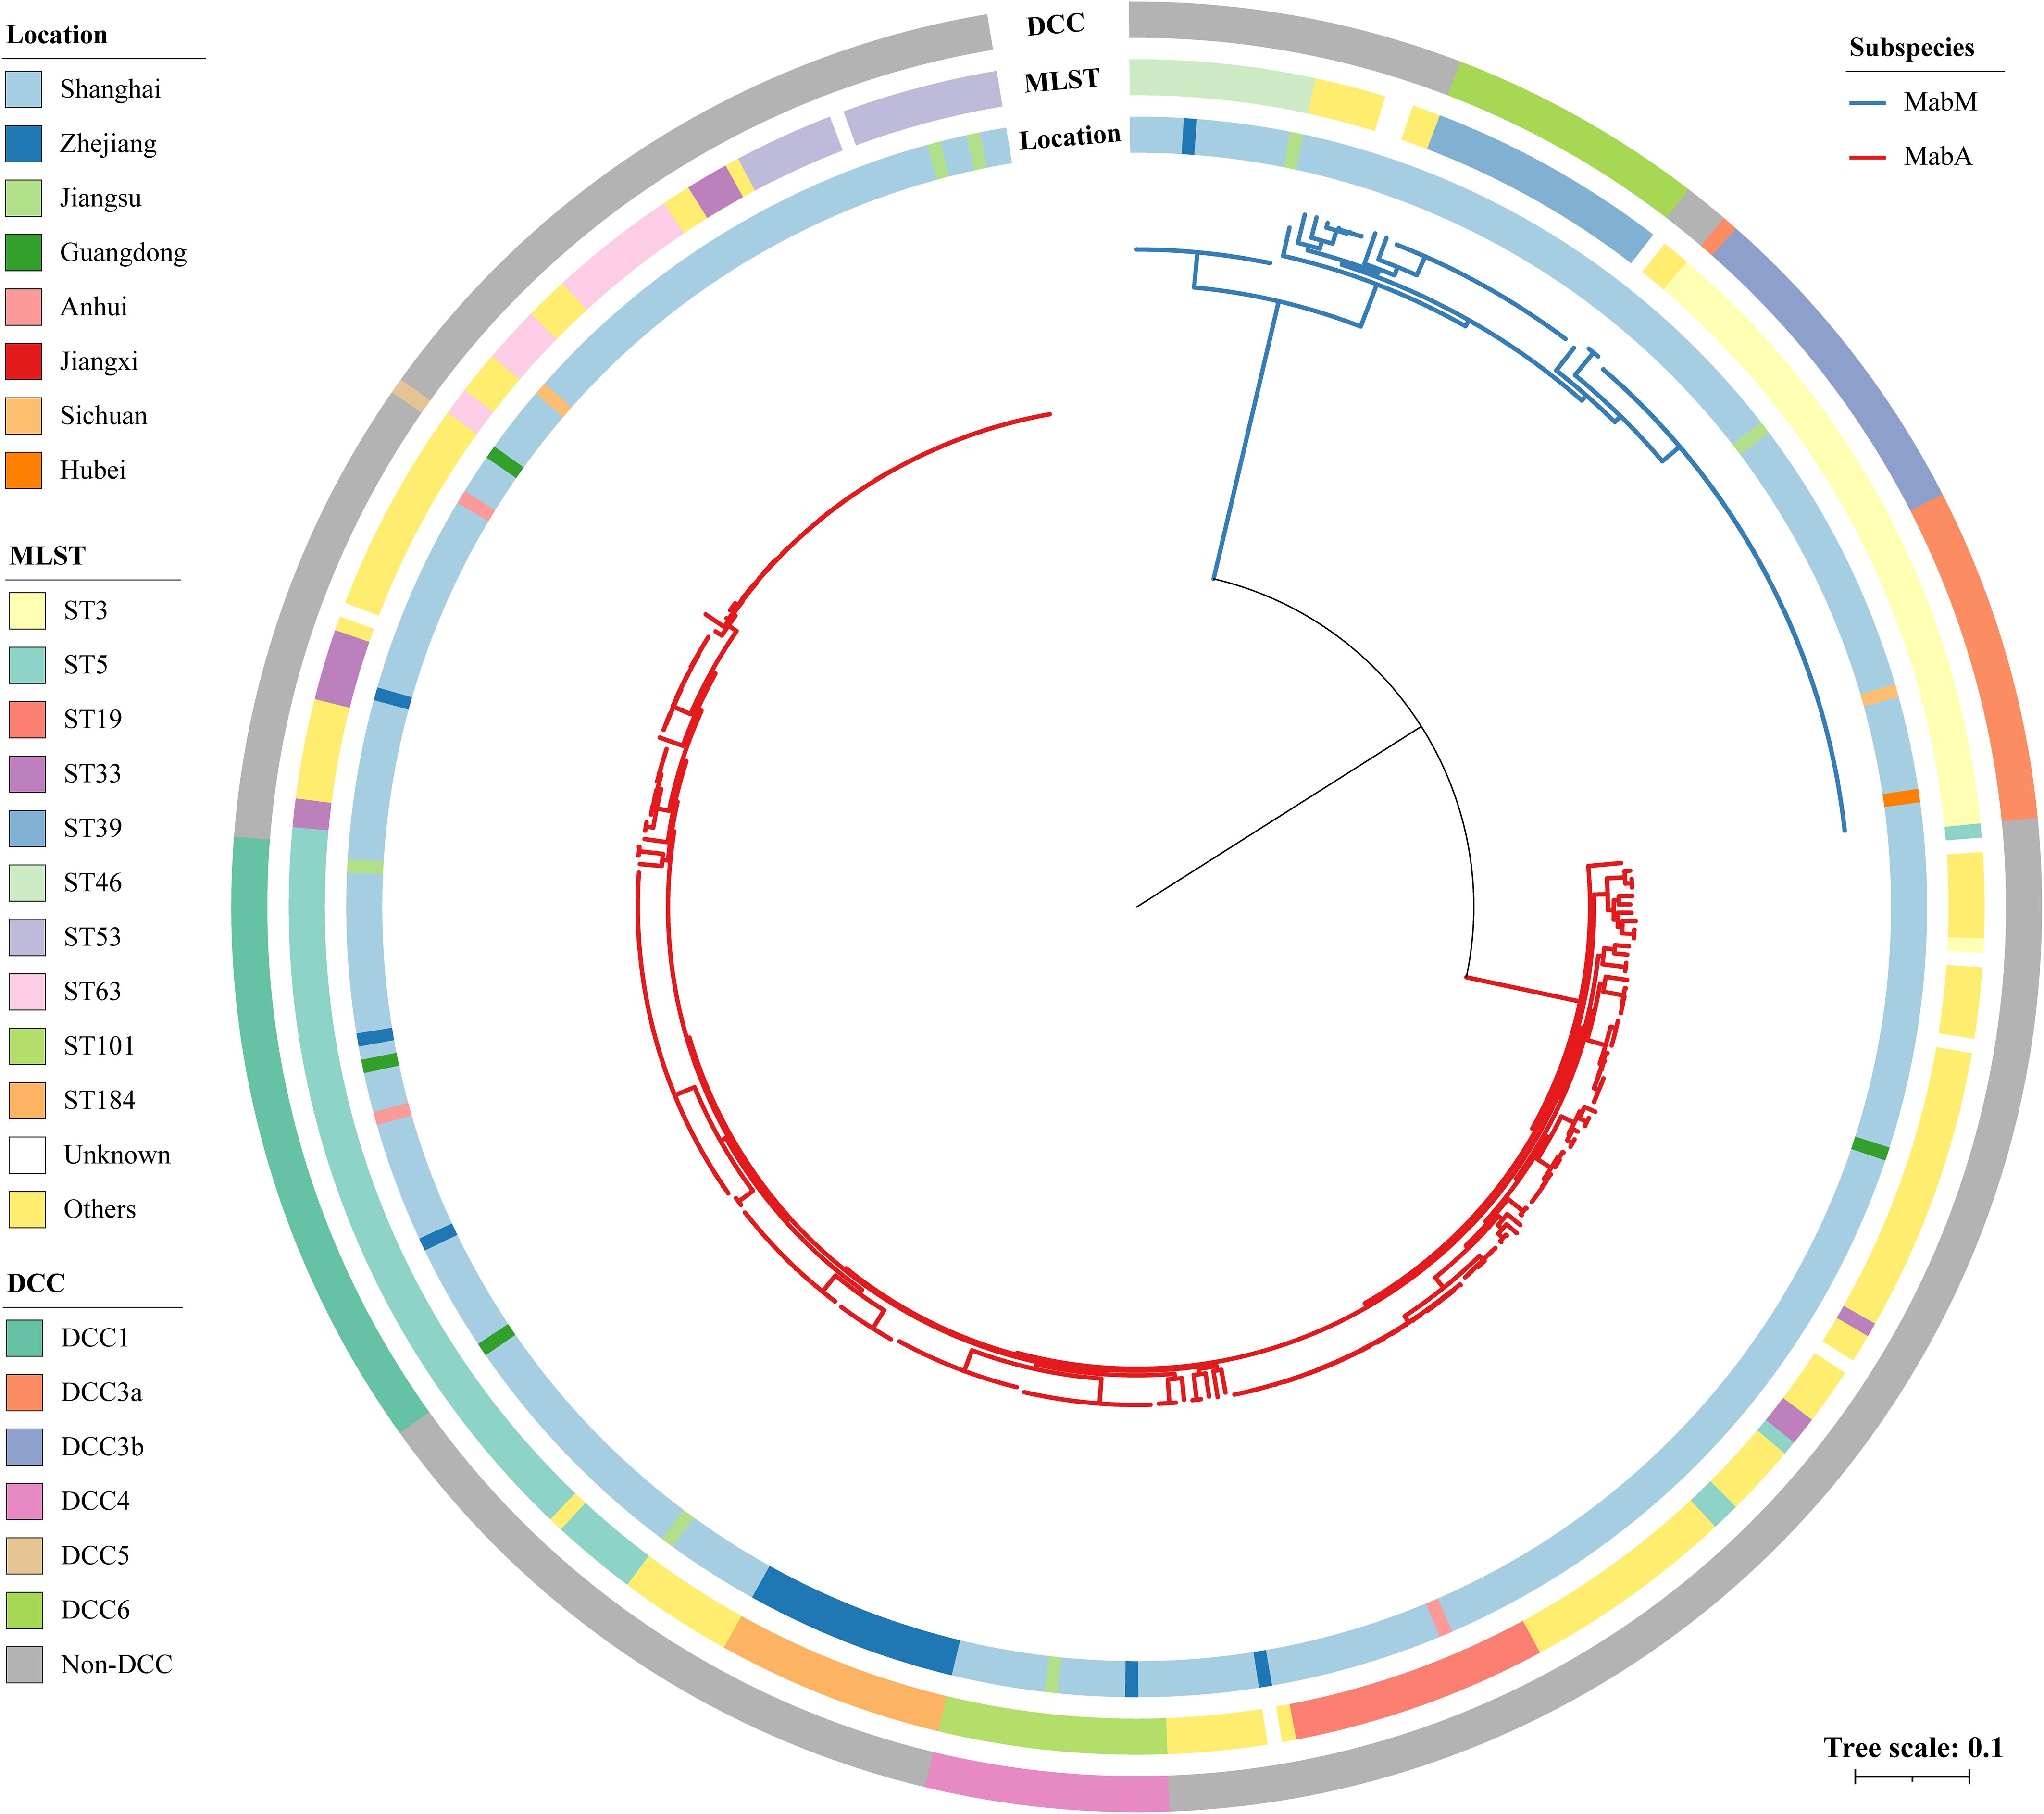
Figure 1. Phylogeny and genotype of 360 Chinese MABC isolates. The different colors on the branches indicate different subspecies. The inner ring represents the collection location, the middle ring shows the STs based on the 7-loci MLST scheme hosted on PubMLST database, and the outer ring indicates the DCC clades. Scale bar shows the number of substitutions per site.
MabA showed greater genetic diversity than MabM, with 58 STs dominated by ST5 (23.1%, 63/273), while MabM has 11 STs, primarily ST3 (51.8%). The proportion of DCC strains was higher in MabM (71.3%, 62/87) than in MabA (21.2%, 58/273). MabM DCC strains were further divided into DCC3a (36.1%, 22/62), DCC3b (36.1%, 22/62), and DCC6 (27.9%, 17/62). In MabA, DCC strains were classified into DCC1 (70.7%, 41/58), DCC42 (27.6%, 16/58), and DCC5 (1.7%, 1/58). Additionally, strains belonging to DCCs exhibit tighter clustering than those belonging to STs on the tree.
3.3 Genomic clustering for Chinese MABC isolatesUsing a 25 AD threshold for potential recent transmission, as suggested by Diricks et al (Diricks et al., 2022), we grouped 178 (49.4%) of the Chinese isolates into 59 genomic clusters, ranging from 2 to 16 isolates per cluster (Figure 2; Supplementary Table S3B). The clustering rate for MabA was 50.2% (137/273), slightly higher than for MabM at 47.1% (41/87). The largest genomic cluster comprised 16 clinical isolates collected in January 2016 from a hospital in Zhejiang Province, including 14 from sputum samples and 4 from ventilator condensate. Previous studies indicated these isolates were linked to a pulmonary MABC outbreak among elderly ICU patients (Hua et al., 2023). Our cgMLST analysis supported this, showing pairwise distances ranging from 2 to 20 ADs, consistent with recent transmission.
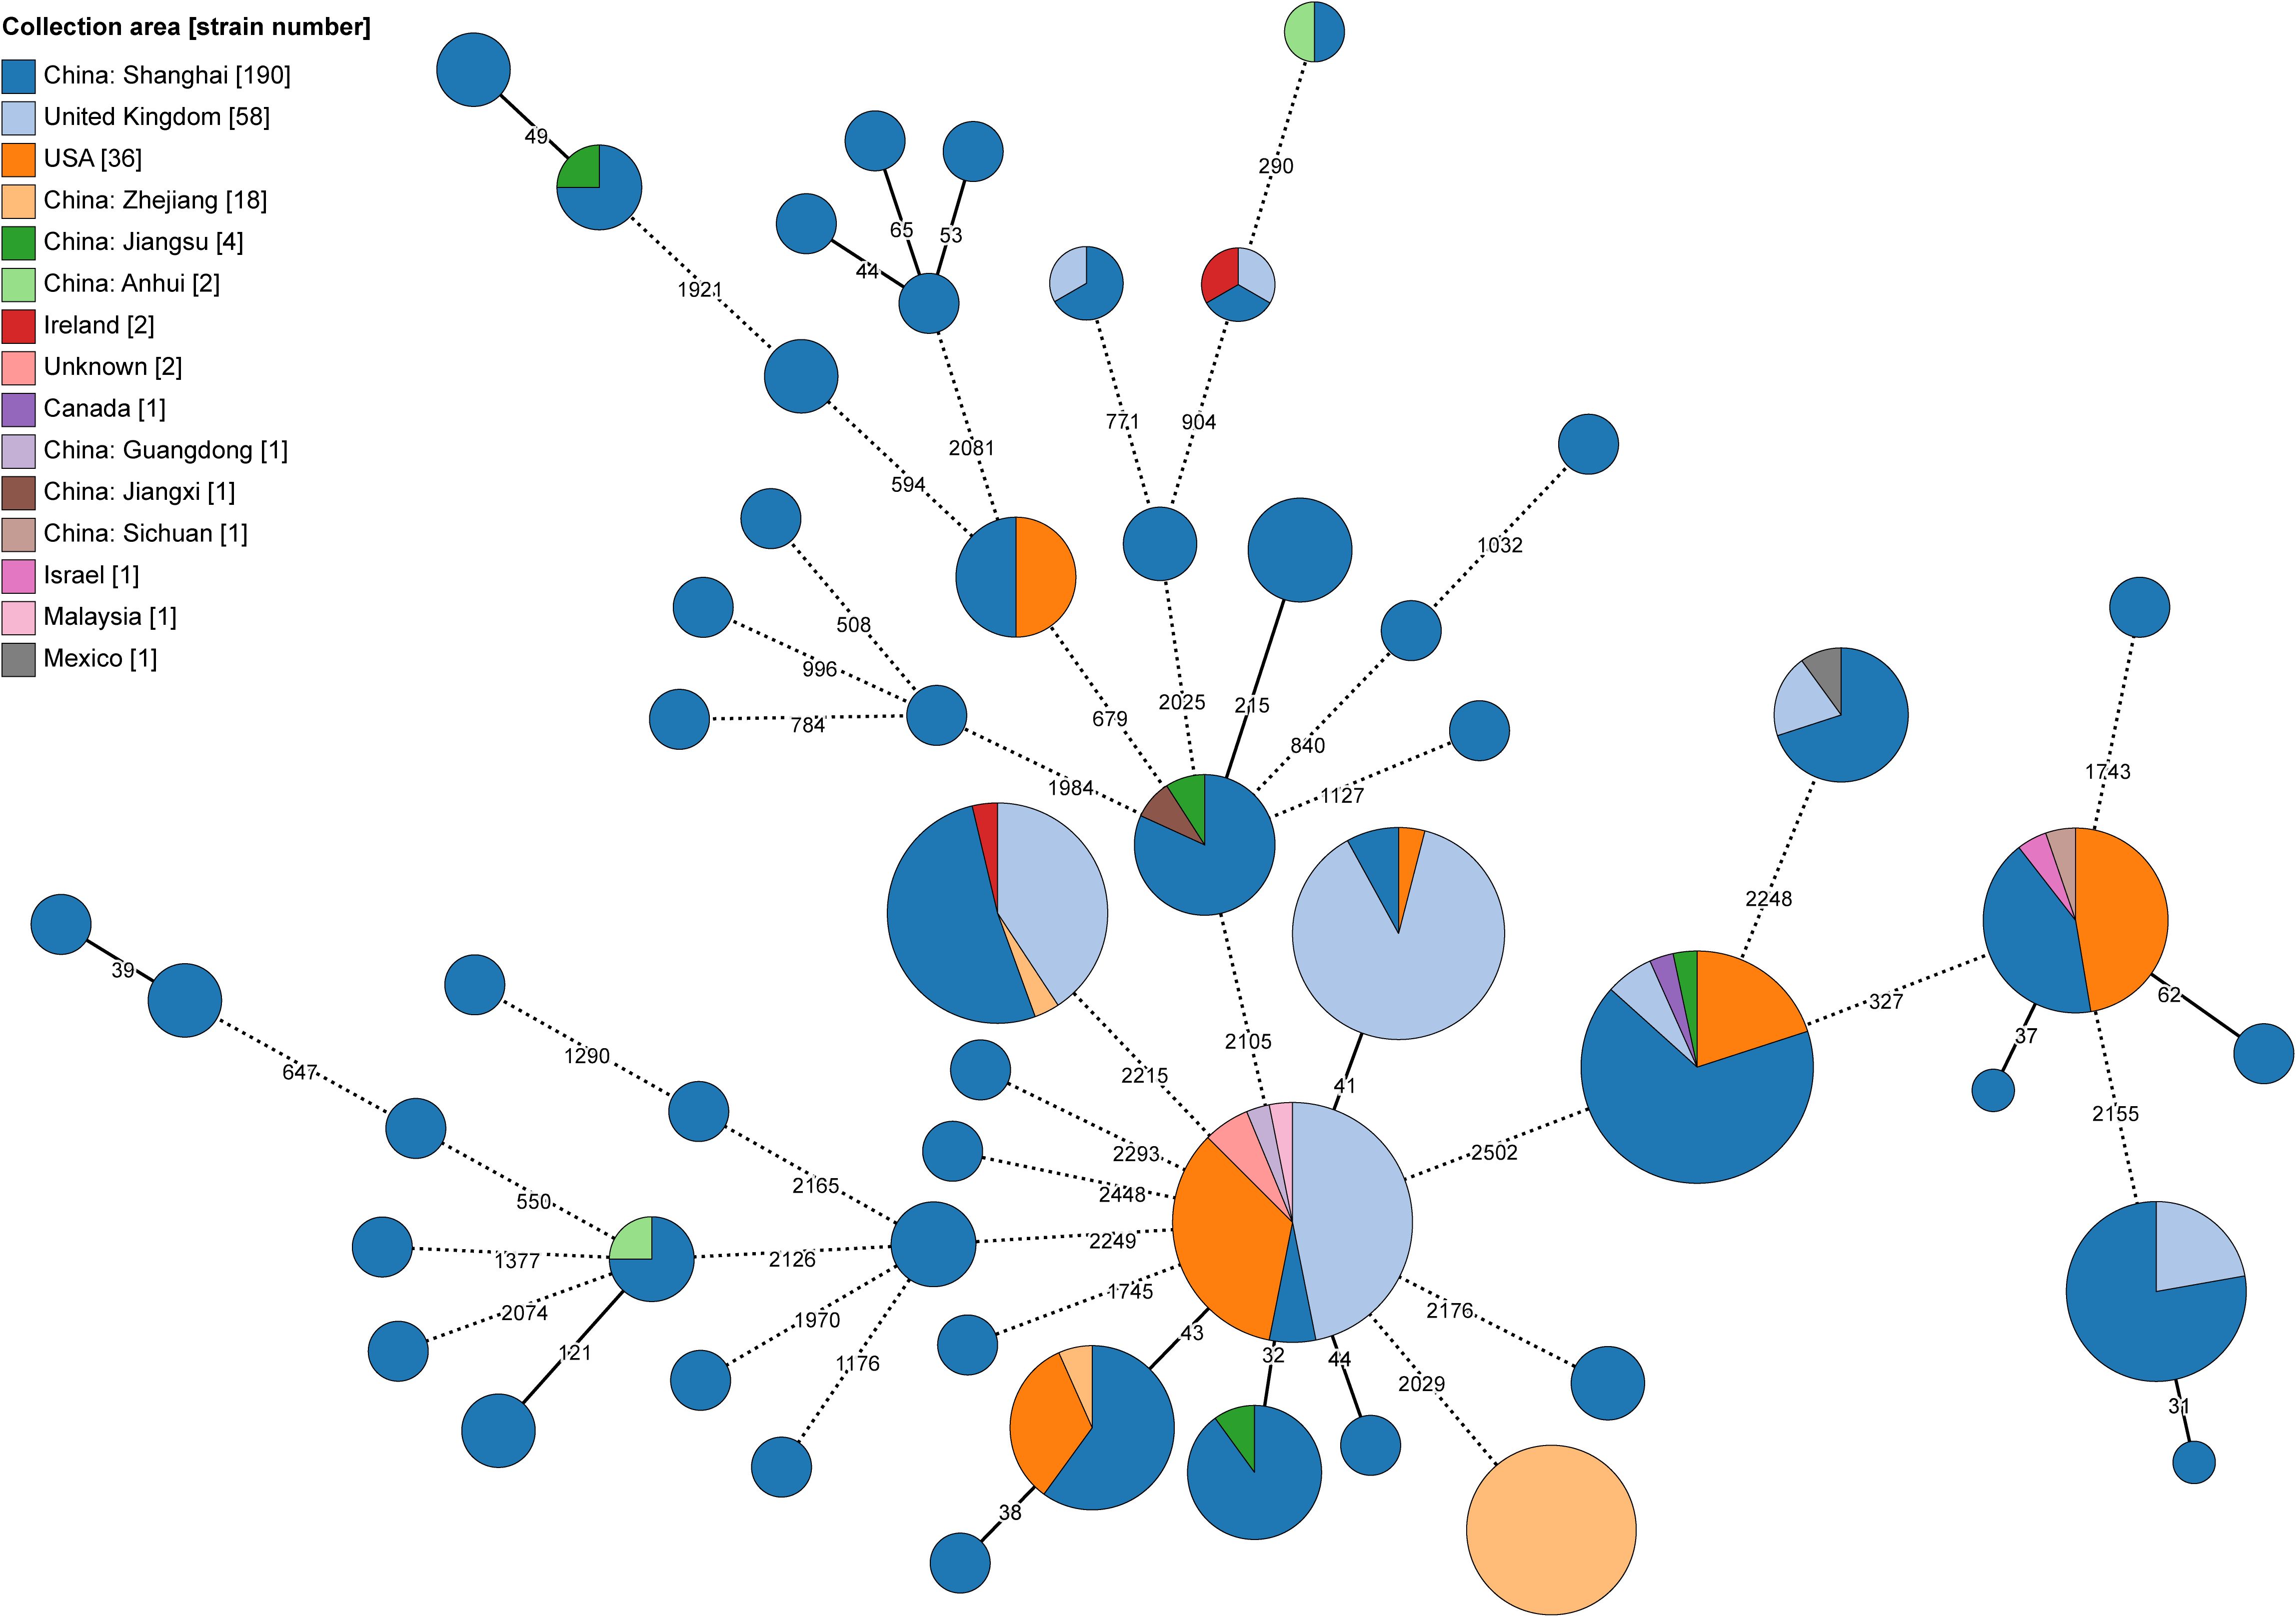
Figure 2. Minimum-spanning tree of recent transmission clustered MABC isolates based on the cgMLST. The size of each node corresponds to the number of isolates within a cluster, with each node’s color representing the isolation area shown as a pie chart. Nodes with fewer than 25 ADs were collapsed together, and branches longer than 250 ADs were shortened and indicated with a hashed line.
The remaining 162 clustered isolates were reported from four NCBI BioProjects linked to a pulmonary hospital in Shanghai. Among these, 69 isolates were part of DCC clusters, with 23 in DCC1, 17 in DCC3b, 13 in DCC4, 10 in DCC6, and 6 in DCC3a. The samples were collected between 2014 and 2017, from locations including Shanghai, Jiangsu, Zhejiang, Anhui, and Jiangxi Provinces—all in Eastern China.
Additionally, we identified 18 clusters at a 25 AD threshold, comprising 65 Chinese isolates and 100 global isolates from seven other countries retrieved from the BV-BRC database (Supplementary Tables S3C, D). These clusters included 58 isolates from the UK, 36 from the USA, and others from Ireland (n=2), Canada (n=1), Israel (n=1), Malaysia (n=1), and Mexico (n=1).
3.4 Evolutionary characteristics and nucleotide diversity of MabA and MabM isolatesTo discover the evolutionary characteristics of MabA and MabM, we measure nucleotide diversity per site (π) and Tajima’s D values based on the core genomes (Figure 3). MabA isolates (median π=7.13e−3) was more diverse than MabM isolates (median π=6.84e−3) in terms of SNP diversity of the core genome (Wilcoxon rank sum test, P-value< 2.2e−16). Furthermore, the Tajima’s D values for MabA isolates displayed a skewed distribution with a high proportion of negative values (median Tajima’s D = -1.42), indicating possible purifying selection or population expansion. In contrast, the distribution for MabM was more balanced around zero (median Tajima’s D = 0.21), suggesting a population at equilibrium. It is worth noting that sequencing depth, which ranged from 67× to 247× in this study, may influence the detection of rare variants, potentially affecting π and Tajima’s D values. However, as sequencing depths were consistently above 60×, their impact on overall results is expected to be minimal.
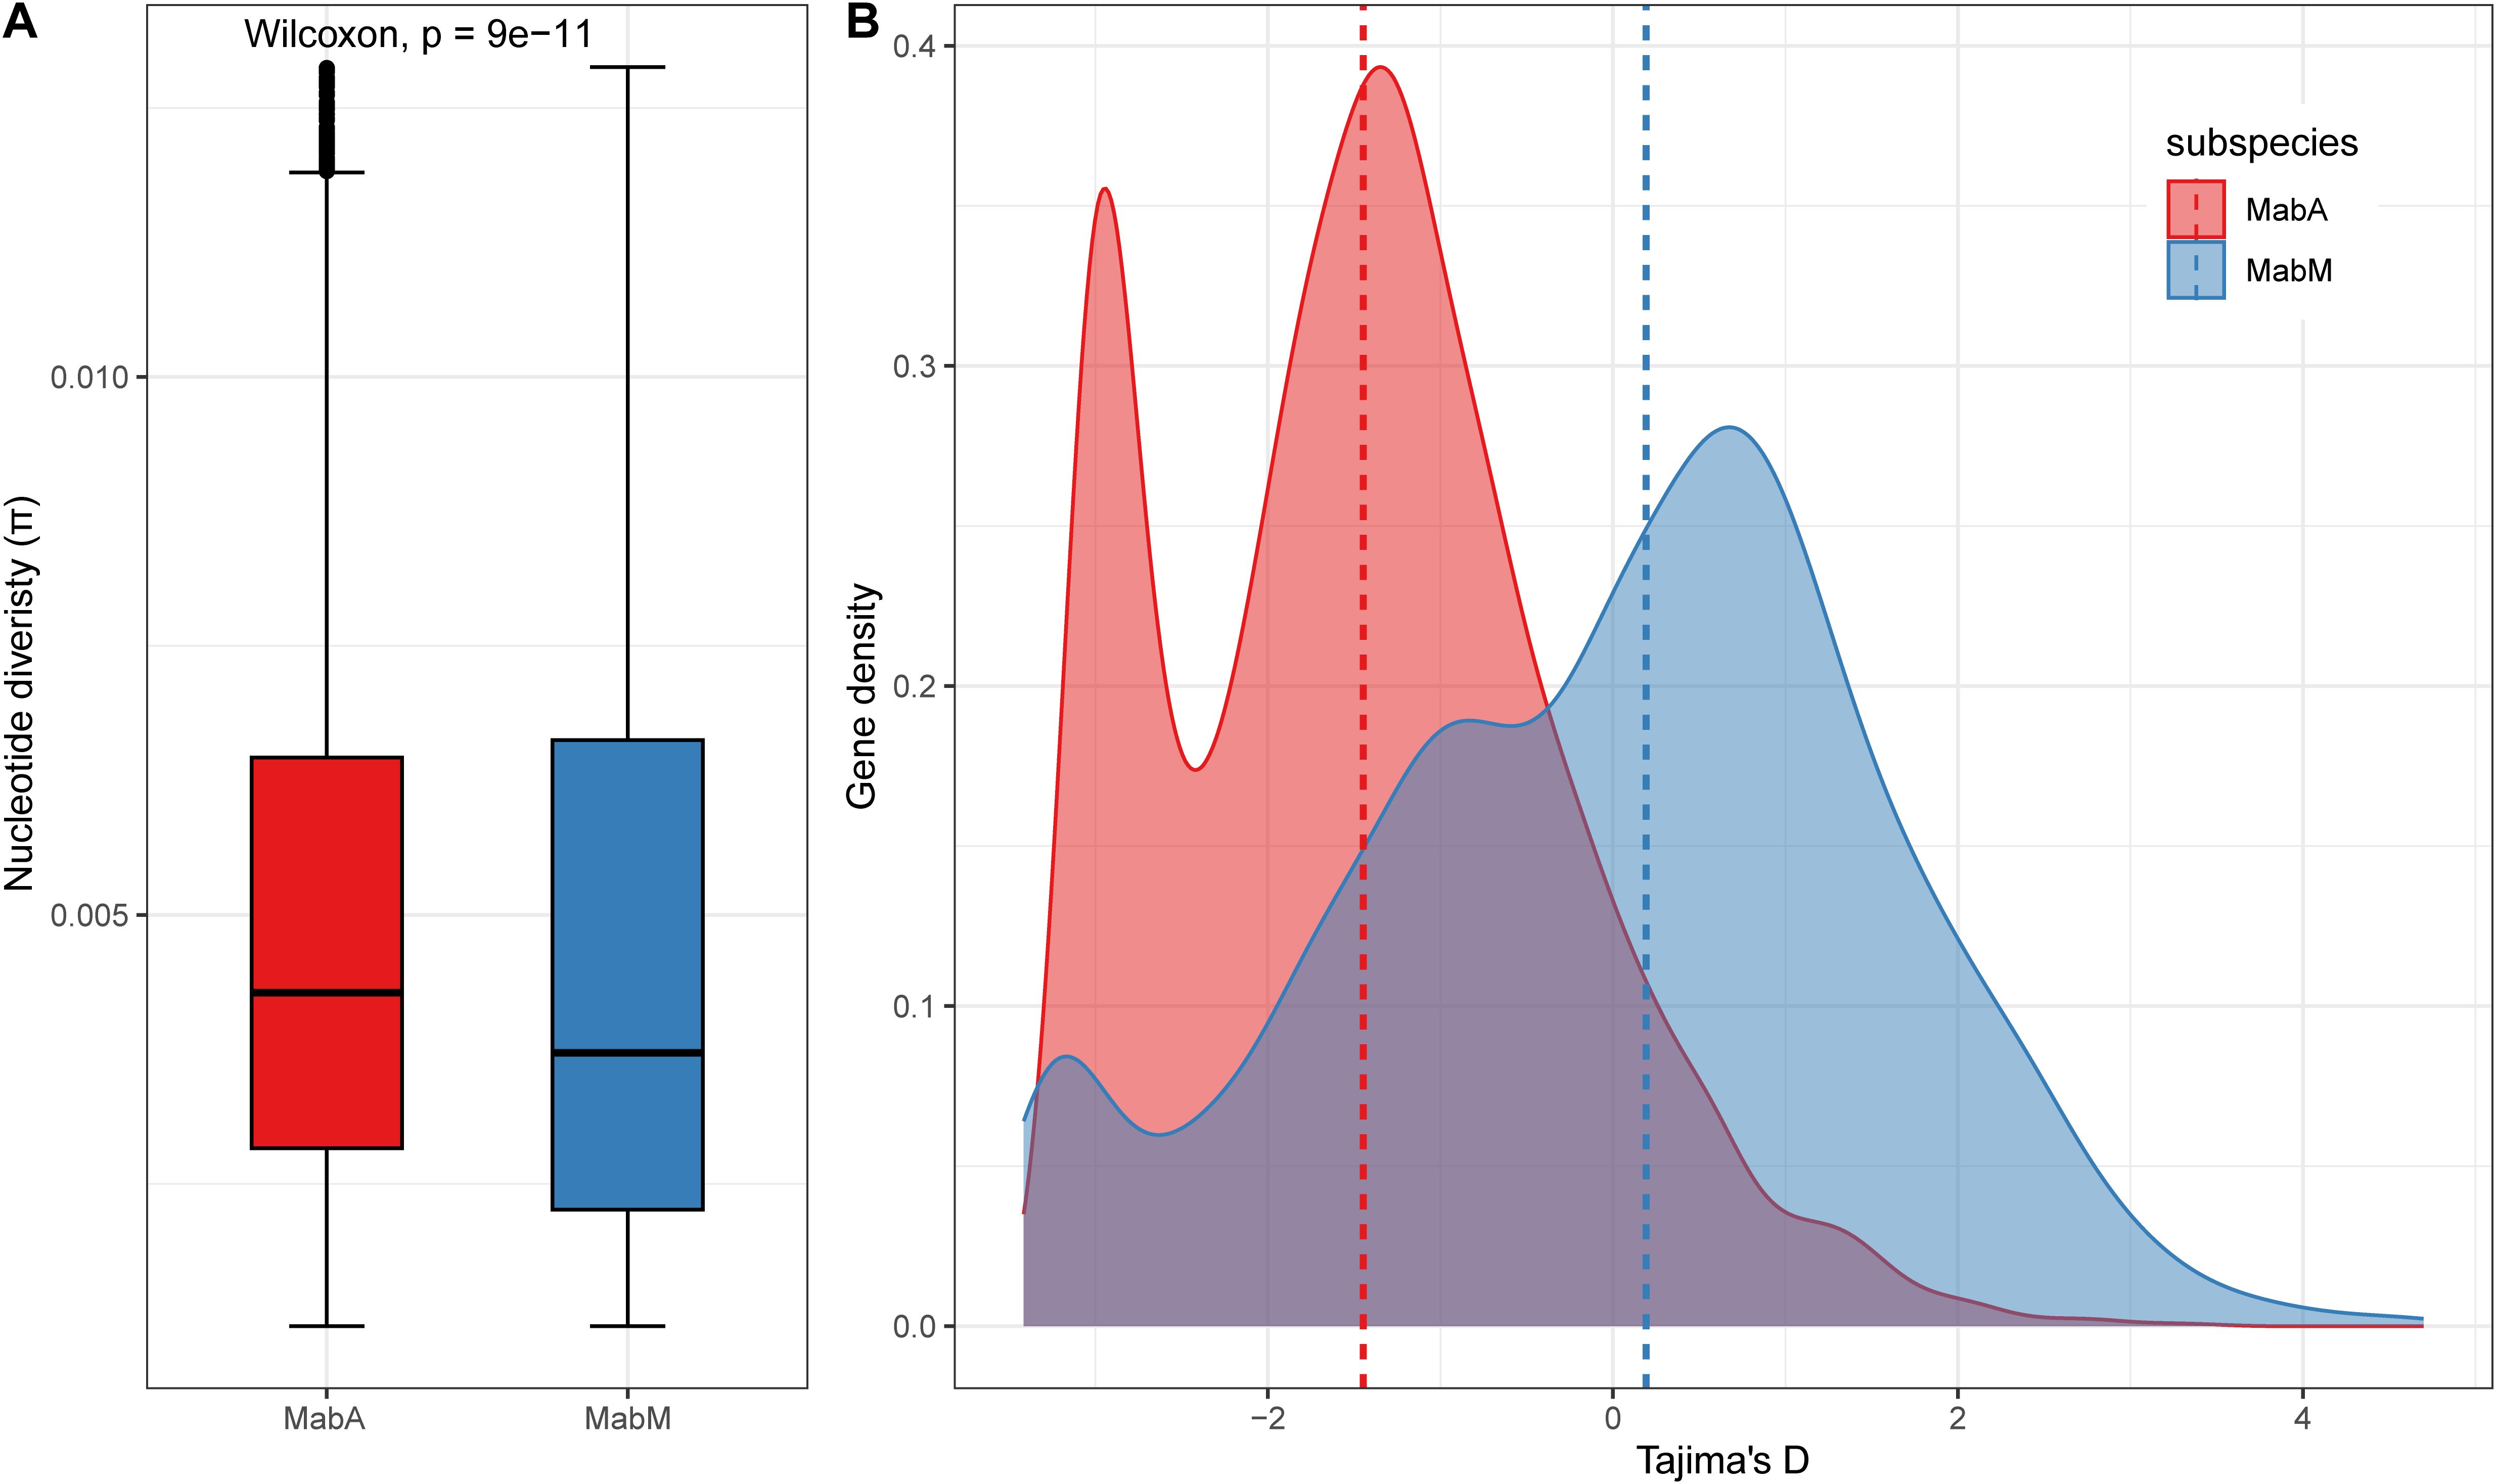
Figure 3. Population genetics of MabA and MabM. (A) Nucleotide diversity (π) values distribution. (B) Tajima’s D values distribution. The dashed line represents the median.
We also conducted ClonalFrameML analyses to estimate homologous recombination rates among the Chinese MABC isolates. Across both MabA and MabM subspecies, the rate of homologous recombination relative to mutation (R/θ) was less than one-half, with the recombination-to-mutation ratio (R/m) estimated at 2.02. This indicates that while recombination events are less frequent than mutations, their impact on nucleotide variation is twice as significant.
3.5 Pan-genome analysis reveals genomic diversity and flexibility among Chinese MABC isolatesWe conducted a pan-genome analysis to explore the genomic diversity among Chinese MABC isolates, categorizing genes into core and accessory groups. The analysis revealed a total pan-genome size of 19,830 genes, with 3,994 (20.1%) identified as core genes (>95% prevalence) and 15,836 (79.9%) as accessory genes (Figure 4A). Heaps’ law modeling (n = κNλ) of the gene presence-absence matrix produced a γ value of 0.53, indicating an open pan-genome (Vernikos et al., 2015). This suggests that the pan-genome continues to expand as new genes are introduced, without reaching saturation.
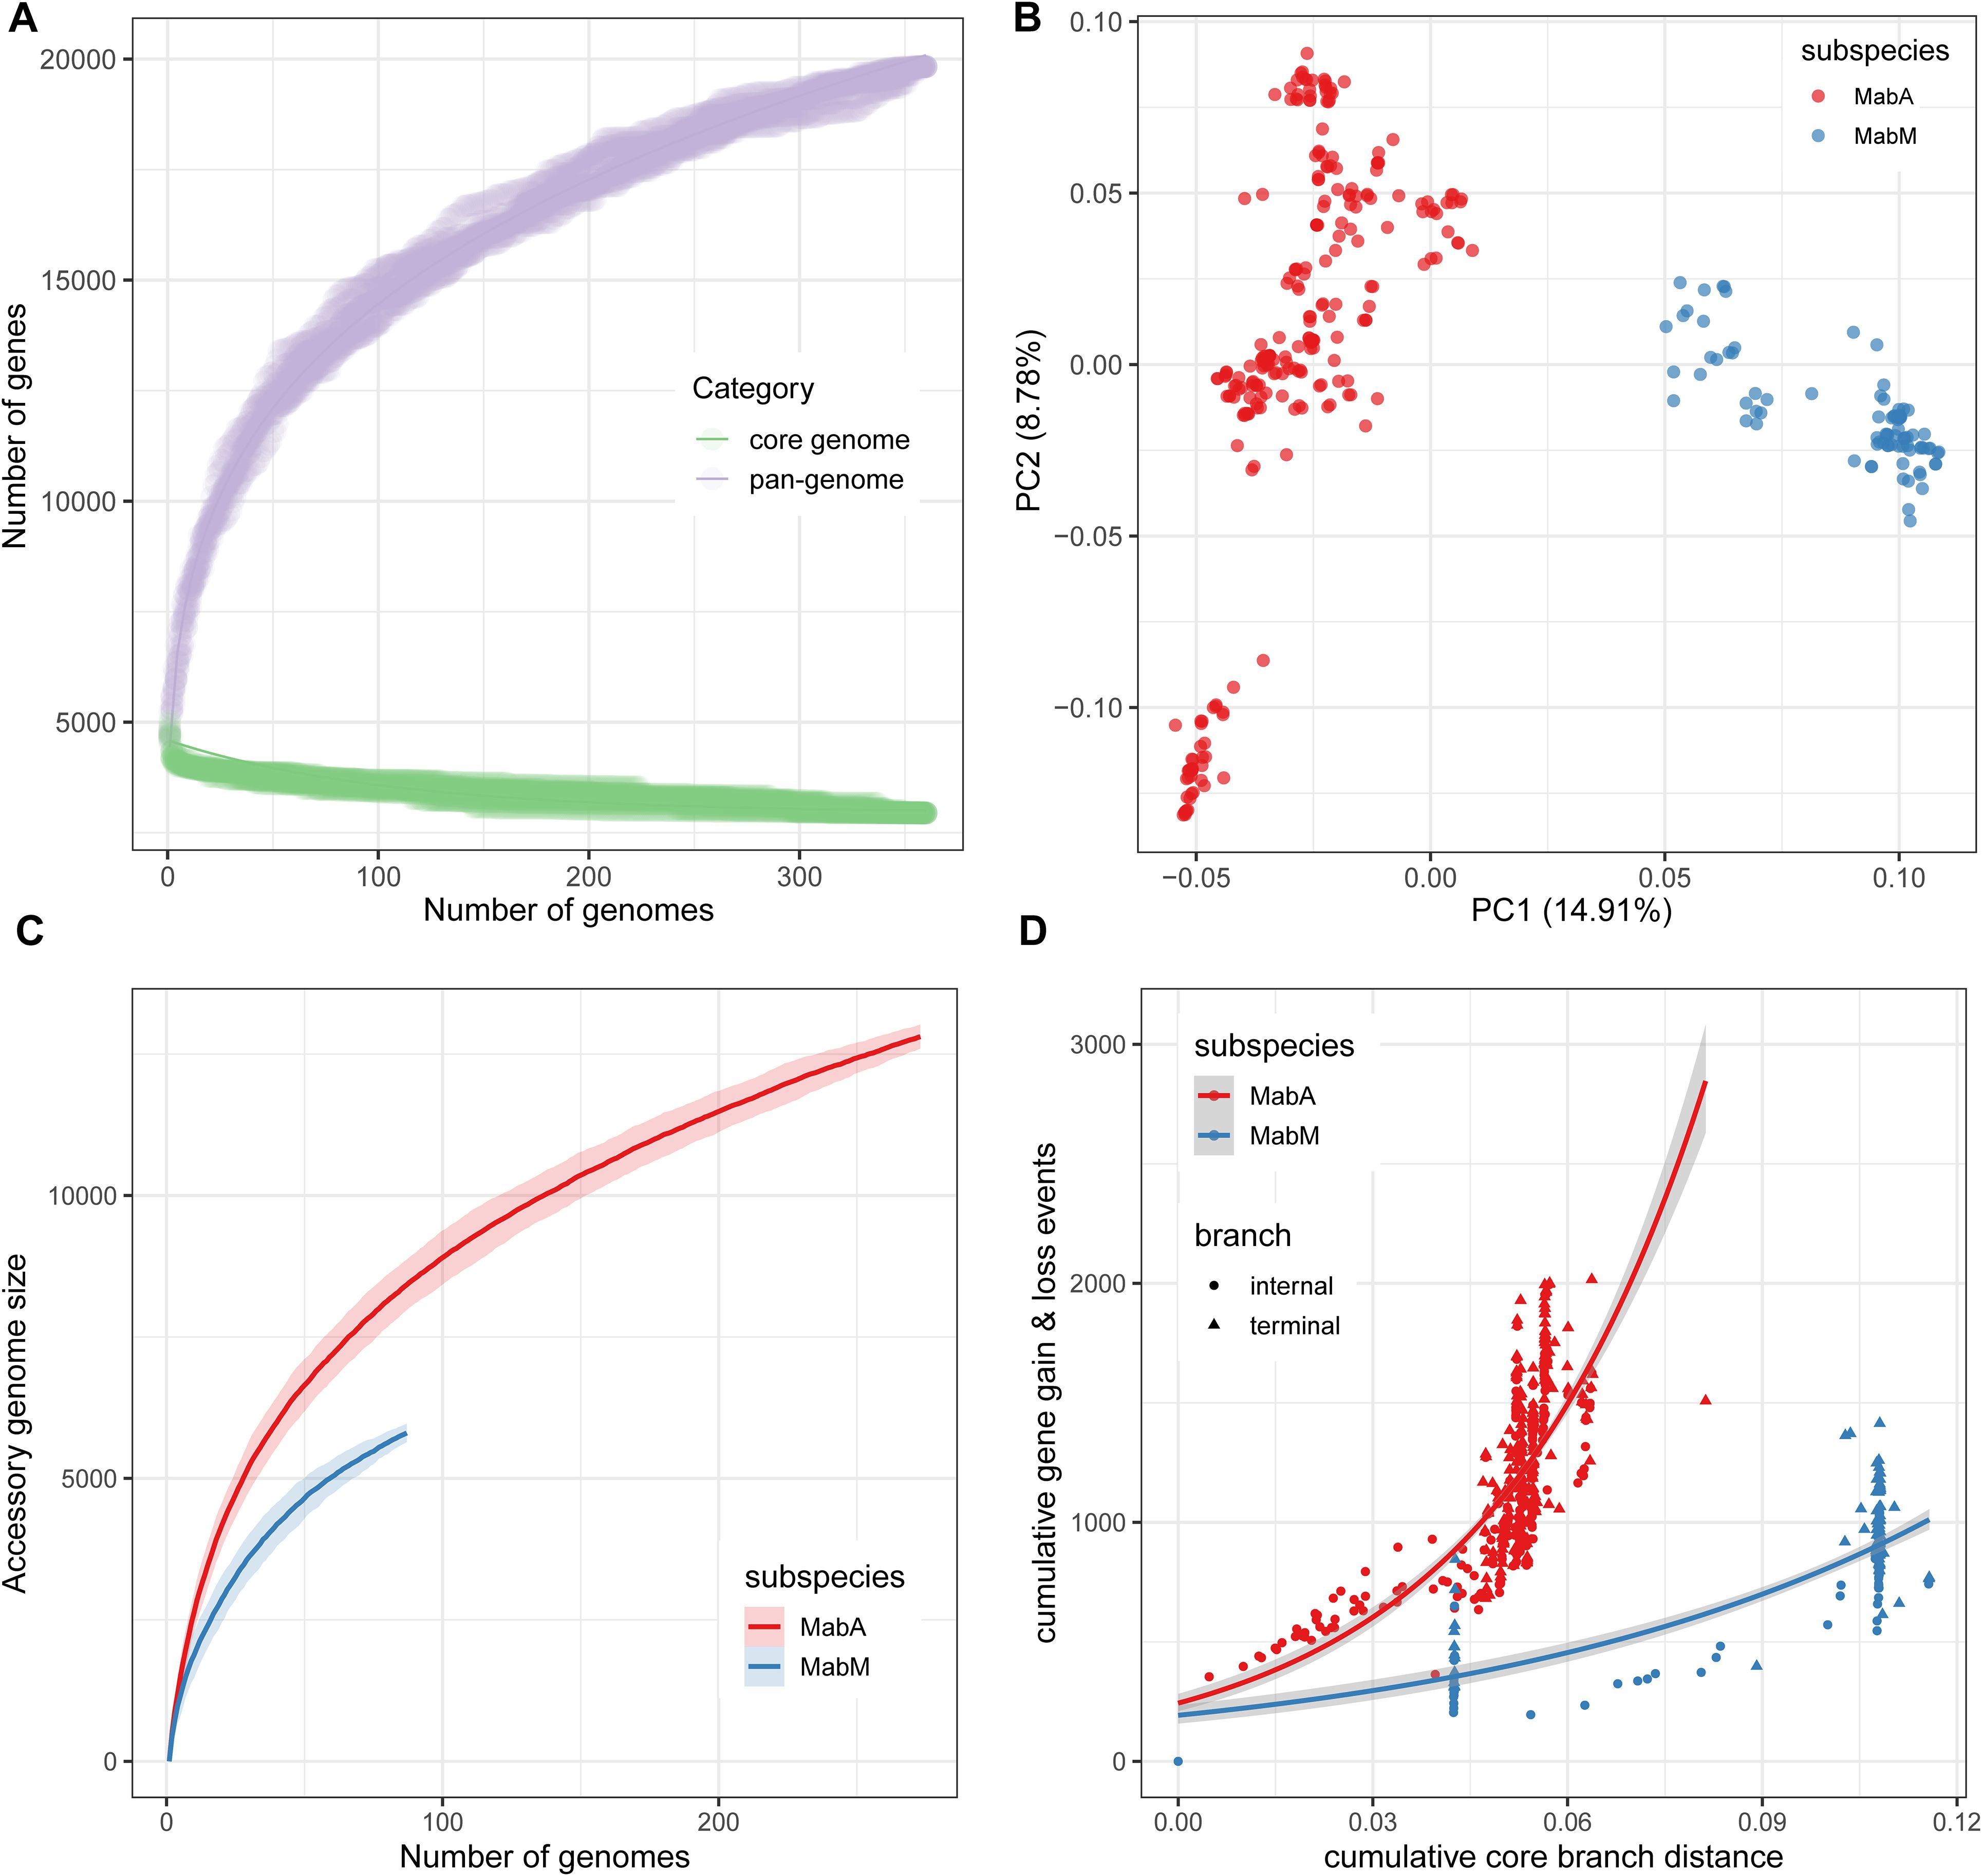
Figure 4. Characteristics of the Chinese MABC pan-genome. (A) Growth curves of the core and pan-genome of 360 MABC genomes. (B) Two-dimensional PCA visualization of the MABC pan-genome. (C) Growth curves of the accessory genomes for both MabA and MabM. (D) The cumulative number of gene gain and loss events plotted against the cumulative branch length from the root node of each tree for MabA and MabM. Internal branches are represented by circles, and terminal branches by triangles.
Principal component analysis (PCA) based on gene presence-absence data showed a clear separation between MabA and MabM genomes (Figure 4B), consistent with their subspecies classification derived from cgSNP-based phylogenetic analysis. The diversity in accessory genes was higher in MabA compared to MabM for a similar number of strains, highlighting greater genetic flexibility of MabA (Figure 4C). Despite this, the core genomes of MabA and MabM were similar, consisting of 4,141 and 4,067 genes, respectively. Further analysis using Panstripe, based on the cgSNP-based phylogeny and gene presence-absence matrix, revealed significantly higher rates of gene gain and loss in MabA compared to MabM (P-value = 1.29e−5). Notably, these gene gain and loss events were predominantly clustered in the more ancestral branches of the phylogenies for both subspecies (Figure 4D).
3.6 Distribution of MGEs in MABC genomesWe identified a total of 45 plasmids across 39 genomes. Among these, two genomes harbored three plasmids each, another two genomes contained two plasmids each, and the remaining 35 genomes each contained one plasmid (Supplementary Table S4). These plasmids were categorized into nine MOB-clusters (AA558, AB922, AB951, AE904, AG074, AG676, AG677, AG701, AG806), with AA701 being the most common (64.4%, n=29). Among them, three clusters (AA558, AE904, AG701) were predicted to be mobilizable due to the presence of either a relaxase or an oriT, but lacked the mate-pair formation marker. Furthermore, 125 ICEs were detected in 111 genomes, with each genome containing between 1 and 3 ICEs. Among them, 84% (n=105) belonged to Mab2101 of AICE. Notably, no ARGs or VFs were found on these plasmids or ICEs.
We uncovered 783 prophage sequences in 288 genomes, with each genome containing between 1 and 7 prophages, ranging in length from 0.66 kb to 210.9 kb. Taxonomic classification revealed that the majority of these prophages belonged to the Siphoviridae family (n=699), followed by Podoviridae (n=13) and Myoviridae (n=3). Moreover, 700 ISs were predicted in 254 MABC genomes, primarily from the families IS481 (n=110), IS256 (n=85), IS607 (n = 65), and IS21 (n=59). We also identified 1,303 genomic islands (an average of 3.7 ± 1.8 per genome) in 352 genomes, with total lengths per genome ranging from 5.5 kb to 289.5 kb.
3.7 Virulence and antimicrobial resistance genetic profilesAcross the 360 MABC genomes, we identified between 139 to 151 VFs, including 134 core VFs (present in more than 95% of all strains) and 17 accessory VFs (Supplementary Table S5). The accessory VF profiles of MabA and MabM were distinct, particularly in effector delivery systems, immune modulation, regulation, and nutritional/metabolic functions. Notably, immune modulation and nutritional/metabolic VFs displayed specific factors unique to each subspecies: MAB4114 and MAB_3999 in MabA, and MASS_RS20860 and MASS_RS20355 in MabM. The virulence gene mce9D was found in 87.4% (76/87) of MabM isolates but absent in MabA isolates. Similarly, pcaA was present in 67.8% (59/87) of MabM isolates and 2.2% (6/273) of MabA isolates.
In terms of antimicrobial resistance, the macrolide and penam resistance gene mtrA, along with the rifampin resistance-associated gene RbpA, were prevalent across all genomes analyzed (Table 1). The chromosomally encoded β-lactamase blaMAB, which contributes significantly to β-lactam resistance, was found in 349 genomes (Supplementary Table S6). The resistance gene erm(41), associated with resistance to macrolide, streptogramin, and lincosamide, was prevalent only in MabA and absent in MabM. Aminoglycoside resistance-related rrs gene mutations, predominantly n.1408A>G, were identified in 347 isolates, with additional mutations n.1355A>G and n.1375A>G found in 4 MabA isolates. The clarithromycin resistance-conferring rrl gene mutation n.2059A>G was present in 338 genomes, with three MabM strains also harboring the n.2271A>G mutation. Furthermore, fluoroquinolone resistance-related mutations in the gyrA gene (p.95D>G, p.90A>V, p.89D>N) were detected in four MabA isolates.
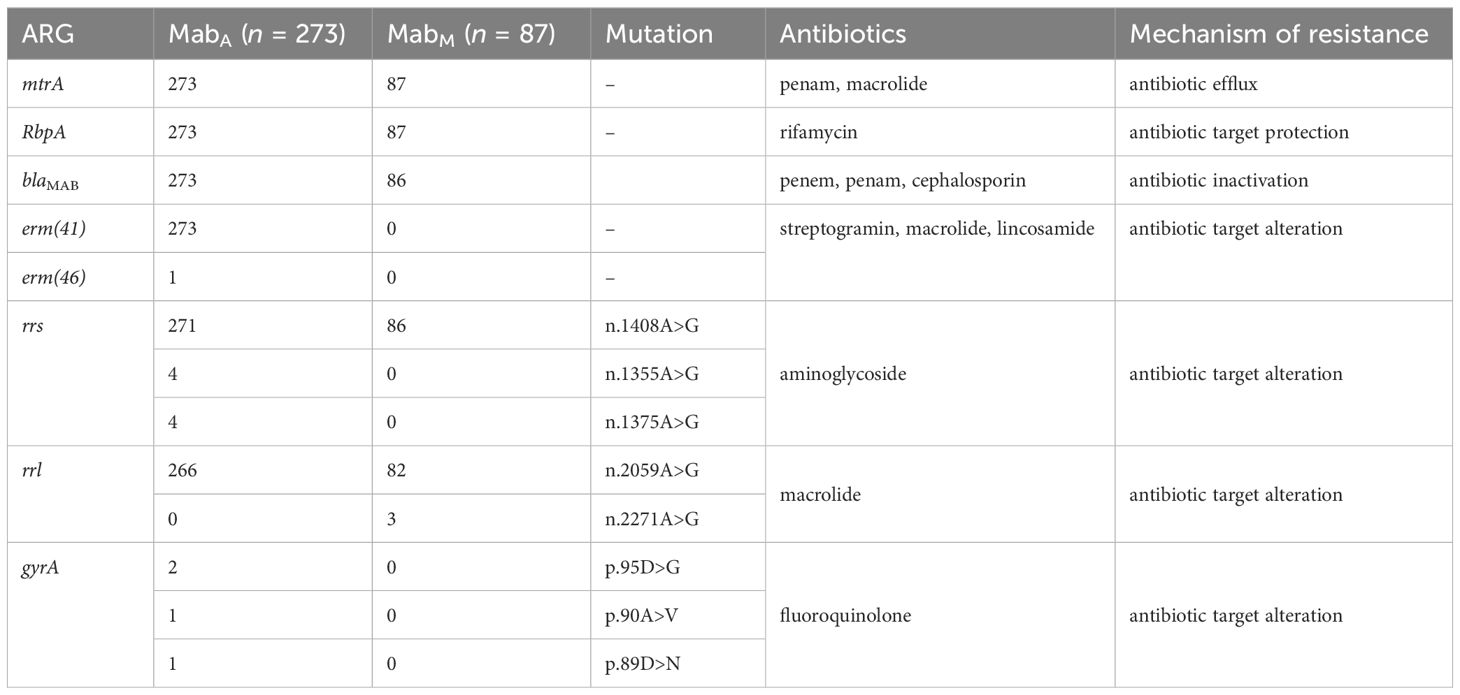
Table 1. Antibiotic resistance genes found among Chinese MABC isolates.
A notable finding was the identification of an acquired antimicrobial resistance gene erm(46), conferring resistance to macrolide, streptogramin, and lincosamide, in one MabA isolate (1322-S0, GenBank: GCA_012845855). A BlastP comparison from NCBI NR database revealed a sequence identity and coverage of 100% with the erm(46) gene from Rhodococcus equi (WP_170092264). This gene was located on a 19.2-kb Siphoviridae prophage in MabA 1322-S0 (Figure 5), suggesting that MabA 1322-S0 may have acquired erm(46) through phage-mediated horizontal gene transfer (HGT).
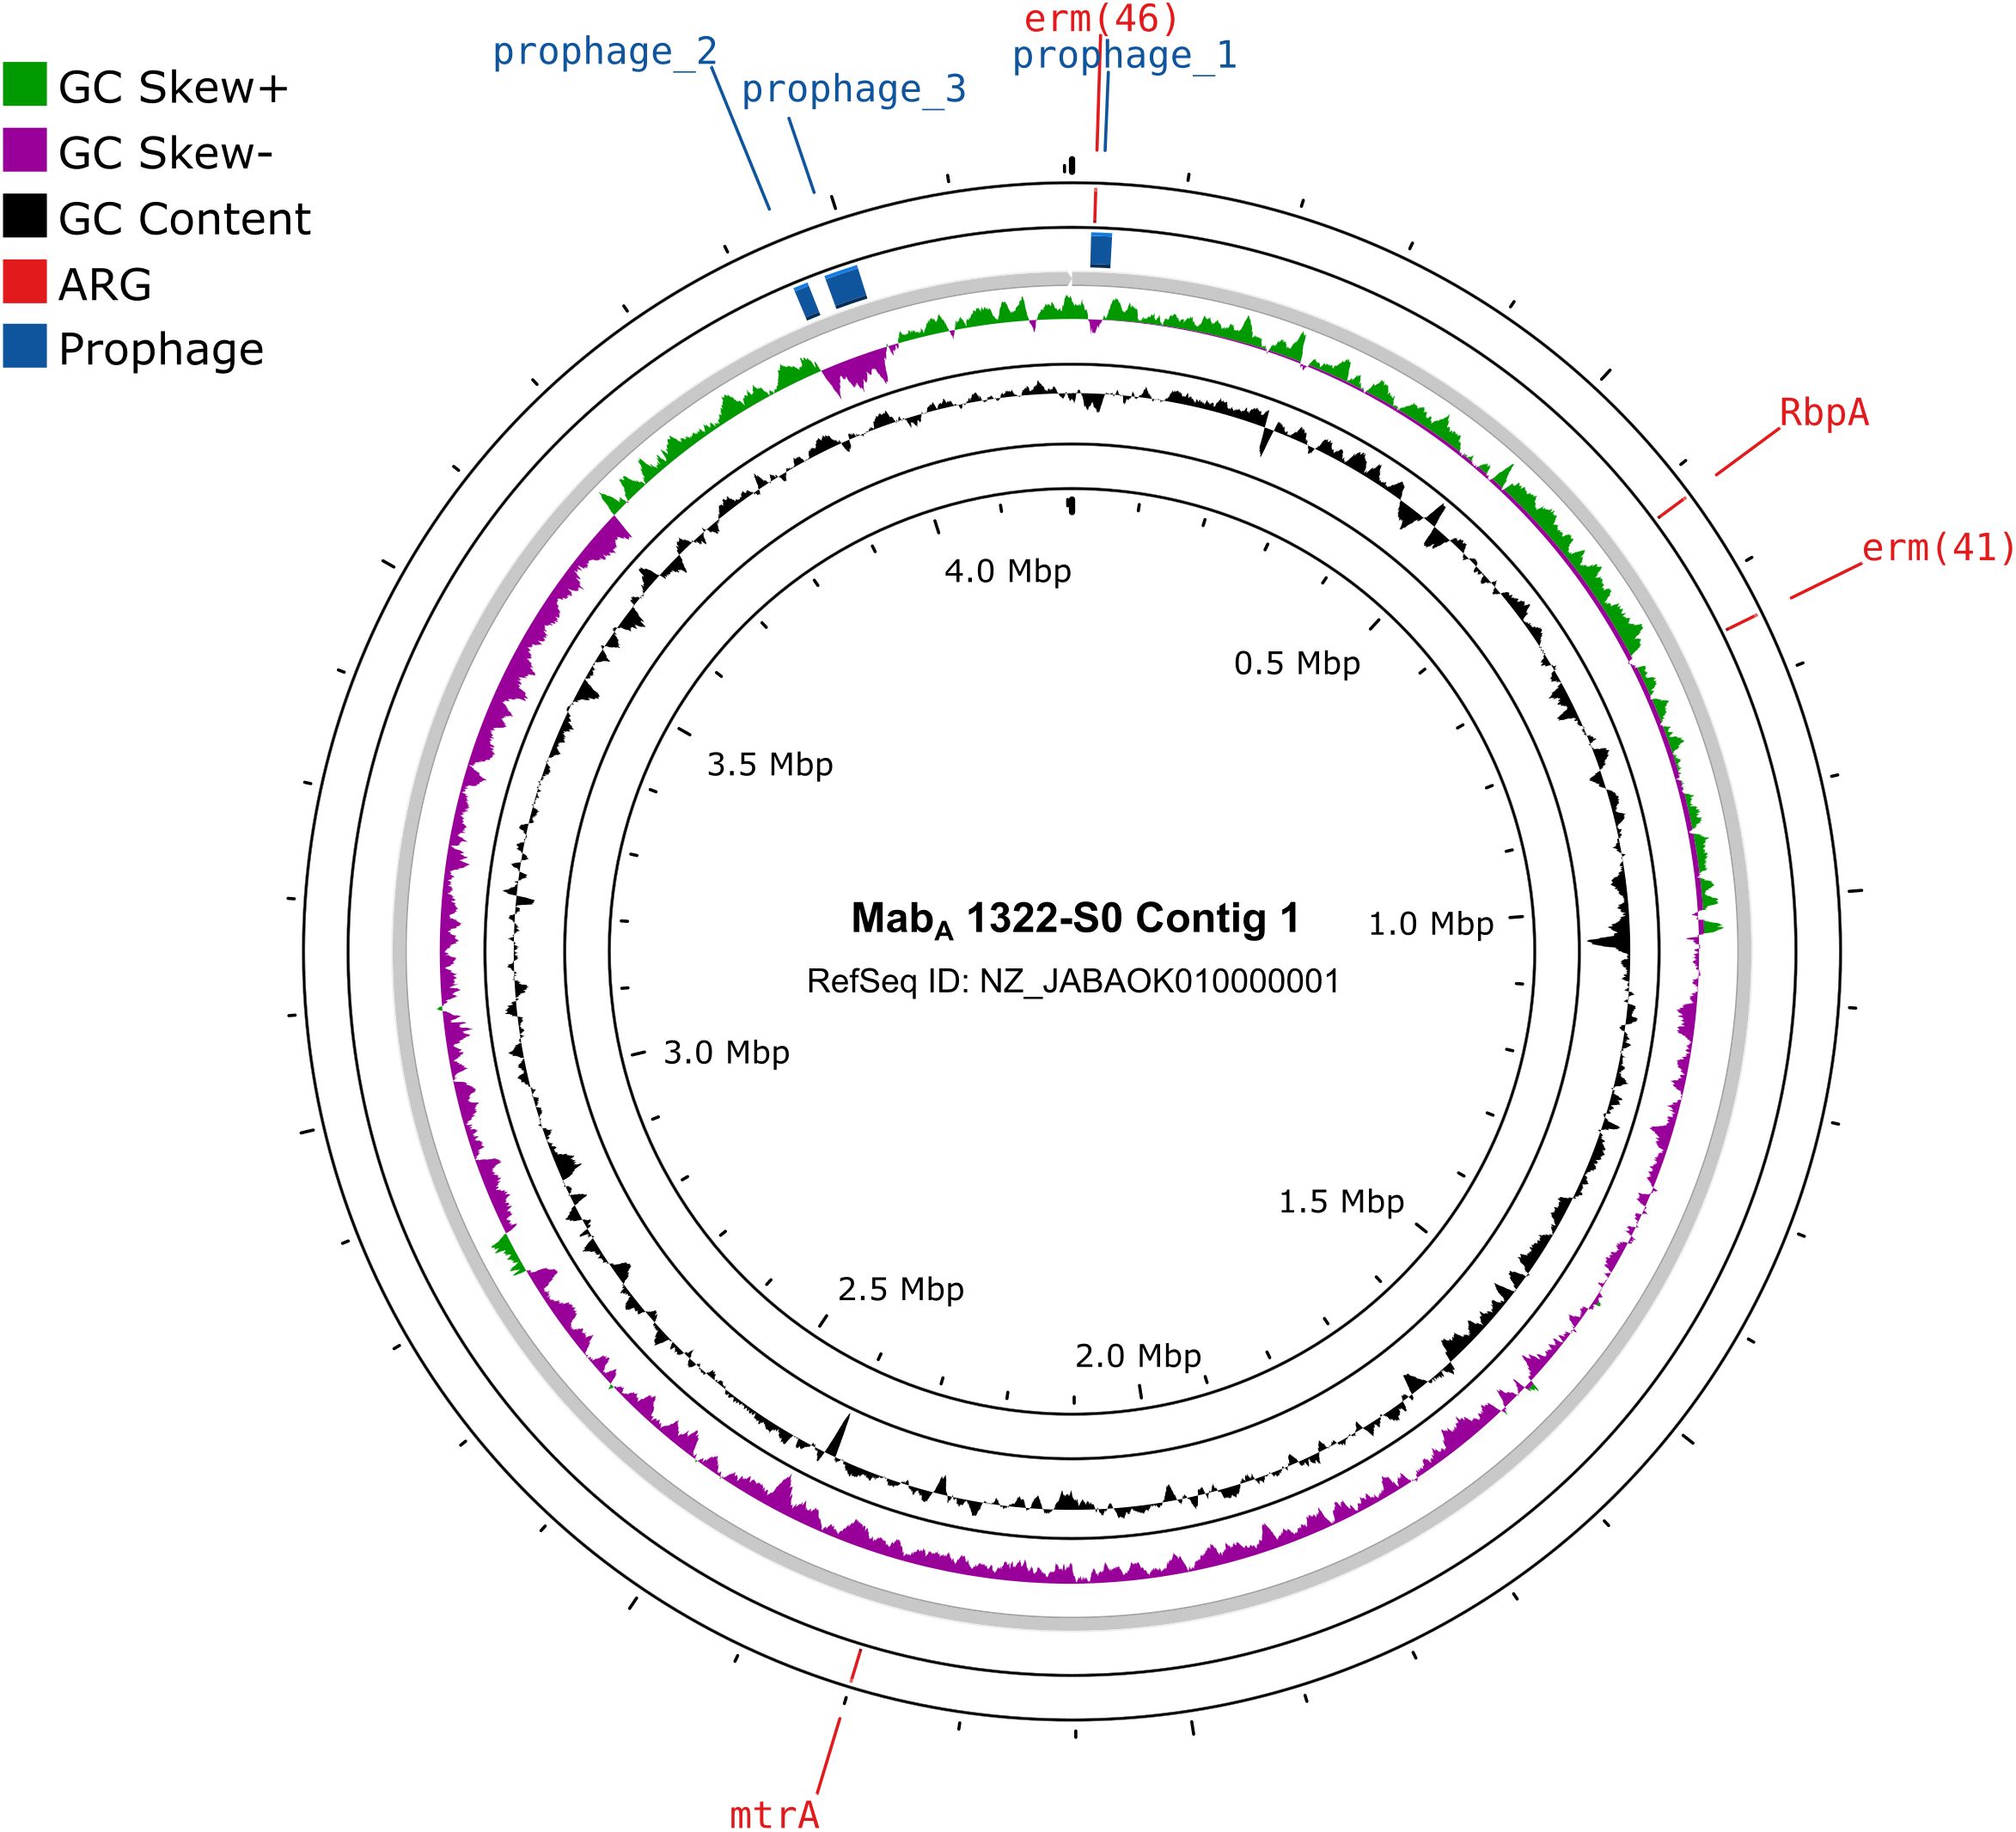
Figure 5. Circular representation of the MabA 1322-S0 contig 1. The circles in the plot, from the inside to the outside, represent genomic GC Content, genomic GC Skew, prophages and ARGs.
4 DiscussionThis study provides critical insights into the population genetics, recent transmission, and pan-genome of the MABC in China. Our comprehensive analysis of 360 public MABC genome assemblies, collected from eight provinces and municipalities across the country, reveals a high degree of genetic diversity and complex patterns of clonal transmission. These results underscore the importance of continuous surveillance and molecular characterization of MABC to better understand its spread, particularly in clinical settings.
ANI-based genotyping is effective for closely related bacterial strains due to its high accuracy but can be biased by incomplete genomes or size differences. In this study, we ensured accurate genotyping by applying strict quality control (genome completeness >98%, contamination<5%). Using an ANI threshold of 98%, we clearly distinguished between the MabA and MabM subspecies, with MabA comprising 75.8% of the isolates and MabM 24.2%. This subspecies distribution aligns with previous studies, which also report MabA as the more prevalent subspecies globally (Ruis et al., 2021). Phylogenetic analysis based on cgSNPs revealed significant evolutionary differences between MabA and MabM, with MabM isolates exhibiting longer terminal branch lengths, suggesting a slower evolutionary rate or a more recent common ancestor. This finding is consistent with earlier research indicating that MabM is genetically distinct from MabA and may have a different evolutionary trajectory (Commins et al., 2023). The shorter branch lengths observed in MabA isolates may reflect a higher rate of transmission or adaptation to clinical environments (Ruis et al., 2021).
Our findings, consistent with previous studies, revealed genetically distinct MABC isolates, indicated by deep branches in the phylogenetic tree. Additionally, we identified highly similar MabA and MabM isolates, known as DCCs, which are globally distributed yet lack established epidemiological connections (Lipworth et al., 2021; Wetzstein et al., 2022; Olawoye et al., 2024). The proportion of DCCs in China (33.3%) is lower than in other regions of the world, such as the United States, the United Kingdom, Australia, and Malaysia, where the proportion of DCCs exceeds 50%, and in Brazil, where it reaches 100% (Davidson et al., 2013; Ruis et al., 2021). This suggests that MABC infections in China are more likely to be caused by environmentally acquired isolates, highlighting the complexity of the MABC infections in China.
Nevertheless, the detection of multiple DCCs, particularly in isolates from a single hospital in Shanghai, suggests the persistence and potential reintroduction of MABC strains over time. Given that this hospital is a major center for tuberculosis treatment in Eastern China, it likely serves patients from across the country, enhancing its national representativeness in the management of pulmonary infections in China. These findings reinforce the need for stringent infection control measures and regular genomic surveillance to prevent and manage NTM infections across China. Moreover, the identification of genomic clusters involving isolates from China and several other countries, including the UK and the USA, suggests that MABC strains may be circulating globally, likely facilitated by international travel and medical tourism (Pavli and Maltezou, 2021). This observation aligns with previous studies that have identified similar global transmission patterns in other pathogenic bacteria, such as M. tuberculosis (Merker et al., 2015).
This study revealed a 49.4% genomic clustering rate for MABC isolates in China, which is slightly lower than the 60% reported in the UK study and the 54.6% observed in the German study (Lipworth et al., 2021; Wetzstein et al., 2022). Additionally, we detected genomic clusters linking Chinese isolates with international strains from seven other countries, highlighting cross-national transmission (Diricks et al., 2022a). In contrast, the German study found that German isolates did not group with international strains, except within DCCs, indicating more localized transmission within Germany (Wetzstein et al., 2022). The UK study, which reported a higher clustering rate, suggested substantial recent transmission and widespread genomic clusters across a large geographical area, though it noted that person-to-person transmission in healthcare settings was not a major factor (Lipworth et al., 2021). However, these findings do not rule out the possibility of transmission in community or social settings, or from shared environmental sources within the hospital. A recent study by Commins et al. indicated that altered DNA repair and a slower mutation rate may have evolved at the base of each DCC clade, linking them to the human host (Commins et al., 2023). Therefore, the genomic study of more environmental isolates will enhance our understanding of MABC genomic diversity in its natural habitats and shed light on the behavior of environmental mycobacteria—and likely other environmental bacteria—in relation to disease causation and potential transmission to humans (Harrison and Behr, 2023).
Population genetic analysis showed that MabA has higher nucleotide diversity, and a greater rate of gene gain and loss compared to MabM, suggesting more frequent genetic changes, possibly due to higher recombination rates or a broader ecological niche. The negative Tajima’s D values for MabA indicate an excess of low-frequency polymorphisms, hinting at recent population expansion or purifying selection, while the neutral values for MabM suggest a more stable population. Furthermore, although recombination events are less frequent than mutations, they significantly impact genetic diversity. The R/m ratio of 2.02 shows that recombination has a greater influence on MABC genomic diversity than mutation alone, consistent with findings in other free-living bacteria, such as Bacillus cereus (R/m = 2.37) (Didelot et al., 2010). For comparison, the R/m ratio in M. tuberculosis strains varies from 0.426 to 0.565, and M. bovis has an R/m ratio of 0.98 (Namouchi et al., 2012; Patane et al., 2017). This genetic flexibility likely enhances MABC’s adaptability and persistence in diverse environments, including clinical settings (Bryant et al., 2021).
The antimicrobial resistance profiles of MabA and MabM in this study reveal distinct therapeutic challenges. erm(41), conferring macrolide resistance, was exclusive to MabA strains, while MabM strains showed macrolide resistance through rrl mutations (n.2059A>G in most genomes and n.2271A>G in three). The aminoglycoside resistance-associated rrs mutation n.1408A>G was prevalent in both subspecies, but additional mutations (n.1355A>G, n.1375A>G) were limited to MabA. Fluoroquinolone resistance-associated gyrA mutations (p.95D>G, p.90A>V, p.89D>N) were unique to MabA, indicating its higher resistance potential and raising concerns given the importance of fluoroquinolones in treating mycobacterial infections. (Kim et al., 2018). Universally detected resistance genes, including blaMAB, RbpA, and mtrA, further underscore the multidrug resistance in both subspecies. These findings align with the high rates of antimicrobial resistance observed clinically, complicating treatment regimens in China, which rely on aminoglycosides, carbapenems, tigecycline, and macrolides (Chen et al., 2019; Griffith, 2019). MabA’s broader resistance profile underscores the need for subspecies-specific surveillance and tailored therapy to combat MABC infections effectively.
The pan-genome analysis revealed a highly open pan-genome, with 79.9% of genes classified as accessory. The open nature of the MABC pan-genome suggests ongoing acquisition of new genes, which may contribute to the MABC’s ability to adapt to various environmental and host conditions (Cummins et al., 2022). The higher diversity of accessory genes in MabA compared to MabM, aligns with the observed higher genetic diversity and recombination rates in MabA. This finding is particularly relevant for understanding the virulence and antibiotic resistance mechanisms in MABC, as many accessory genes are likely involved in these processes (Domingo-Sananes and McInerney, 2021).
Based on our findings and previous research, the mobilome in MABC likely contributes to the strain’s genetic diversity (Dedrick et al., 2021). We identified 45 plasmids across 39 genomes, which were categorized into nine MOB clusters, with AA701 being the most prevalent. Three clusters (AA558, AE904, and AG701) were predicted to be mobilizable, suggesting potential HGT. However, no ARGs or VFs were found on these plasmids or ICEs, indicating that these MGEs may not play a primary role in resistance or virulence in MABC. This finding is consistent with recent studies showing that while MABC carries abundant and diverse prophages and plasmids, these elements are more associated with genetic diversity rather than directly driving pathogenicity or resistance (Dedrick et al., 2021; Jin et al., 2022). Specifically, we detected 783 prophage sequences, primarily from the Siphoviridae family, which could influence virulence through toxin-immunity systems (Dedrick et al., 2021). Additionally, the presence of over 700 ISs may drive genetic rearrangements and contribute to MABC’s adaptability. Overall, the mobilome in MABC is a significant factor in genetic diversity and may provide insight into its evolution and potential therapeutic targets.
Notably, the detection of the erm(46) gene, associated with macrolide resistance, on a prophage in MabA 1322-S0 is particularly concerning, as it suggests that MABC can acquire resistance genes through phage-mediated HGT (Bryant et al., 2021). A recent study reported a novel plasmid-mediated 23S rRNA methylase gene, erm(55), which causes high-level inducible macrolide resistance in M. chelonae and has spread to other rapidly growing mycobacteria (Brown-Elliott et al., 2023). This finding adds to the growing body of evidence that highlights the role of prophages in the evolution of antibiotic resistance in Mycobacteria.
Our study, while comprehensive, has limitations. First, only the public genomic data was used, which is largely biased and commonly not well-curated. Second, the absence of environmental samples and detailed patient clinical information in our study limits the full contextualization of the molecular epidemiology results. Additionally, the MABC genomes we collected include only MabA and MabM, but this does not suggest that MabB infections are absent in China. Including more geographically diverse samples, particularly global isolates, could reveal additional mixed China-global clusters and provide a clearer understanding of MABC’s global transmission dynamics. Future studies should include detailed clinical data to improve analysis robustness. Third, no experimental evidence was provided to confirm the drug resistance and horizontal gene transfer potential inferred from genomic data.
5 ConclusionThis study offers crucial insights into the genetic diversity, recent transmission, and resistance profiles of MABC in China. Our findings reveal significant genetic variation between the MabA and MabM subspecies, with MabA showing greater diversity and higher rates of gene gain and loss. The presence of multiple DCCs and genomic clusters containing both Chinese and global isolates highlights both local persistence and global spread of MABC. Additionally, the detection of widespread antibiotic resistance genes and mobile genetic elements, including the novel erm(46) gene, underscores the adaptability of MABC and the urgent need for novel therapeutic strategies. These results emphasize the importance of continued genomic surveillance and robust infection control measures to effectively manage and combat MABC infections.
Data availability statementThe original contributions presented in the study are included in the article/Supplementary Material. Further inquiries can be directed to the corresponding author/s.
Author contributionsXL: Conceptualization, Data curation, Formal analysis, Funding acquisition, Investigation, Methodology, Project administration, Resources, Software, Supervision, Validation, Visualization, Writing – original draft, Writing – review & editing. YZ: Conceptualization, Data curation, Formal analysis, Funding acquisition, Investigation, Methodology, Project administration, Resources, Software, Supervision, Validation, Visualization, Writing – original draft, Writing – review & editing. YL: Writing – original draft, Writing – review & editing. KW: Writing – original draft, Writing – review & editing. YC: Funding acquisition, Investigation, Methodology, Project administration, Writing – review & editing. XW: Writing – original draft, Writing – review & editing. WW: Writing – original draft, Writing – review & editing. JunlG: Writing – original draft, Writing – review & editing. JunsG: Writing – original draft, Writing – review & editing. ZL: Conceptualization, Data curation, Formal analysis, Funding acquisition, Investigation, Methodology, Project administration, Resources, Software, Supervision, Validation, Visualization, Writing – original draft, Writing – review & editing. ZZ: Conceptualization, Data curation, Formal analysis, Funding acquisition, Investigation, Methodology, Project administration, Resources, Software, Supervision, Validation, Visualization, Writing – original draft, Writing – review & editing.
FundingThe author(s) declare that financial support was received for the research, authorship, and/or publication of this article. This research was supported by National Natural Science Foundation of China (No. 82373649) and Ningbo Public Welfare Science and Technology Program Project (No.2024S040).
Conflict of interestThe authors declare that the research was conducted in the absence of any commercial or financial relationships that could be construed as a potential conflict of interest.
Publisher’s noteAll claims expressed in this article are solely those of the authors and do not necessarily represent those of their affiliated organizations, or those of the publisher, the editors and the reviewers. Any product that may be evaluated in this article, or claim that may be made by its manufacturer, is not guaranteed or endorsed by the publisher.
Supplementary materialThe Supplementary Material for this article can be found online at: https://www.frontiersin.org/articles/10.3389/fcimb.2024.1496896/full#supplementary-material
Supplementary Table 1 | Metadata for all 360 Chinese MABC genomes.
Supplementary Table 2 | Subspecies identification results of all MABC strains and their ANI value to the three subspecies reference genomes.
Supplementary Table 3 | cgMLST detection of MABC strains. (A) DCC detection results using a threshold of 250 AD; (B) Genomic clustering results of Chinese strains with a threshold of 25 AD; (C) Genomic clustering results of Chinese and global strains with a threshold of 25 AD; (D) Metadata of clustered global MABC genomes from BV-BRC database.
Supplementary Table 4 | Detection results of MGEs in all Chinese MABC genomes, including plasmids, prophages, ISs, genomic islands, and ICEs.
Supplementary Table 5 | Detection results of VFs in all Chinese MABC genomes.
Supplementary Table 6 | Detection results of ARGs and resistance-conferring mutations in the genomes of all Chinese MABC strains.
Supplementary Figure 1 | Characteristics of subtrees for MabA and MabM genomes. (A) Distribution of terminal branch lengths and (B) pairwise SNP distances within the MabA and MabM phylogeny. **** represents Wilcoxon rank sum test P < 0.0001. (C) Proportion of MabA and MabM isolates belonging to clusters (y-axis) defined by varying thresholds of maximum pairwise SNP distances (x-axis).
ReferencesAlcock, B. P., Huynh, W., Chalil, R., Smith, K. W., Raphenya, A. R., Wlodarski, M. A., et al. (2023). CARD 2023: expanded curation, support for machine learning, and resistome prediction at the Comprehensive Antibiotic Resistance Database. Nucleic Acids Res. 51, D690–D699. doi: 10.1093/nar/gkac920
PubMed Abstract | Crossref Full Text | Google Scholar
Biguenet, A., Bordy, A., Atchon, A., Hocquet, D., Valot, B. (2023). Introduction and benchmarking of pyMLST: open-source software for assessing bacterial clonality using core genome MLST. Microbial Genomics 9 (11). doi: 10.1099/mgen.0.001126
PubMed Abstract | Crossref Full Text | Google Scholar
Brown-Elliott, B. A., Wallace, R. J., Wengenack, N. L., Workman, S. D., Cameron, A. D. S., Bush, G., et al. (2023). Emergence of Inducible Macrolide Resistance in Mycobacterium chelonae Due to Broad-Host-Range Plasmid and Chromosomal Variants of the Novel 23S rRNA Methylase Gene, erm (55). J. Clin. Microbiol. 61, e00428–e00423. doi: 10.1128/jcm.00428-23
PubMed Abstract | Crossref Full Text | Google Scholar
Bryant, J. M., Brown, K. P., Burbaud, S., Everall, I., Belardinelli, J. M., Rodriguez-Rincon, D., et al. (2021). Stepwise pathogenic evolution of Mycobacterium abscessus. Science 372, eabb8699. doi: 10.1126/science.abb8699
PubMed Abstract | Crossref Full Text | Google Scholar
Bryant, J. M., Grogono, D. M., Greaves, D., Foweraker, J., Roddick, I., Inns, T., et al. (2013). Whole-genome sequencing to identify transmission of Mycobacterium abscessus between patients with cystic fibrosis: a retrospective cohort study. Lancet 381, 1551–1560. doi: 10.1016/S0140-6736(13)60632-7
PubMed Abstract | Crossref Full Text | Google Scholar
Bryant, J. M., Grogono, D. M., Rodriguez-Rincon, D., Everall, I., Brown, K. P., Moreno, P., et al. (2016). Emergence and spread of a human-transmissible multidrug-resistant nontuberculous mycobacterium. Science 354, 751–757. doi: 10.1126/science.aaf8156
留言 (0)