Cancer immunotherapy (CIT) has recently drawn remarkable attention by showing its ability to improve the overall survival in the clinic (1) and has led to the approval of more than 40 drugs by health authorities (2). Various classes of therapeutic agents exist in this area and share the concept of enhancing the existing anti-tumor immunity to eradicate malignant cells (3). One approach is to use synthetic immunity by redirecting the T-cells against the tumor cells (1). T-cell engagers (TCE) are bispecific antibodies (bsAbs) (4) that bind simultaneously to T-cells via the CD3 epsilon chain (CD3) within the T-cell Receptor (TCR) complex and to tumor cells via tumor-associated antigen (TAA) (5). The crosslinking of a tumor cell with a T lymphocyte enables the formation of an immunological synapse, similar to that of a natural TCR and peptide–major histocompatibility complex (MHC) complex (6). The synapse formation redirects any engaged T-cells in an inflammatory process (cytokine release, triggering further immune activity) and tumor killing.
TCEs are thus promising anti-tumor therapies but have remaining challenges associated with their clinical safety profiles. The primary toxicities following their administration are immune effector cell-associated neurotoxicity syndrome (ICANS) and cytokine release syndrome (CRS) (7). The latter is generally associated with cytokine release upon T-cell activation (8). Patients experiencing CRS may have a variety of symptoms (9) for which the grading has been defined by the Common Terminology Criteria for Adverse Events (CTC-AE) v5 (10). CRS incidence (grade I or more) in clinical trials of FDA approved bispecific TCEs ranged from 15% to 89% (11).
Strategies are implemented in the clinic to mitigate CRS, such as step-up dosing (SUD) (12), which involves gradually increasing the dose within the same patient until reaching the target dose; the use of a cytokine blockage agent (e.g. Tocilizumab (13), an anti-IL6 antibody) (14) or the use of corticosteroids (e.g. Dexamethasone) (15). In addition, in vitro data suggest that SUD can be used as a prophylactic method to prevent CRS in the clinical setting (16). Selection of the best dosing regimen, particularly in the context of SUD, is currently based on empirical methods. Mathematical models, including the proposed mechanistic PKPD model, can be used to inform dosing regimen selection and have the potential to reduce both the length of dose escalation trials and the empirical explorations of dose and schedule.
Some mathematical models predicting cytokine release after TCE administration have been previously published (17–19). Those models describe the decrease in cytokine release observed upon repeated TCE administration as a consequence of previous target cell depletion. The model from Chen and colleagues (19) additionally assumes that cytokines, once released, inhibit the release of new cytokines via a negative feedback loop. The hypothesis that the loss of cytokine release is a consequence of the T-cell killing of target cells was refuted by the work of Li et al. (16). They demonstrated in vitro that, when a second TCE stimulation was done seven days after the first one, lower levels of cytokines were associated with the second dose versus the first one while cytotoxic activity was conserved. This was observed despite the in vitro system being re-supplemented with fresh tumor cells prior to the second stimulation. Alternatively, the pool model proposed by Movin-Osswald and Hammarlund-Udenaes (20) could provide another hypothesis for the reduction in cytokine release following two TCE administrations. The original pool model assumes the existence of an initial reservoir (a pool) of available prolactin (PRL) that is depleted upon remoxipride administration, thus preventing subsequent releases upon multiple dosing until the pool has been replenished. Although this approach has not been previously applied within the context of CRS, it could be adapted by considering the cytokines as a similar pool.
Hereby, a hypothesis-driven mechanistic PKPD model is presented with the aim of exploring potential mechanistic insights behind cytokine release upon the two first TCE administrations. The proposed PKPD model expands upon previously published models (17–20) by incorporating evidence from newly available published preclinical data (16). The presented model focuses on predicting cytokine release upon the first two consecutive TCE administrations with varying dosing intervals and uncouples cytokine levels from tumor burden.
Materials and methodsPreclinical literature dataThe PKPD model was developed based on literature preclinical data from Li et al. (16) where mechanisms of cytokine release were investigated. The group performed an in vivo study in which mammary tumor-bearing mice were treated with two subsequent doses of anti-HER2 T-cell Bispecific (0.5mg/kg) at different dosing intervals (administrations at day 0 and day 1; day 0 and day 7; day 0 and day 14; day 0 and day 21 or day 0 and day 28). Systemic cytokine release (interleukin-6, IL6) was monitored two hours after each treatment. Published data from Li et al. (16) were digitized using WebPlotDigitizer (21) and are available in the appendix section (Supplementary Table S1).
PKPD model developmentA mechanistic PKPD model was built using a bottom-up approach including the main biological players involved in cytokine release: TCE, tumor cells, T-cells and interleukins. The model (Figure 1) assumed that upon TCE exposure, T-cells are activated and transition through different states in which they can trigger cytokine release and kill tumor cells, as supported by (22). The dynamics of the different entities were modeled using ordinary differential equations (ODE) describing the mass balance between the synthesis, transition and degradation or apoptosis processes and implemented using zero-, first- or second-order rate constants. Michaelis-Menten or Hill kinetic functions were also implemented to account for saturation processes. Given the limited available pre-clinical data to build the model, parameters could not be estimated. Model parameters characterizing the above mentioned processes were taken from literature or fine tuned (calibrated) to describe the available data of in vivo IL6 (16). Some parameters had to be borrowed from human references to simulate the PKPD model in mice.
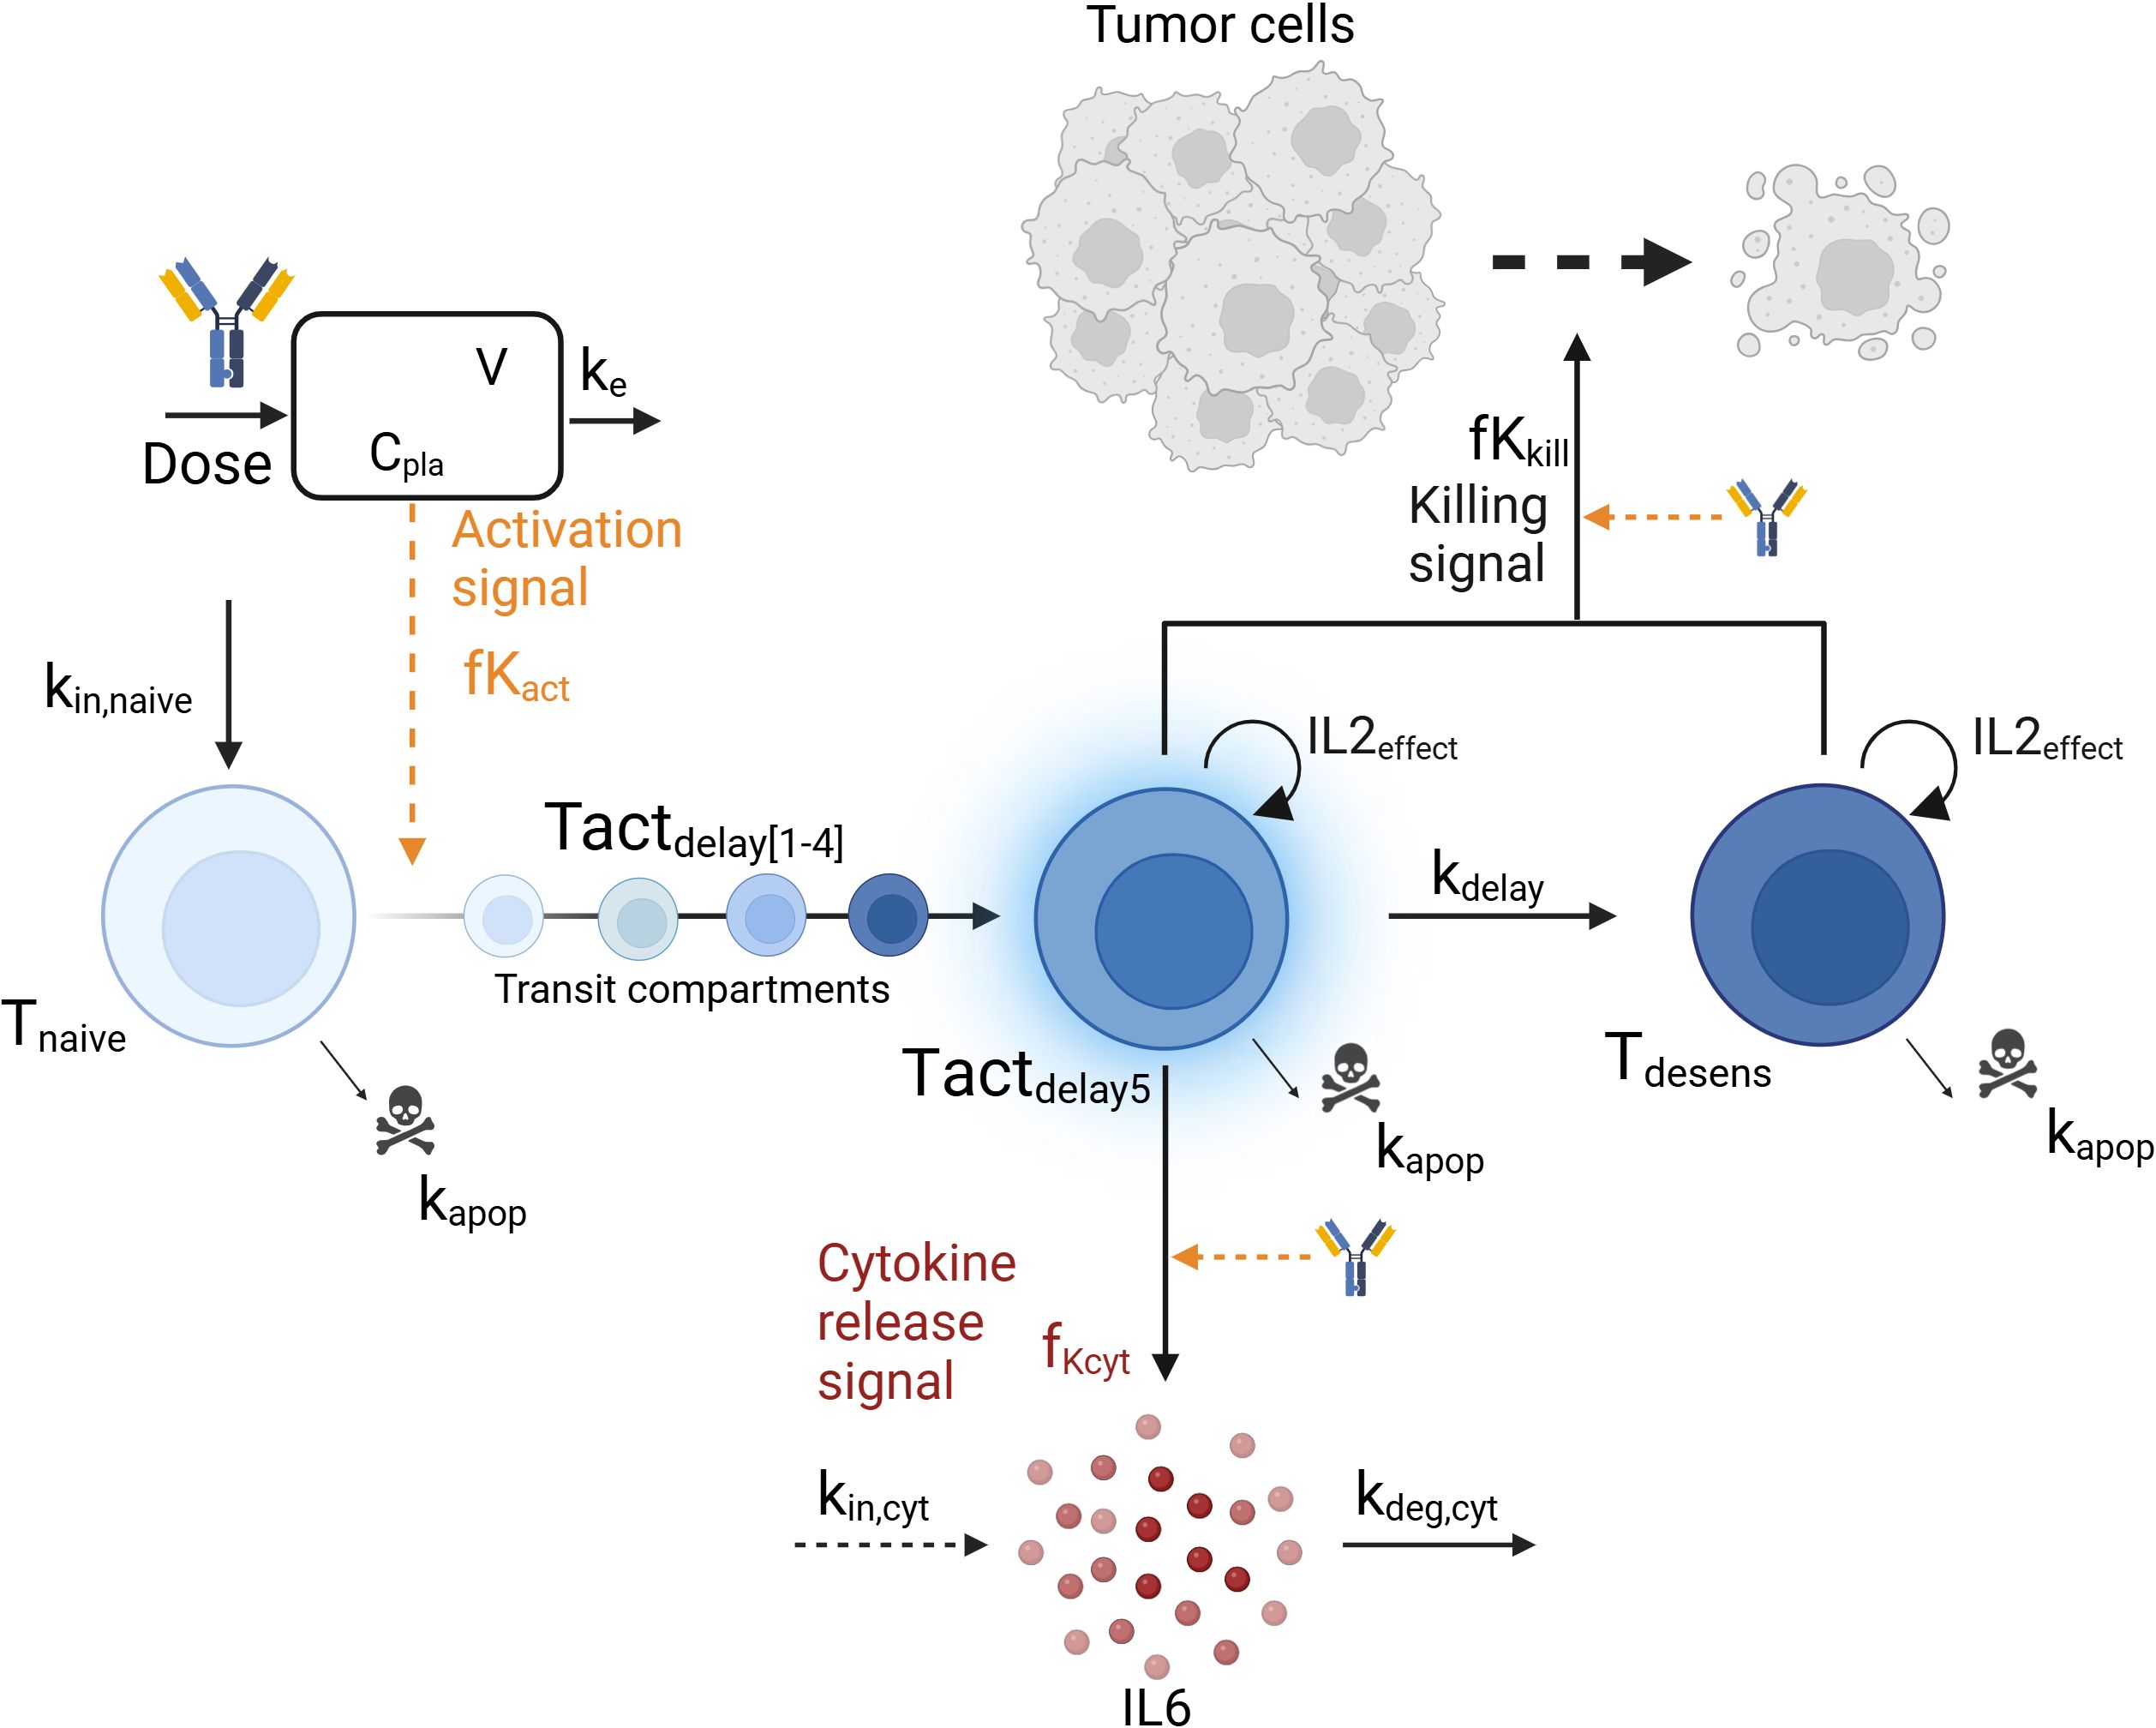
Figure 1. Graphical representation of the mechanistic pharmacokinetic/pharmacodynamic (PK/PD) model. The model describes the T-cell engager (TCE) plasma concentration (Cpla) and its impact on the transition from naive T-cells (Tnaive) to activated T-cells (Tact), leading to cytokine release (IL6) and tumor cell killing. Biological entities and parameters are described in the text.
Model evaluation and explorationModel performance was graphically assessed by confronting model predictions to the in vivo digitized data from (16). The unique IL6 sample (two hours following TCE administration) was assumed to be reflective of the maximum IL6 levels (23). In addition, the cytokine release and killing functions were explored under different relevant dosing scenarios to understand the behavior of the system (same dose levels, 0.5mg/kg, and different dosing intervals). Predictions from the PKPD model were also compared to simulations derived from a simpler model, the pool model from (20), which was repurposed to describe cytokine release (Appendix). Lastly, a parameter sensitivity analysis was performed to evaluate the effects of varying each parameter individually (+/- 20%) (24) on the ratio of maximum cytokine release at second TCE administration versus first administration, and identify the most influential parameters. Parameters involved in tumor cell killing were not included in the sensitivity analysis as they have no impact on cytokine release. Model simulations (ODE computations) were conducted in Rstudio version 4.1.3 (25) using the RxODE2 package (26).
ResultsModel descriptionThe structure of the developed mechanistic PKPD model is presented in Figure 1.
PharmacokineticsThe TCE plasma concentration (Cpla) was assumed to follow a 1-compartment PK model characterized by a linear clearance (CL) and distribution volume (V) parameters from a similar anti-HER2 TCE (27) (Equation 1). Initial drug concentration prior to dosing, Cpla(t=0), is equal to zero.
dCpladt= −CLV×Cpla(1)T-cell dynamicsThree T-cell states were included in the model: baseline naive T-cells (Tnaive), activated T-cells (Tact) and desensitized T-cells (Tdesens). Baseline naive T-cells (Equation 2) are activated upon TCE exposure as follow:
dTnaivedt=kin,naive −(kapop+fKact)×Tnaive(2)Tnaive(t=0)= kin,naive kapopwhere kin,naive and kapop are the zero and first-order rate constants for baseline naive T-cells input and apoptosis, respectively. At baseline, the amount of naive T-cells Tnaive(t=0) is given by kin,naive/kapop. The activation signal, fKact, described in Equation 3 follows an Emax -like relationship with respect to the TCE plasma concentration, characterized by a Hill coefficient hact, a maximum activation signal Emax,act and an EC50act, which is the TCE concentration required to reach half of maximal T-cell activation. As only one dose level (0.5mg/kg) was tested in vivo, the model assumes a complete transfer of the naive T-cells to activated T-cells at the tested dose. The parameter values should be adjusted with more evidence from new experiments.
fKact=Emax,act×(CplahactCplahact+EC50acthact) (3)The transition from baseline naive T-cells to activated T-cells state (Tactdelay) was modeled with 5 transit compartments (Tactdelay1 to Tactdelay5) to account for the lag time between maximum TCE exposure and maximum cytokine level, and is governed by Equations 4, 5. At baseline, no activated T-cells are present and Tactdelay(t=0) = 0. The parameter value for the first-order transit rate constant kdelay between the transit compartments was selected to mimic a delay of a few hours between drug administration and cytokine release (16). Activated T-cells (Tact) undergo apoptosis at the same rate parameter as naive T-cells, kapop (see below).
dTactdelay1dt=fKact×Tnaive−kdelay×Tactdelay1−kapop× Tactdelay1+IL2effect×Tactdelay1(4)dTactdelay5dt=kdelay×(Tactdelay4− Tactdelay5)−kapop× Tactdelay5+IL2effect×Tactdelay5(5)Tactdelay1(t=0)= Tactdelay2(t=0) = Tactdelay3(t=0)= Tactdelay4(t=0)= Tactdelay5(t=0)=0The proliferation of T-cells was assumed to be associated with an IL2 cytokine release upon TCE activation, as IL2 secreted by T-cells binds to T-cell receptors and induces their clonal proliferation (28). An IL2effect variable was therefore introduced (Equations 4, 5) mimicking an autocrine loop for T-cell proliferation in presence of IL2 as follow:
IL2effect=kIL2×(1−Imax×(E:T)hIL2(E:T)hIL2+EC50E:T,IL2 hIL2)(6)where kIL2 is the maximum proliferation rate parameter of T-cells induced by IL2. In turn, this process can be inhibited when effector cells (T-cells) outnumber target cells (29). Hereby, T-cell proliferation by IL2 (Equation 6) is inhibited by a maximum inhibition rate parameter (Imax), an EC50E:T,IL2 parameter which correspond to the Effector to Target (E:T) ratio parameter needed to achieve half of maximum inhibition IL2 effect and a shape parameter (hIL2). All T-cells (naive, activated and desensitized) as well as all tumor cells are accounted for in the E:T ratio. For this analysis and in absence of clinical information, the initial values of T-cells and tumor cells were selected to match an optimal in vitro E:T ratio of 10 (16).
Cytokine releaseOnly activated T-cells from the fifth T-cells activated transit compartment (Tactdelay5) release cytokine (IL6), Cyt, (Equation 7) according to the following equation:
dCytdt=kin,cyt×(1+fKCyt)−kdeg,cyt×Cyt(7)in which kin,cyt and kdeg,cyt are zero and first-order rate constants representing the physiological production and degradation of cytokines, respectively. Baseline cytokine levels, Cyt(t=0), are set to 10pg/mL (30) and defined by kin,cyt/kdeg,cyt. Function fKCyt (Equation 8) describes the increase of cytokine production upon T-cell activation as follow:
fKCyt=Emax,cyt×(Cpla hcytCpla hcyt+EC50cyt hcyt) ×Tactdelay5 α(8)Where Emax,cyt is the maximum increase in cytokine production, hcyt is the Hill coefficient representing the steepness of the exposure-cytokine release relationship, and EC50cyt is the TCE concentration required to reach half of maximal cytokine production increase. In Equation 8, cytokine release also depends on the amount of Tactdelay5 and the shape parameter α. Those parameters were calibrated to describe the in vivo data from Li et al. (16).
Subsequently, the activated T-cells transit into a desensitized T-cell status, Tdesens, which represent T-cells that retained their ability to kill tumor cells without releasing cytokines (Equation 9). This desensitization process might be driven by the release of cytokine itself. As an example, the release of IL10, a regulatory cytokine, is thought to inhibit the release of more pro-inflammatory cytokines like IL6 and TNFα (31). Baseline levels of desensitized T-cells, Tdesens(t=0), are set to zero. The same parameter value (kdelay) has been assumed for the desensitization rate, in absence of data to differentiate them.
dTdesensdt=kdelay×Tactdelay5−kapop× Tdesens+IL2effect×Tdesens(9)It has been hypothesized that desensitized T-cells are, as activated T-cells, affected by the T-cell proliferation effect (IL2effect) (Equation 6).
Tumor cell killingLi et al. (16) demonstrated in vitro that reduced cytokine release upon the second dose was independent of tumor cell depletion and did not compromise cytotoxic efficacy. Tumor cell growth and killing were included in the model to determine if the observed in vitro data could be explained by the hereby proposed mechanisms. Tumor cells (Tumor) were assumed to follow an exponential growth (Equation 10) with a growth rate kg. They are killed by activated (Tactdelay1, …) and desensitized (Tdesens) T-cells as determined by the fKkill killing function (Equation 14) following an Emax relationship versus drug concentration (Cpla, EC50kill) and on the number of T-cells available for killing (Tkill, Equation 15). It was assumed that the TCE was necessary to modulate the activation of the T-cells and thus, no baseline killing was described when no drug was administered. Tumor cell killing was modeled with 3-transit compartments (Equations 11-13, Tumor1 to Tumor3) with a delay of kdelay,tumor (32).
dTumordt=Tumor×(kg−fKkill)(10)Tumor(t=0)=0.1*Tnaive(t=0)dTumor1dt=fKkill×Tumor−kdelay,tumor×Tumor1(11)dTumor2dt=kdelay,tumor×(Tumor1−Tumor2)(12)dTumor3dt=kdelay,tumor×(Tumor2−Tumor3)(13)Tumor1(t=0)=Tumor2(t=0)=Tumor3(t=0)=0fKkill=Emax,kill × (CplaCpla+EC50kill)×Tkill(14)Tkill=Tactdelay1+Tactdelay2+Tactdelay3+Tactdelay4 +Tactdelay5+Tdesens(15)As no tumor data was available from the in vivo experiments, growth rate (kg) and transit delay (kdelay,tumor) were taken from the literature (32) while plausible values were selected for the Emax,kill and EC50kill.
The model parameters of the mechanistic PKPD model are displayed in Table 1.
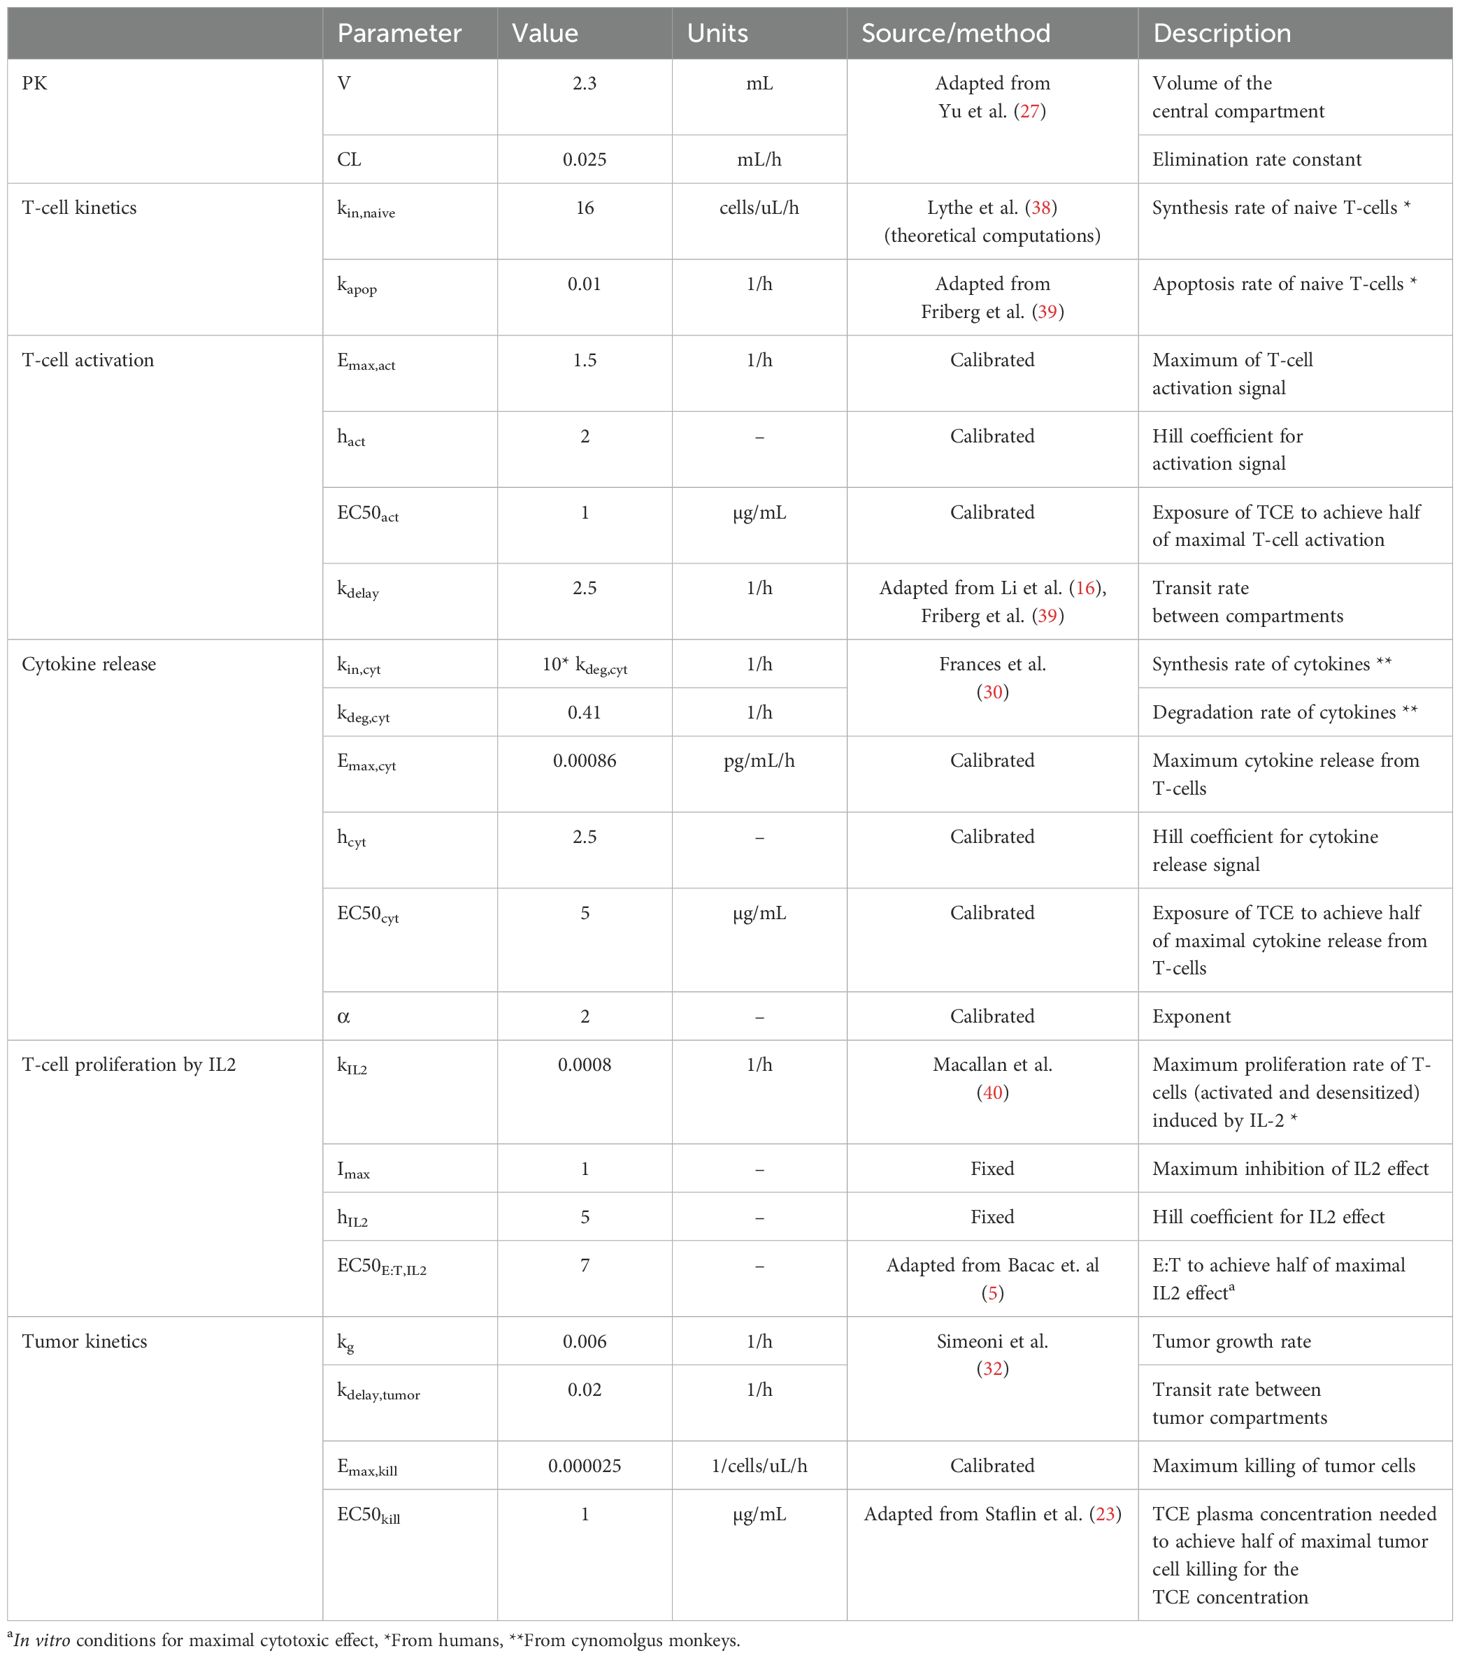
Table 1. Mechanistic PKPD model parameters (in mince) and their corresponding values, units and source (literature or calibrated with the available in vivo data).
Model evaluationThe developed model was used to simulate the time course of IL6 cytokine as in the experimental design of Li et al., i.e. following two consecutive TCE administrations given at different dosing intervals (administrations at day 0 and day 1; day 0 and day 7; day 0 and day 14; day 0 and day 21 or day 0 and day 28). Observed IL6 levels versus PKPD model predictions are shown in Figure 2A. The mechanistic PKPD model was capable of reproducing experimental data (16) with (1) a lower cytokine release after the second compared to the TCE first administration, (2) an increase in cytokine release at the 2nd TCE administration when increasing the dosing interval between the two administrations (3) and a similar cytokine levels between the first and second TCE administration when dosing interval is of 28 days. The observed versus predicted plot (Figure 2B) did not reveal any systematic bias. The model was also able to reproduce the dynamic of other cytokines such as TNFα (Supplementary Figure S1, Appendix), following repeated administration of TCE.
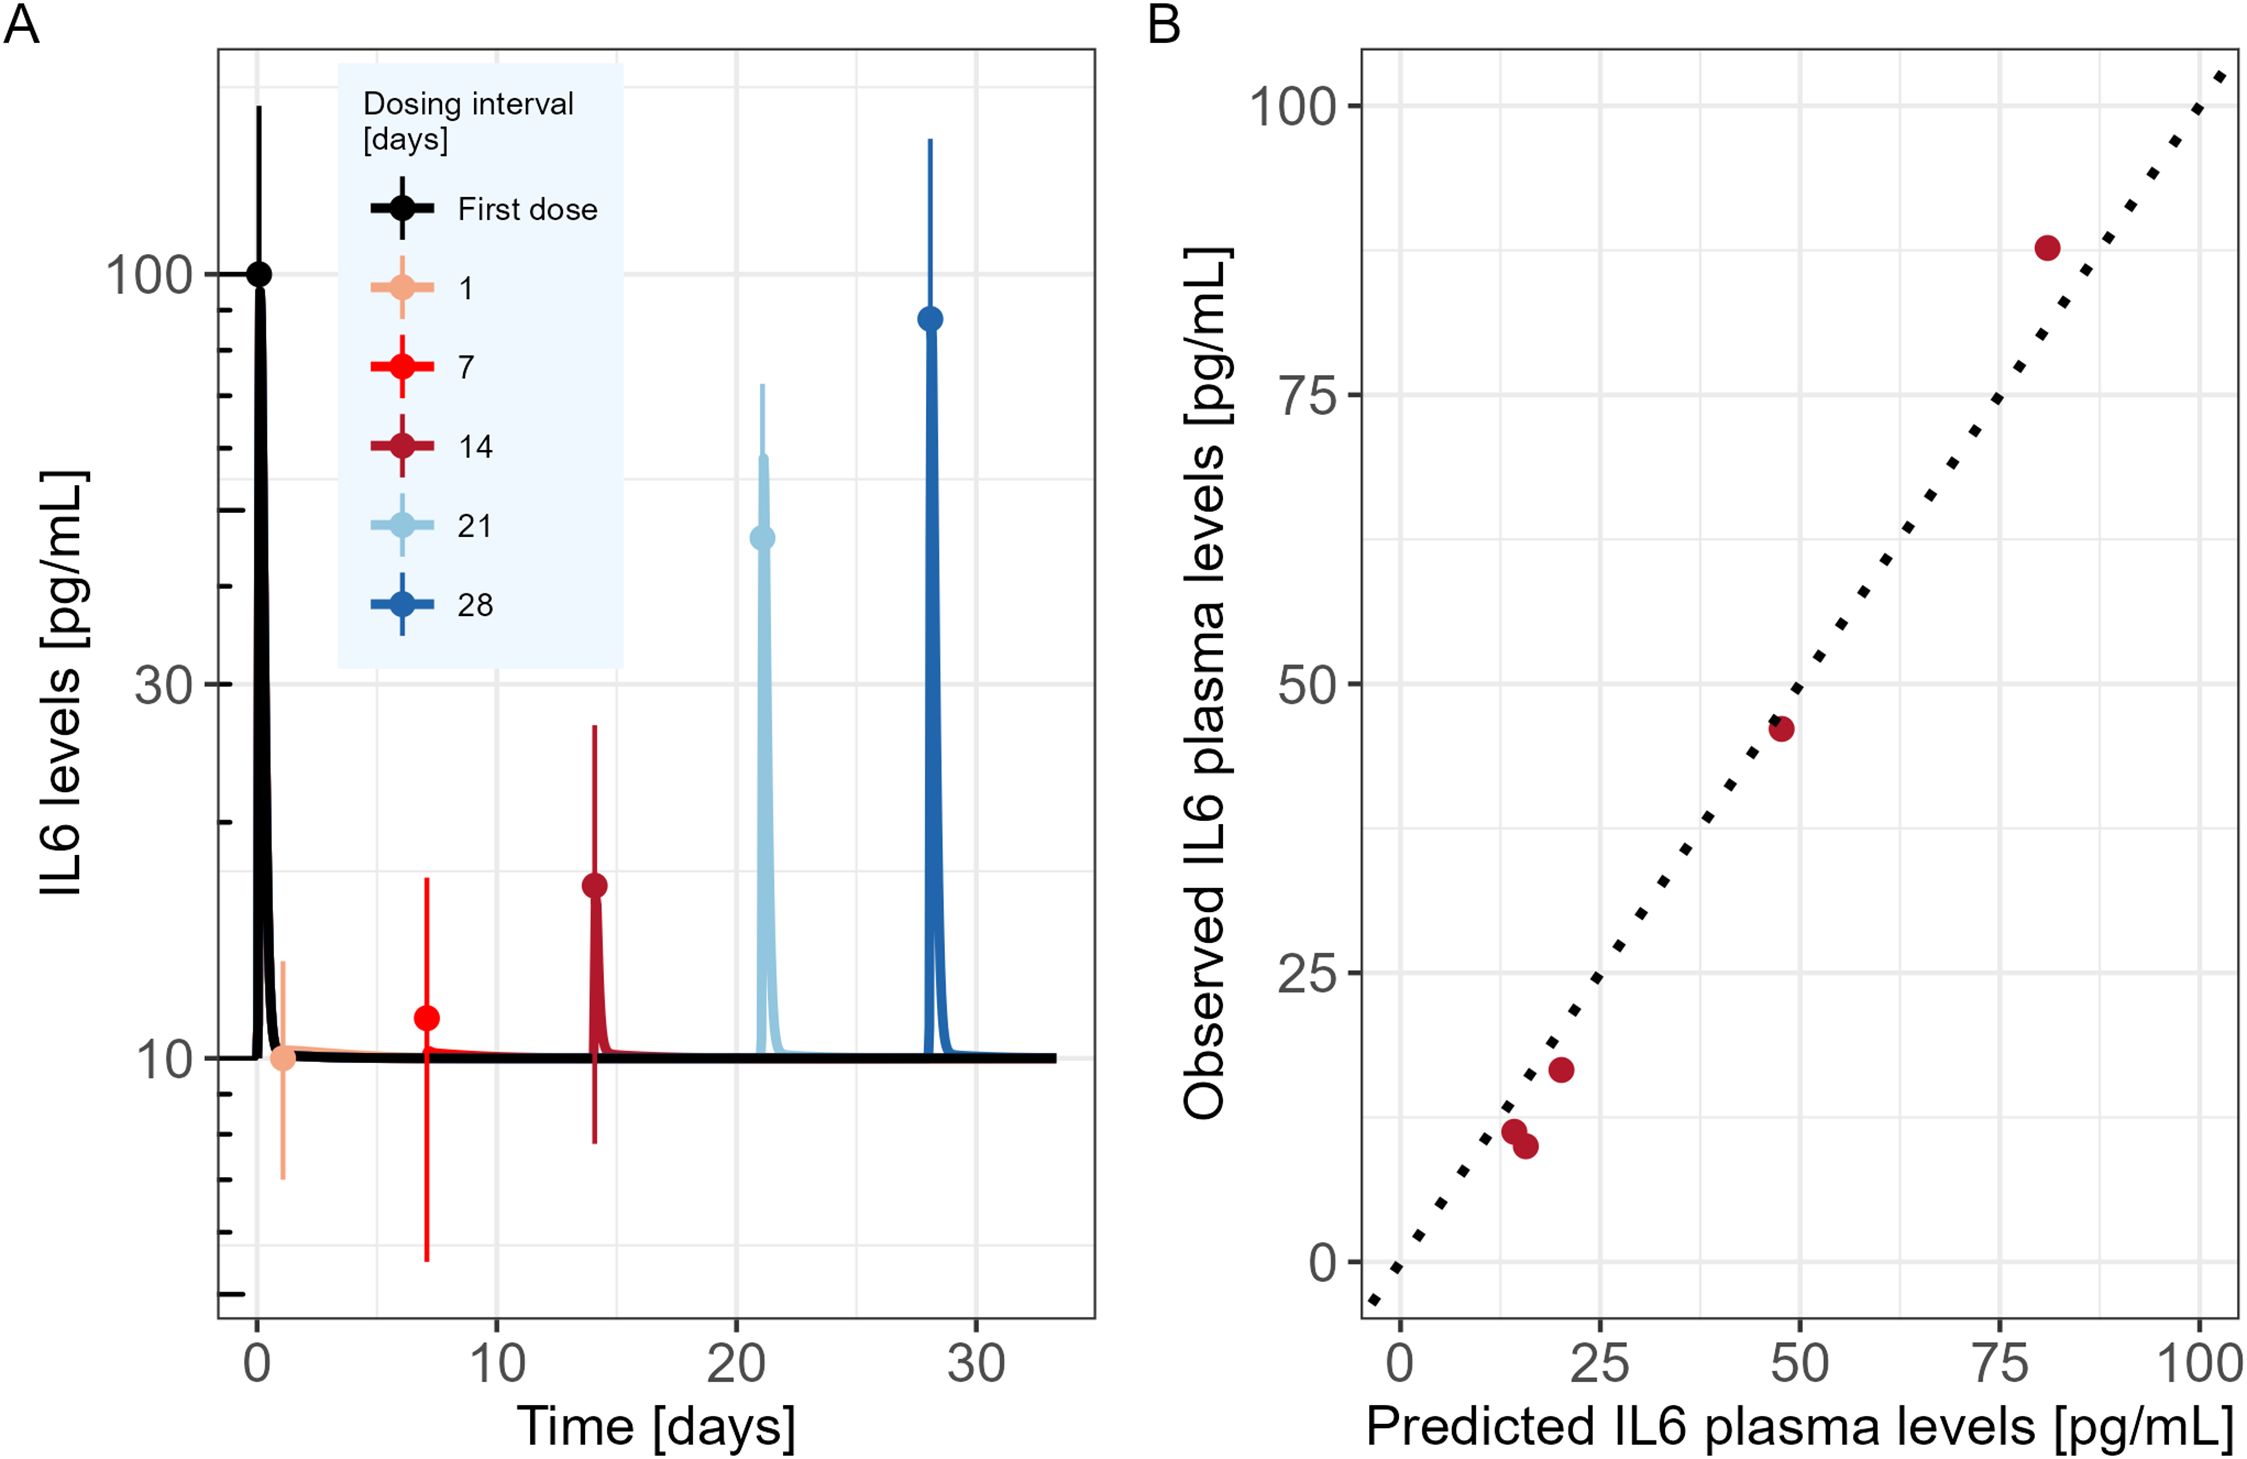
Figure 2. Mechanistic PKPD model performance (A) Model predicted IL6 time course in mice (solid lines) following two consecutive TCE administrations at different dosing intervals (administrations at day 0 and day 1; day 0 and day 7; day 0 and day 14; day 0 and day 21 or day 0 and day 28). Dots represent the digitized experimental data from Li et al. (2019) along with their standard error of mean (SEM). (B) Observed versus model predicted IL6 cytokine levels.
The model was then used to explore the behavior of the different model entities under different scenarios (Figure 3). In the proposed PKPD model, it is assumed that IL6 is released only in presence of naive T-cells, and that the amount released is proportional to the quantity of naive T-cells available at the time of the second TCE administration. Accordingly, the model posits that as almost no naive T-cells are available 7 days after a first TCE administration, if a second dose were to be administered, no additional increments in activated T-cells would be observed, neither in IL6 release. Tumor cell killing would be maintained by the presence of desensitized T-cells (Figure 3B). On the other hand, 21 days after the first TCE administration, the PKPD model assumes that naive T-cells levels are close to their baseline values, which leads to IL6 levels similar to those observed following the initial TCE administration if a second TCE stimulation occurs on that day (Figure 3B).
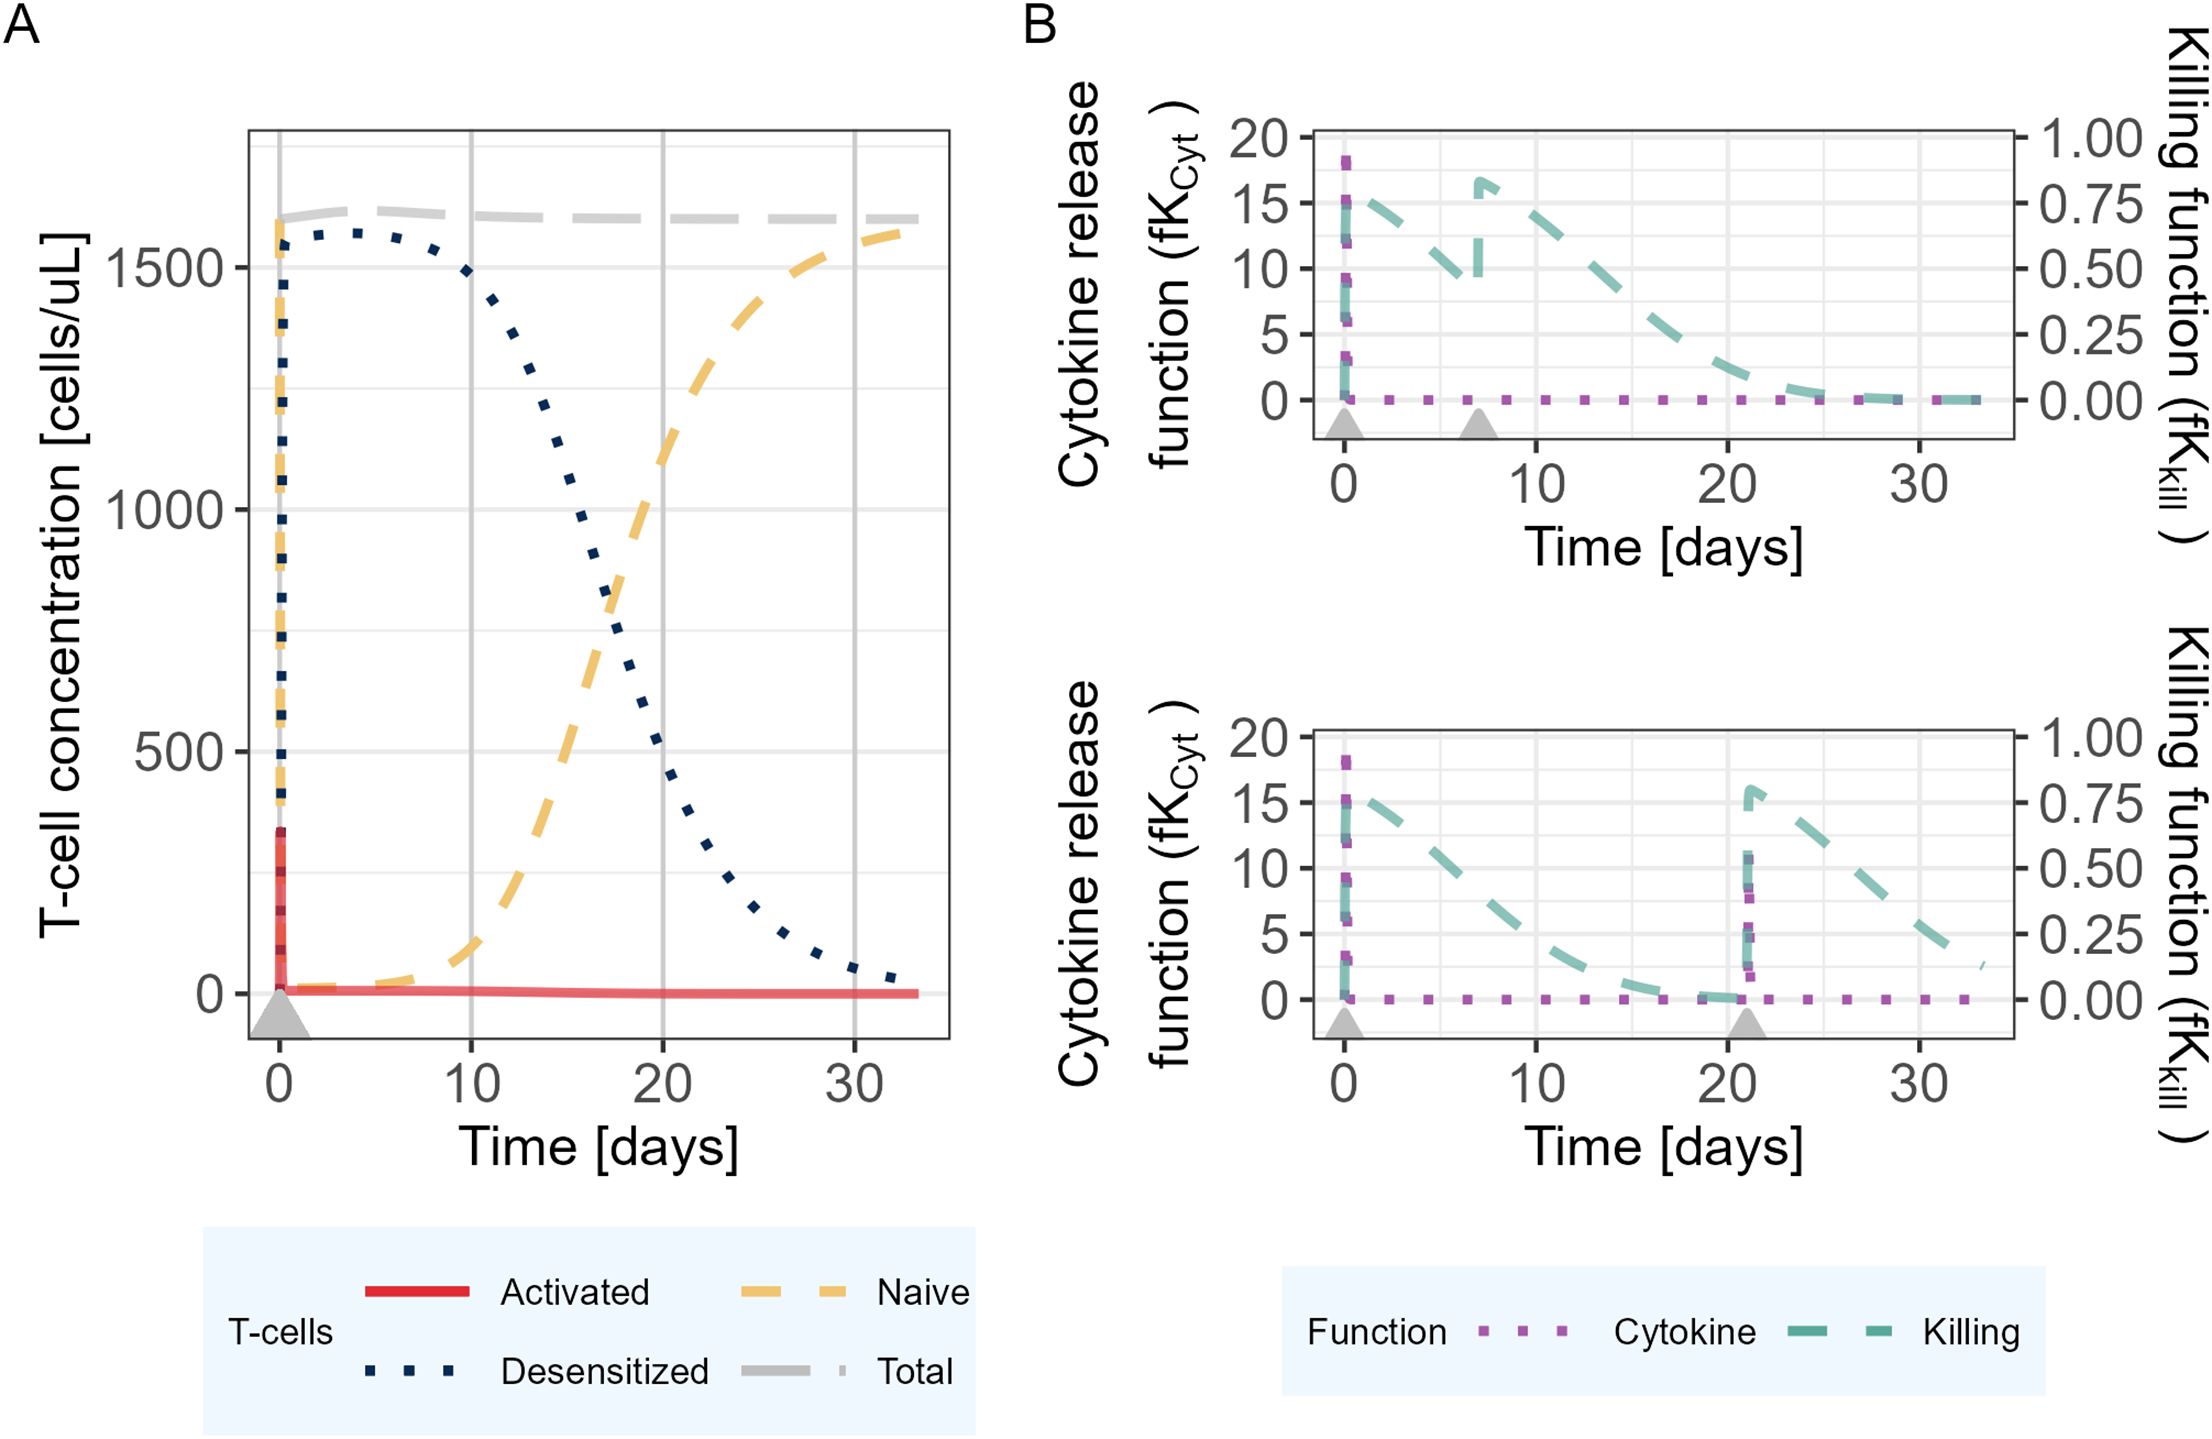
Figure 3. Mechanistic PKPD model simulations of (A) T-cell dynamics following one TCE administration on day 0. (B) Evolution of the killing function (fKkill) and cytokine release function (fKCyt) over time with two TCE administrations 7 (upper panel) or 21 (lower panel) days apart. The gray arrows represent the TCE dosing events (same dose).
The results of the parameter sensitivity analysis for a dosing interval of 21 days are presented in Figure 4. The analysis revealed that the parameters with highest influence on IL6 release predictions are the rate constants associated with naive T-cells (kin,naive and kapo,naive), as well as the parameters associated with the cytokine release function in relation to plasma concentration (α, EmaxCyt and EC50Cyt). The same parameters were highlighted by the sensitivity analysis that was performed for the other tested dosing intervals. The alpha (α) parameter influences the dynamics of the cytokine release (eg, return to baseline after Cmax). Its value could be informed with a dataset capturing the dynamics of cytokines after Cmax.
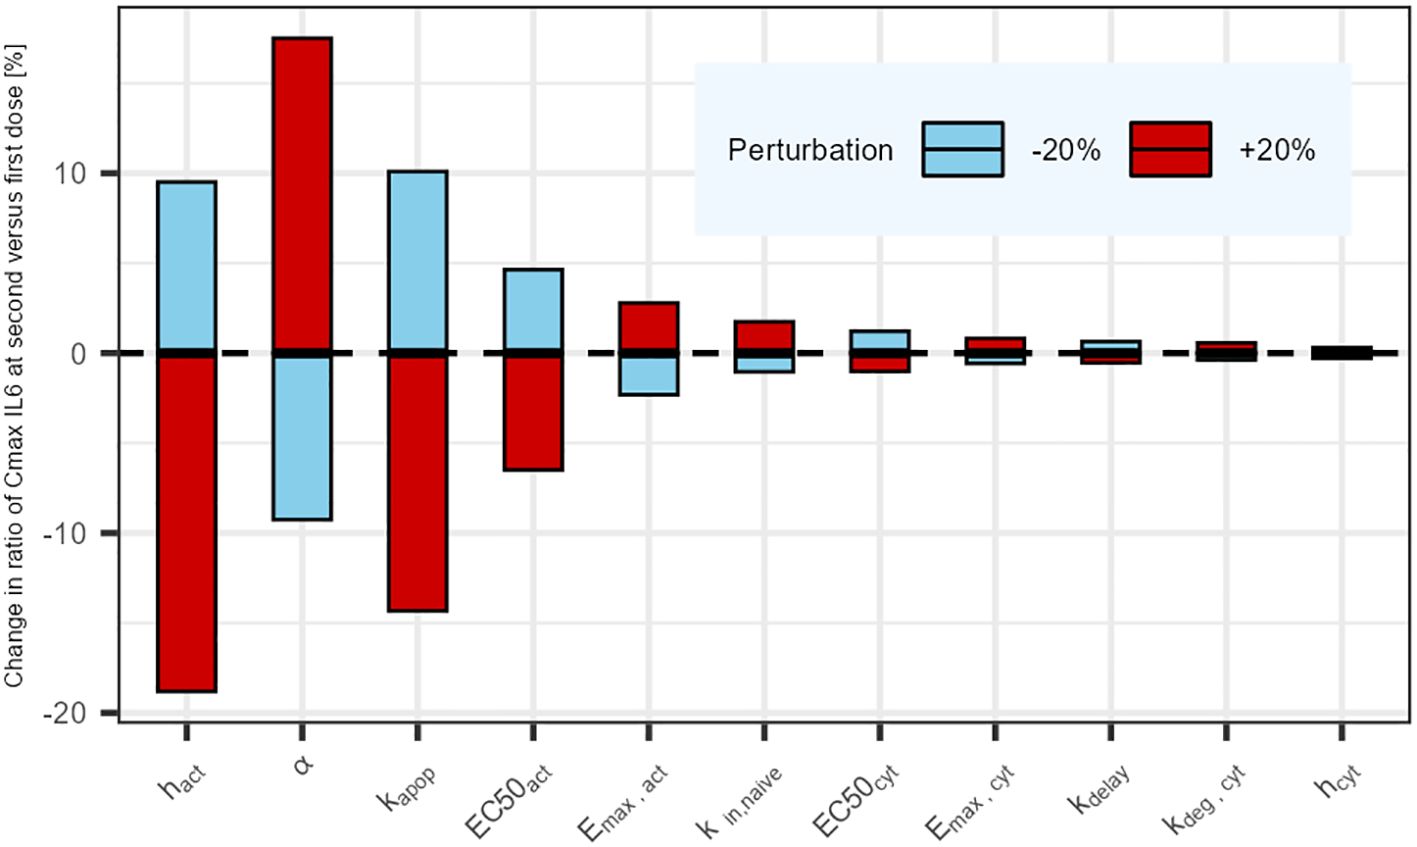
Figure 4. Parameter sensitivity analysis: Impact of a sequential 20% deviation on each parameter on the simulated ratio of IL6 maximum concentration at first administration versus second administration 21 days later. Parameters influencing tumor cell killing were omitted (not affecting cytokine release).
DiscussionTCEs have shown promising potential in cancer therapy, but their clinical development can be risky for patients due to their propensity of inducing cytokine release, a potentially life-threatening condition. Cytokine blockage agents like Tocilizumab are often used as a rescue method for high grades CRS. Conservative approaches like the in vitro minimum anticipated biological effect level (MABEL) approach (8) are also recommended to prevent high grades of CRS for the first-in-human (FIH) dose selection. Nevertheless, the in vitro MABEL derived FIH dose can be substantially lower than the therapeutic dose, leading to long dose escalation phases (12). Consequently, with this approach, many patients are treated at sub-therapeutic doses while some others are put at risk when approaching the Maximum Tolerated Dose (MTD). The final recommended dose and schedule for the drug label will be empirically decided based on all evidence gathered during the clinical development phase. The occurrence of severe CRS in the clinic can also be mitigated by using a SUD approach. Nevertheless, the determination of the optimal SUD dosing regimen remains a major challenge and is often the result of an empirical approach involving many patients. Hereby, a mathematical model capable of predicting cytokine release during the first two TCE administrations is presented. It brings quantitative insights on the dosing interval for the step-up dosing procedure that could be used for any CD3 TCE. The mechanistic PKPD model can be eligible
留言 (0)