Head and neck squamous cell carcinoma (HNSCC) is the sixth most common cancer globally, encompassing malignant tumors in the oral cavity, nasal cavity, pharynx, larynx, neck, and upper esophagus. Over 90% of cases are squamous cell carcinomas, making HNSCC one of the predominant pathological types of cancer originating in the head and neck region (1). The clinical prognosis of HNSCC patients is influenced by various factors, including tumor size, location, the patient’s overall health, and the tumor’s biological characteristics (2). Most HNSCC patients are diagnosed at an advanced stage, with high rates of local recurrence and lymph node metastasis, resulting in a low overall survival rate (3, 4). Despite advancements in treatment methods in recent years, the long-term survival rate of HNSCC patients has seen limited improvement. Consequently, identifying new biomarkers to better understand tumor behavior and predict treatment responses has become a research focus.
Disulfidptosis, a recently discovered form of cell death characterized by abnormally elevated levels of intracellular sulfides, is particularly prevalent in cancer cells due to their aberrant metabolic pathways and stress response mechanisms (5, 6). In solid tumors such as HNSCC, disulfidptosis may be related to tumorigenesis, progression, and response to treatment (7). Recent studies have suggested that disulfidptosis is associated with immune modulation within the tumor microenvironment, potentially influencing tumor response to therapies, including immune checkpoint inhibitors (8). Notably, recent bioinformatics analyses have shed light on the roles of disulfidptosis-related genes (DRGs) in head and neck squamous cell carcinoma (HNSCC), suggesting their potential as predictive biomarkers for prognosis and treatment response. For instance, several studies have demonstrated that DRGs can influence immune cell infiltration and the tumor immune landscape, both of which are pivotal in determining the efficacy of immunotherapies in HNSCC patients (9). Similarly, other researchers have examined the relationship between DRGs and tumor progression in HNSCC using large-scale genomic data, providing valuable insights into how these genes contribute to immune evasion and therapeutic resistance (10). Furthermore, additional studies have elucidated the molecular mechanisms through which DRGs regulate tumor progression, highlighting their roles in modulating cell death pathways and immune cell functions within the tumor microenvironment (11).
The background of this study is based on a comprehensive genomic analysis of HNSCC patient cohorts, aiming to develop a set of predictive DRG prognostic signatures. These signatures can forecast not only clinical outcomes but also patient responses to immune checkpoint inhibitors. We performed an in-depth analysis of HNSCC patient samples using various public databases, including The Cancer Genome Atlas (TCGA) and the Gene Expression Omnibus (GEO). By comparing patient groups with varying survival times, we identified a series of DRGs associated with differential prognoses. Further mechanistic studies revealed how these genes regulate tumor cell death and affect the function of immune cells within the tumor microenvironment. Additionally, we evaluated the effectiveness of these genes in predicting patient responses to immune checkpoint inhibitors. Our preliminary results indicate that these DRGs are associated with overall survival rates, immune-related gene expression, the abundance of tumor-infiltrating lymphocytes, and responses to immune checkpoint inhibitors. These findings provide insights into developing new therapeutic strategies, particularly for patients who do not respond to existing immunotherapies.
In summary, this paper highlights the significance of disulfidptosis in HNSCC treatment, especially in assessing clinical prognosis and immunotherapy response. Although this field is still in its early stages, its potential in personalized medicine and precision treatment cannot be overlooked. As future research progresses, disulfidptosis is expected to become a key factor in improving treatment outcomes for HNSCC patients.
2 Materials and methods2.1 Data sources and preprocessingThis study utilized RNAseq data and corresponding clinical information for HNSCC from The Cancer Genome Atlas (TCGA) (https://portal.gdc.cancer.gov/) (12). The dataset included 504 HNSCC patients and 44 normal tissue samples. All data were standardized per million transcripts (Transcripts Per Million, TPM) and normalized to approximate a normal distribution using the R software package “ggplot2” (v4.0.3). Gene expression data were extracted to construct a data matrix and analyzed using the Wilcoxon test.
2.2 Clinical data and tissue sample collectionClinical data and tissue samples were collected from Chaohu Hospital of Anhui Medical University and Peking University Shenzhen Hospital. The study included 76 HNSCC patients admitted between September 2016 and September 2018. Paraffin-embedded pathological sections of HNSCC tissues and adjacent normal tissues (0.5 cm) were collected, along with complete clinical case data and follow-up information. Among the patients, 56 were male and 20 were female, aged between 35 and 87 years (mean age 62.737 ± 10.836 years), with a median age of 66.0 years. Overall survival (OS) was defined as the period from the date of surgery to the date of death or last follow-up. Follow-up was conducted monthly for the first 3 months, every 3 months for 2 years, every 6 months for the next 3 years, and annually thereafter, ending in September 2023. Survival times ranged from 1.22 to 60 months, with a median survival time of 51.51 months (interquartile range: 19.427 to 60.0 months). All patients were confirmed by pathological examination, and tumor TNM staging was evaluated using the 8th edition of the American Joint Committee on Cancer (AJCC) staging system. The use of HNSCC samples was approved by the Ethics Committee of Chaohu Hospital of Anhui Medical University (approval No. KYXM202310004) and the Ethics Committee of Peking University Shenzhen Hospital (approval No. 2022-117). The study was conducted in accordance with the Declaration of Helsinki (as revised in 2013). All patients provided written informed consent.
2.3 Establishment of subtypesBased on previous literature, we identified 24 potential disulfidptosis-related genes (DRGs) (6) (Supplementary Table 1). Using the consistent clustering of these 24 genes, we performed consistency analysis with the R package “ConsensusClusterPlus” (v1.54.0) (13). The maximum number of clusters was set to 6 (k=6), and 80% of the total sample was drawn 100 times, with clusterAlg = “hc” and innerLinkage=‘ward.D2’. The number of clusters varied from 2 to 6 (k=2-6), and the consistency matrix and the consistency cumulative distribution function (CDF) were evaluated to determine the best classification. Clustering heat maps were generated using the R package “pheatmap” (v1.0.12). Gene expression heat maps retained motifs with a variance above 0.1. Based on the expression profiles of DRGs, TCGA cases were divided into Cluster1 (C1) and Cluster2 (C2).
2.4 Identification and enrichment analysis of differentially expressed genesDifferentially expressed genes (DEGs) between C1 and C2 subtypes were identified using the Limma package (v3.40.2) (14) in R software. The adjusted P value was analyzed in the TCGA database to correct for false positives. “Adjusted P < 0.05 and log2 (Fold change) > 1.5 or log2 (Fold change) < -1.5” was defined as the standard for screening differential expression of mRNA. Heat maps were generated using the R software heatmap package. The Gene Ontology (GO) function of DEGs and their enrichment in the Kyoto Encyclopedia of Genes and Genomes (KEGG) pathway were analyzed using the R package “clusterProfiler” (v3.18.0) (15). Additionally, gene set enrichment analysis (GSEA) (http://software.broadinstitute.org/gsea/index.jsp) (16) was employed to identify potential biological pathways. DEGs from TCGA data were categorized into up-regulated and down-regulated groups. In each analysis, 10,000 gene combinations were tested to identify pathways with significant changes. Genes were considered enriched in meaningful pathways when p.adjust < 0.05 and FDR (false discovery rate) < 0.25.
2.5 Genetic variationGene Set Cancer Analysis (GSCA) (http://bioinfo.life.hust.edu.cn/GSCA/#/) (17) integrated expression, mutation, drug sensitivity, and clinical data from four public data sources for 33 cancer types. Somatic mutations of HNSCC patients were downloaded and visualized using the maftools package in R software, encompassing seven types of mutations: Missense_Mutation, Splice_Site, Nonsense_Mutation, Frame_Shift_Del, Frame_Shift_Ins, In_Frame_Del, Multi_Hit. This study also analyzed the Spearman correlation between the expression of DRGs mRNA and Copy Number Variation (CNV), and methylation. We investigated the correlation between methylation, CNV, and survival outcomes in HNSCC patients, including Disease-Free Interval (DFI), Disease-Specific Survival (DSS), Overall Survival (OS), and Progression-Free Survival (PFS).
2.6 Construction and validation of DRG prognostic modelBased on the levels of the aforementioned DRGs associated with HNSCC prognosis, LASSO-Cox regression analysis was performed to construct the prognostic model. According to the results of multivariate Cox regression analysis, the prognostic DRGs risk score was calculated as follows: Riskscore = ∑i Coefficient (mRNAi) × Expression (mRNAi). The entire TCGA-HNSCC dataset was used as the training cohort, and patients were divided into low-risk and high-risk subtypes based on the average risk score. The overall survival rates of the two subtypes were compared using Kaplan–Meier analysis, and time ROC analysis was conducted to predict the model’s accuracy. The optimal truncated expression value was determined using the “surve_cutpoint” function of the “survminer” R package. The validation cohort was then used to verify the accuracy of the DRGs signature with the GSE41613, GSE65858, GSE85446 datasets and clinical HNSCC tissue samples (n=76) serving as the external validation cohort, further corroborating the results.
2.7 Relationship between DRGs and clinicopathological features and prognosis in HNSCCUsing the log-rank test and univariate Cox regression analysis, Kaplan–Meier curves, P values, and hazard ratios (HRs) with 95% confidence intervals (CIs) were obtained. Subsequently, key prognostic DRGs (SLC3A2, UNBPL, ACTB, and DSTN) in HNSCC patients were identified and analyzed in detail. The relationship between prognosis-related DRGs and the overall survival rate of HNSCC patients was examined, and the area under the receiver operating characteristic (ROC) curve was calculated. The expression and diagnostic efficacy of DRGs in HNSCC were validated using datasets obtained from NCBI-GEO (https://www.ncbi.nlm.nih.gov/gds) (18), including 184 HNSCC tissues and 45 para-cancerous tissues from GSE30784 and 18 HNSCC tissues and 18 para-cancerous tissues from GSE53819. Additionally, we analyzed the prognostic outcomes between high and low-risk groups across different clinical subgroups. Clinicopathological data of HNSCC patients, including age, sex, race, T, N, M, stage, grade, smoking, radiation, and neoadjuvant therapy, were obtained from TCGA.
2.8 Building and validation of a predictive nomogramThe “rms” package was utilized to construct a nomogram model for predicting 1-, 3-, and 5-year OS, PFS, and DSS based on the results of multivariate Cox proportional hazards analysis. The calibration curve and decision curve analysis (DCA) were used to validate the model’s predictive performance. External validation was performed using the GSE65858 dataset and clinical HNSCC tissue samples to evaluate the prediction model’s accuracy.
2.9 Analysis of gene expression related to immune infiltration and immune checkpointsFor immune scoring, the R software immunedeconv package (19) and six advanced algorithms, including TIMER (20), xCell (21), MCP-counter (22), CIBERSORT (23), EPIC (24), and quantTIseq (25), were used to compare the degree of immune cell infiltration between C1and C2 subtypes via the Wilcoxon test. Additionally, single-sample gene set enrichment analysis (ssGSEA) in the R package “GSVA” (26) was used to quantify the infiltration levels of various immune cell types. The infiltration and accumulation of 23 common immune cells, including dendritic cells (DC), immature DC (iDC), activated DC (aDC), plasmacytoid DC (pDC), T helper (Th) cells, type 1 Th cells (Th1), type 2 Th cells (Th2), type 17 Th cells (Th17), regulatory T cells (Treg), T gamma delta (Tgd), T central memory (Tcm), T effector memory (Tem), T follicular helper (Tfh), CD8+ T cells, B cells, neutrophils, macrophages, cytotoxic cells, mast cells, eosinophils, natural killer (NK) cells, NK56- cells, and NK56+ cells, were analyzed. The Wilcoxon rank-sum test was performed to compare differences in immune cell infiltration levels of the four prognosis-related DRGs between high and low expression groups and between high-risk and low-risk groups. The correlation between immune cell infiltration and prognosis of HNSCC patients was also investigated. Spearman correlation was used to explore the relationship between the four prognosis-related DRGs and immune cell infiltration. TIMER (https://cistrome.shinyapps.io/timer/) was used to analyze the abundance of immune cells infiltrated by the four prognostic DRGs in tumors. The detected immune cells included tumor purity, B cells, CD4+ T cells, CD8+ T cells, neutrophils, macrophages and dendritic cells. Immune cell abundance (immune score), stromal cell infiltration level (stromal score), and tumor purity (ESTIMATE score) were estimated using the ESTIMATE algorithm. The expression levels of several immune checkpoint-related genes (CD274, CTLA4, HAVCR2, LAG3, PDCD1, PDCD1LG2, TIGIT, and SIGLEC15) were analyzed between C1 (N=461) and C2 (N=43) subtypes and between high-risk and low-risk groups. Spearman correlation was used to explore the association between risk scores and immune checkpoint-related genes. The Tumor Immune Dysfunction and Exclusion (TIDE) algorithm was used to predict potential immune checkpoint blocking responses. The results were visualized using the R packages “ggplot2” and “pheatmap” (v4.0.3) (27).
2.10 TMB, MSI, mRNAsi, and drug sensitivity analysisThe correlation of the risk score in HNSCC with tumor mutation burden (TMB), microsatellite instability (MSI), and mRNA stemness index (mRNAsi) was analyzed using Spearman correlation. The sensitivity of these drugs was also studied. Drug sensitivity and gene expression profile data from cancer cell lines were integrated from the Drug Sensitivity in Cancer (GDSC) (https://www.cancerrxgene.org/) (28) and the Cancer Therapeutics Response Portal (CTRP) (https://portals.broadinstitute.org/ctrp/) databases. The 50% inhibiting concentration (IC50) of chemotherapeutic drugs was predicted using the R package pRRophetic (29), with the IC50 value of the sample estimated by ridge regression. All parameters were set to default values, the batch effect was adjusted using combat, and the tissue type was considered. Duplicate gene expression was summarized as the mean value.
2.11 Single cell analysisThe expression of DRGs in the tumor microenvironment (TME) was studied using the Tumor Immune Single Cell Center (TISCH) (http://tisch.comp-genomics.org/) (30) to understand their relationship with HNSCC prognosis. In this dataset, three main cell types were included: immune cells, stromal cells, and malignant cells. The t-distributed stochastic neighborhood embedding (t-SNE) map of HNSCC_GSE103322 and the heat map of HNSCC_GSE103322 were displayed through the TISCH database to show the impact of DRGs on the TME in HNSCC. Additionally, scatter plots showing the correlation between DRG immune infiltration levels and cancer-associated fibroblasts (CAFs) and macrophages were generated using TIMER2.0 (http://timer.cistrome.org/) (31).
2.12 DNA methylation analysis of DRGs in HNSCCThe GSCA database was used to evaluate the relationship between the expression of four prognostic DRGs and DNA methylation levels. NUBPL methylation levels were measured in HNSCC patients grouped by different clinicopathologic features, including age, gender, race, smoking status, nodal metastasis status, tumor grade, individual cancer stage, and TP53 mutation, using the UALCAN database (http://ualcan.path.uab.edu/index.html) (32). The MethSurv database (https://biit.cs.ut.ee/methsurv/) (33) was then used to analyze the DNA methylation of four prognostic DRGs at CpG sites and the prognostic value of these CpG methylation sites in HNSCC.
2.13 Relationship between DRG expression level and RNA modification regulatory factorsUsing the Wilcoxon test and the “ggplot2” package in R software (v4.0.3), differences in gene expression between high and low-risk groups for m6A, m5C, m1A, and m7G genes in HNSCC samples were analyzed. The correlation between the risk score in HNSCC samples and the expression of m6A, m5C, m1A, and m7G genes was also examined. The expression matrix for m6A genes includes RBM15B, VIRMA, IGF2BP2, HNRNPA2B1, IGF2BP1, YTHDF3, IGF2BP3, HNRNPC, RBM15, RBMX, METTL14, YTHDC2, METTL3, ZC3H13, WTAP, YTHDF1, YTHDC1, FTO, and YTHDF2. m5C genes include DNMT1, DNMT3A, DNMT3B, MBD1, MBD2, MBD3, MBD4, MECP2, NEIL1, SMUG1, TDG, UHRF1, UHRF2, UNG, ZBTB33, ZBTB38, ZBTB4, TET1, TET2, and TET3. m1A genes include TRMT10C, TRMT61B, TRMT6, TRMT61A, ALKBH3, ALKBH1, YTHDC1, YTHDF1, YTHDF2, and YTHDF3. m7G genes include AGO2, CYFIP1, DCP2, DCPS, EIF3D, EIF4A1, EIF4E, EIF4E2, EIF4E3, EIF4G3, GEMIN5, IFIT5, LARP1, LSM1, METTL1, NCBP1, NCBP2, NCBP2L, NCBP3, NSUN2, NUDT10, NUDT11, NUDT16, NUDT3, NUDT4, SNUPN, and WDR4.
2.14 Prediction of potential MicroRNA and long non-coding RNA target genesENCORI (http://starbase.sysu.edu.cn/) (34), miRTarBase (https://mirtarbase.cuhk.edu.cn/) (35), RNA22 (https://cm.jefferson.edu/rna22/interactive) (36), RNAInter (http://www.rnasociety.org/rnainter/) (37), and miRWalk (http://miRWalk.umm.uni-heidelberg.de/) (38) databases were used to screen candidate microRNAs (miRNAs) and predict miRNA targets. These selected miRNAs are referred to as potential miRNAs of target genes. The potential combinations of long non-coding RNAs (lncRNAs) and miRNAs were predicted using the miRNet database (http://www.mirnet.ca/) (39). Subsequently, the mRNA-miRNA and miRNA-lncRNA regulatory networks were established using Cytoscape (version 3.7.1; http://www.cytoscape.org/) (40). The correlation and prognostic value of these candidate miRNAs and lncRNAs in HNSCC were further verified using the ENCORI and Kaplan–Meier plotter databases.
2.15 Cell culture and transfectionThree HNSCC cell lines (HN6, HSC3, and SCC9) and a human normal squamous cell line (NOK) were used in this study. NOK, HN6, HSC3, and SCC9 cell lines were purchased from the American Type Culture Collection (ATCC; Manassas, VA, USA). HN6 and HSC3 cells were cultured in DMEM (Sigma, USA, D5546), supplemented with 10% FBS (Gibco, 10099-141C) and 1% penicillin-streptomycin solution (Gibco, Massachusetts, USA, 15070063). SCC9 cells were supplemented with 10% FBS (Gibco, 10099-141C), 1% penicillin-streptomycin solution (Gibco, 15070063), and hydrocortisone (1 ng/mL; MCE, HY-N0583). NOK cells were grown in defined keratinocyte-SFM (Gibco, 10744019) supplemented with Defined Keratinocyte-SFM Growth Supplement (Gibco, 10744019) and 1% penicillin-streptomycin solution. All cultures were maintained in a humidified incubator with 5% CO2 at 37°C. After passaging cells and culturing them in a six-well plate for 24 hours, transfection was performed when the cell density reached 60–70%. Transfection of shRNA-DSTN (GeneRulor, Zhuhai) was carried out using Lipofectamine 3000 transfection reagent (Invitrogen, USA). Cells were collected 48 hours post-transfection to extract RNA for assessing transfection efficiency, with all experiments performed in triplicate.
2.16 Proliferation and colony formation assayFor the proliferation assay, 2000 cells were seeded in a 96-well plate after the indicated treatment. On the next day, cell viability was detected using the Cell Counting Kit-8 (CCK-8) assay (Dojindo, Japan) according to the manufacturer’s instructions. Each experiment was conducted in triplicate, and cell viability was measured continuously for 5 days. For the colony formation assay, 1000 cells were seeded in a six-well plate with complete medium and grown for approximately 2 weeks. Visible colonies were then fixed with 4% paraformaldehyde, stained with 1% crystal violet, and counted.
2.17 Wound healing assaysCells were seeded in 6-well plates and cultured to 90% confluence. A scratch was made across the plates using a pipette tip, and isolated cells were removed with PBS. Images of the wound were captured after 24 hours of incubation. The wound area was measured using Image J.
2.18 Transwell assays24-well transwell chambers, coated with or without Matrigel (Corning, NY, USA, 354480, 3422), were used to analyze cell migration and invasion. Cells suspended in serum-free culture medium were planted into the upper chamber, while medium containing 10% FBS was added to the bottom chamber as an attractant. After 24 hours of incubation, cells remaining in the upper chamber were wiped off with cotton swabs. Cells that had penetrated the transwell chambers were fixed with methanol and stained with crystal violet. The number of cells in five random fields of view (×100 magnification) was counted under a microscope.
2.19 RNA isolation and RT-qPCRTotal RNA was isolated from cells using the Quick-RNA MiniPrep kit (Zymo Research, Irvine, CA, USA, R1054). Reverse transcription was performed using the Takara PrimeScript RT reagent kit (Takara, Kusatsu, Japan, RR037A). A miScript SYBR Green PCR kit (Qiagen, Germany) was used to detect the expression of target genes on a Lightcycler 480 Real-Time PCR System (Roche Diagnostics GmbH, Mannheim, Germany). The relative standard curve method (2−△△CT) was employed to determine the relative mRNA expression, with the glyceraldehyde 3-phosphate dehydrogenase (GAPDH) gene as the reference. Supplementary Table 2 lists the polymerase chain reaction primers used in this study.
2.20 Validation of protein expression levels of DRGs by immunohistochemistryImmunohistochemistry (IHC) staining was used to detect the protein expression of DRGs in HNSCC tissues. Paraffin-embedded tissue specimens were cut into 4 μm-thick sections, deparaffinized, rehydrated with gradient ethanol, and incubated in EDTA. Endogenous peroxidase was blocked using 3% hydrogen peroxide. 10% normal goat serum was used to reduce non-specific binding. Rabbit monoclonal antibodies to DRGs (ab307587, ab235924, ab8226, ab186754; 1:1000, Abcam, UK) were used as the primary antibodies, and samples were incubated for 1 hour at room temperature. After washing with PBS, biotin-labeled secondary antibodies and streptavidin-horseradish peroxidase were added and incubated at room temperature for 10 minutes each. Samples were then stained with DAB, dehydrated, and fixed with resin.
2.21 Statistical analysisThe Wilcoxon rank-sum test was used to assess the expression differences of DRGs between HNSCC and adjacent tissues. Kaplan-Meier curves were analyzed using the R packages “survival” and “survminer.” Univariate and multivariate Cox regression analyses were performed using the “survival” R package. The time-dependent AUC value was calculated using the R “timeROC” package, and ROC curves were plotted using the R “survivalROC” package. Statistical significance was indicated by asterisks. A p-value < 0.05 was considered statistically significant (* p < 0.05, ** p < 0.01, *** p < 0.001). All statistical analyses were conducted using the R package.
3 Results3.1 Identification and analysis of DRG clusters in HNSCCThe flowchart of the study is illustrated in Figure 1. The expression levels of 24 DRGs were compared between HNSCC tissues (n = 504) and normal tissues (n = 44) in the TCGA-HNSCC dataset. The results showed that the expression levels of SLC7A11, SLC3A2, RPN1, NUBPL, NDUFA11, NCKAP1, LRPPRC, GYS1, ACTB, CAPZB, CD2AP, DSTN, FLNA, FLNB, INF2, MYH10, MYH9, MYL6, PDLIM1, and TLN1 were upregulated in cancer tissues compared with normal tissues, whereas the expression levels of NDUFS1 were downregulated (Figure 2A). Additionally, most of the 24 DRGs in HNSCC samples were positively correlated (Figure 2B). Based on the expression levels of the 24 DRGs in HNSCC, consensus clustering was performed to classify the 504 HNSCC samples in the TCGA database. All tumor samples were divided into k (k = 2 - 6) different clusters. The cluster number was selected as two, indicating that HNSCC patients were accurately divided into two clusters (C1 and C2) (Figures 2C–F). The Kaplan-Meier survival curve showed that the overall survival (OS) of C2 patients was significantly worse than that of C1 patients (Figure 2G).
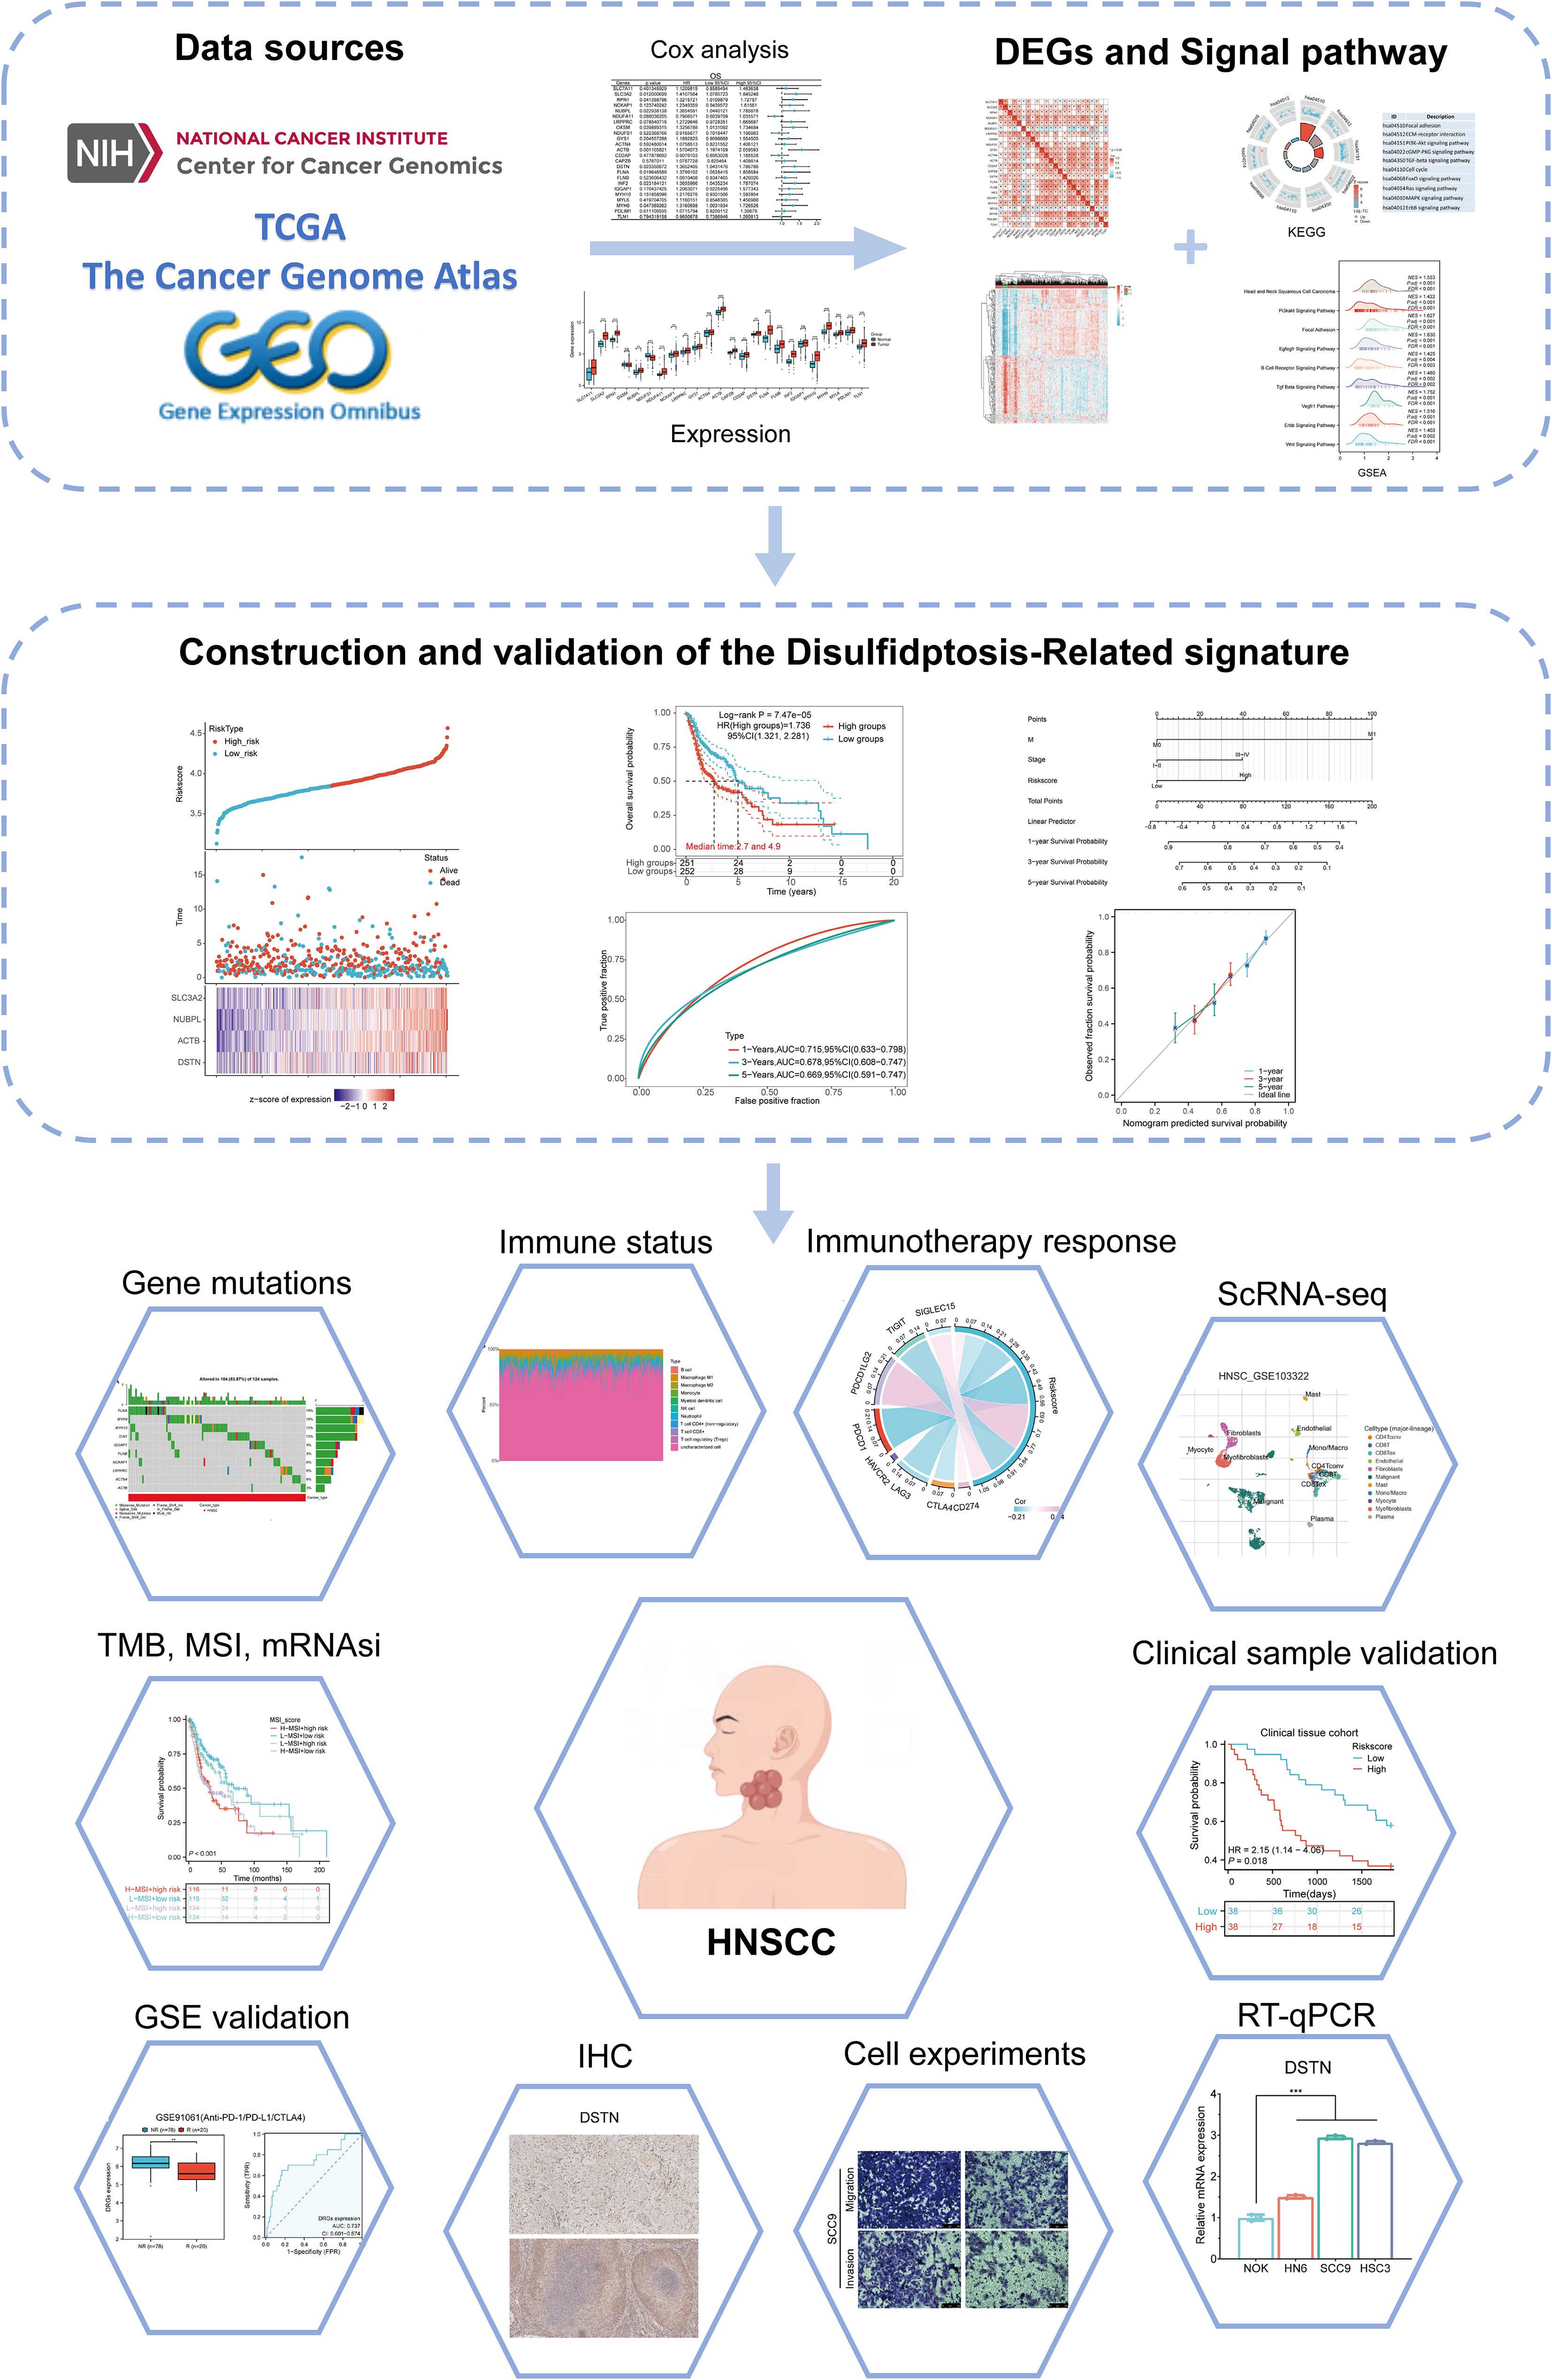
Figure 1. Flowchart of the present study.
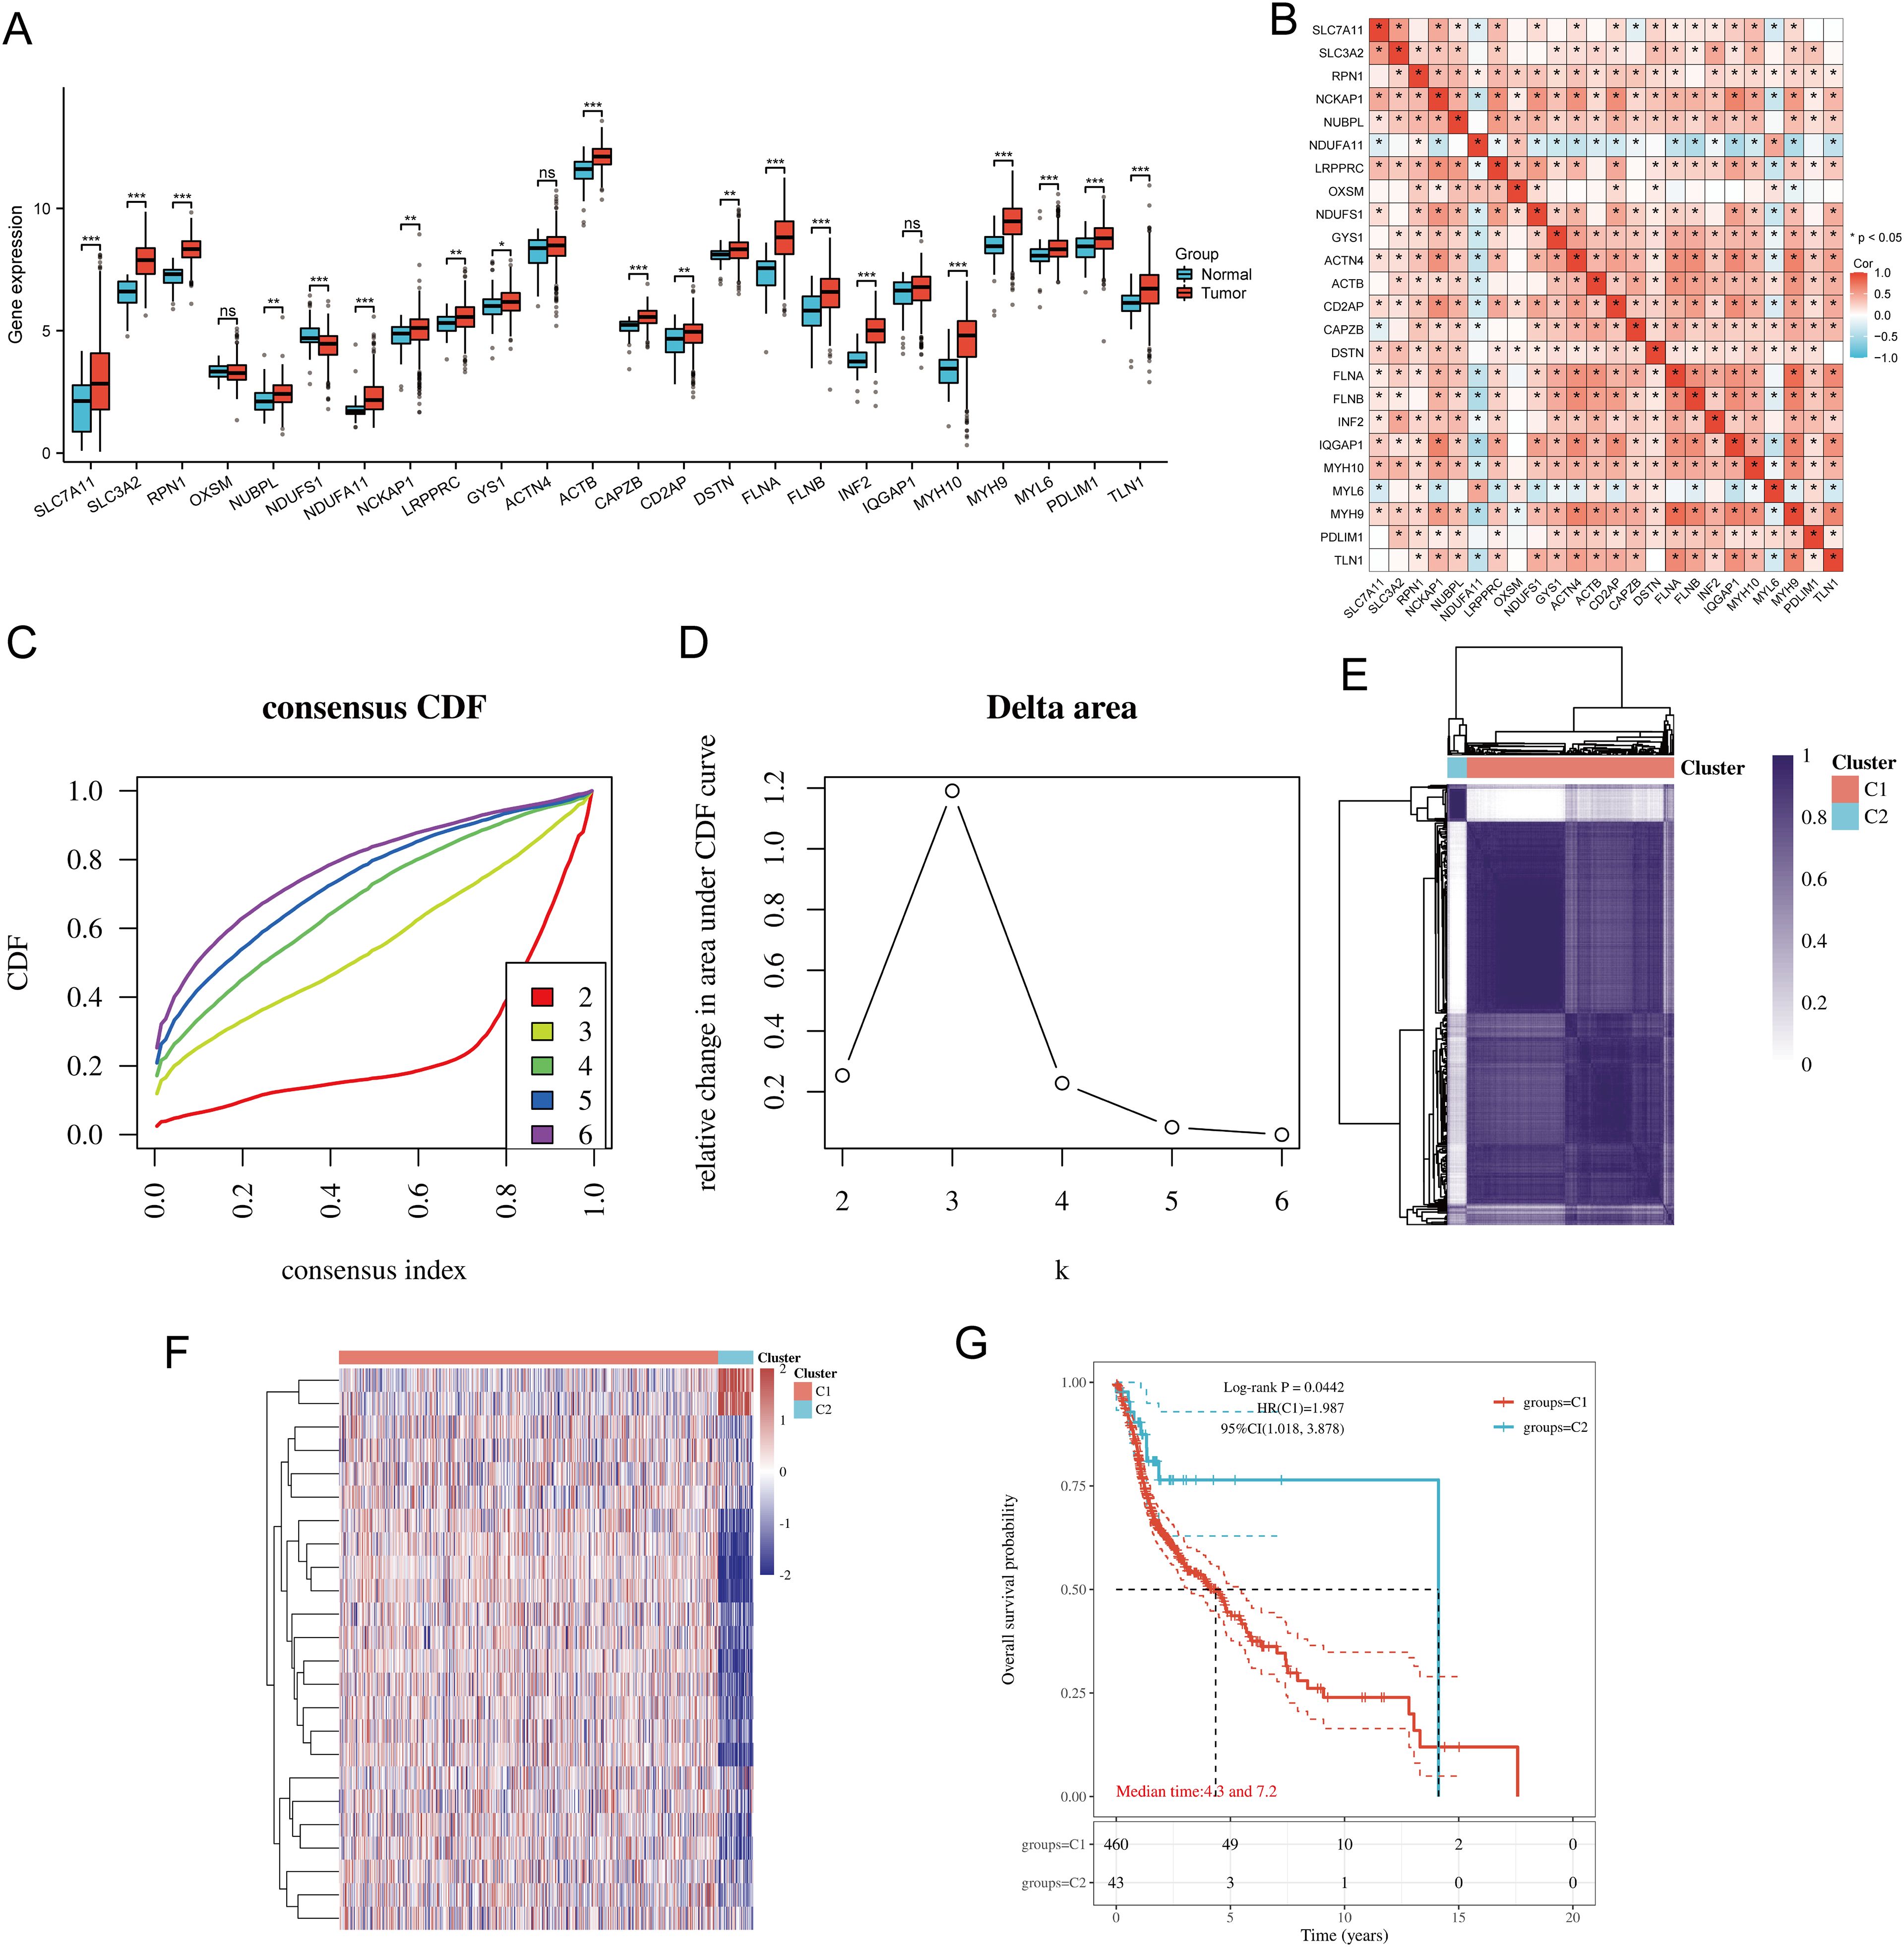
Figure 2. Common clusters were identified based on the expression of DRGs. (A) The expression levels of 24 DRGs in HNSCC and paracancerous tissues, and the quartile ranges of the upper and lower representative values of the box; the line in the box represents the median value. (B) Pearson’s correlation analysis for the expression of 24 DRGs in HNSCC. (C) Cumulative distribution function (CDF) (k = 2 - 6). (D) Relative change of area under CDF curve (CDF Delta area) (k = 2 - 6). (E) Consensus clustering matrix (k = 2). (F) The heat map of DRG expression in different subtypes, wherein red color represents high expression and blue color represents low expression. (G) Kaplan-Meier survival analysis based on two clusters. *p<0.05, **p<0.01, ***p<0.001.
3.2 DEGs and functional enrichment analysisThe DEGs identified between C1 and C2 subtypes included 6530 upregulated genes and 717 downregulated genes. A volcano map (Figure 3A) and heat map (Figure 3B) were constructed for these DEGs. GO and KEGG enrichment analysis identified the upregulated and downregulated DEGs. GO analysis showed that the DEGs were mainly enriched in extracellular matrix organization, response to transforming growth factor-beta, cell-substrate adhesion, focal adhesion, collagen-containing extracellular matrix, extracellular matrix binding, collagen binding, and GTPase binding (Figure 3C). KEGG enrichment analysis indicated that DEGs were enriched in processes such as ECM-receptor interaction, focal adhesion, cell cycle, cGMP-PKG signaling pathway, TGF-beta signaling pathway, PI3K-Akt signaling pathway, MAPK signaling pathway, and ERBB signaling pathway (Figure 3D). GSEA pathway enrichment analysis showed that the expression of DRGs was closely associated with pathways including Head and Neck Squamous Cell Carcinoma, PI3K-Akt signaling pathway, focal adhesion, EGFEGFR signaling pathway, B cell receptor signaling pathway, TGF-beta signaling pathway, ERBB signaling pathway, VEGFR1 pathway, and Wnt signaling pathway (Figure 3E; Supplementary Table 3). Activation of these pathways increases the risk of tumor development and progression.
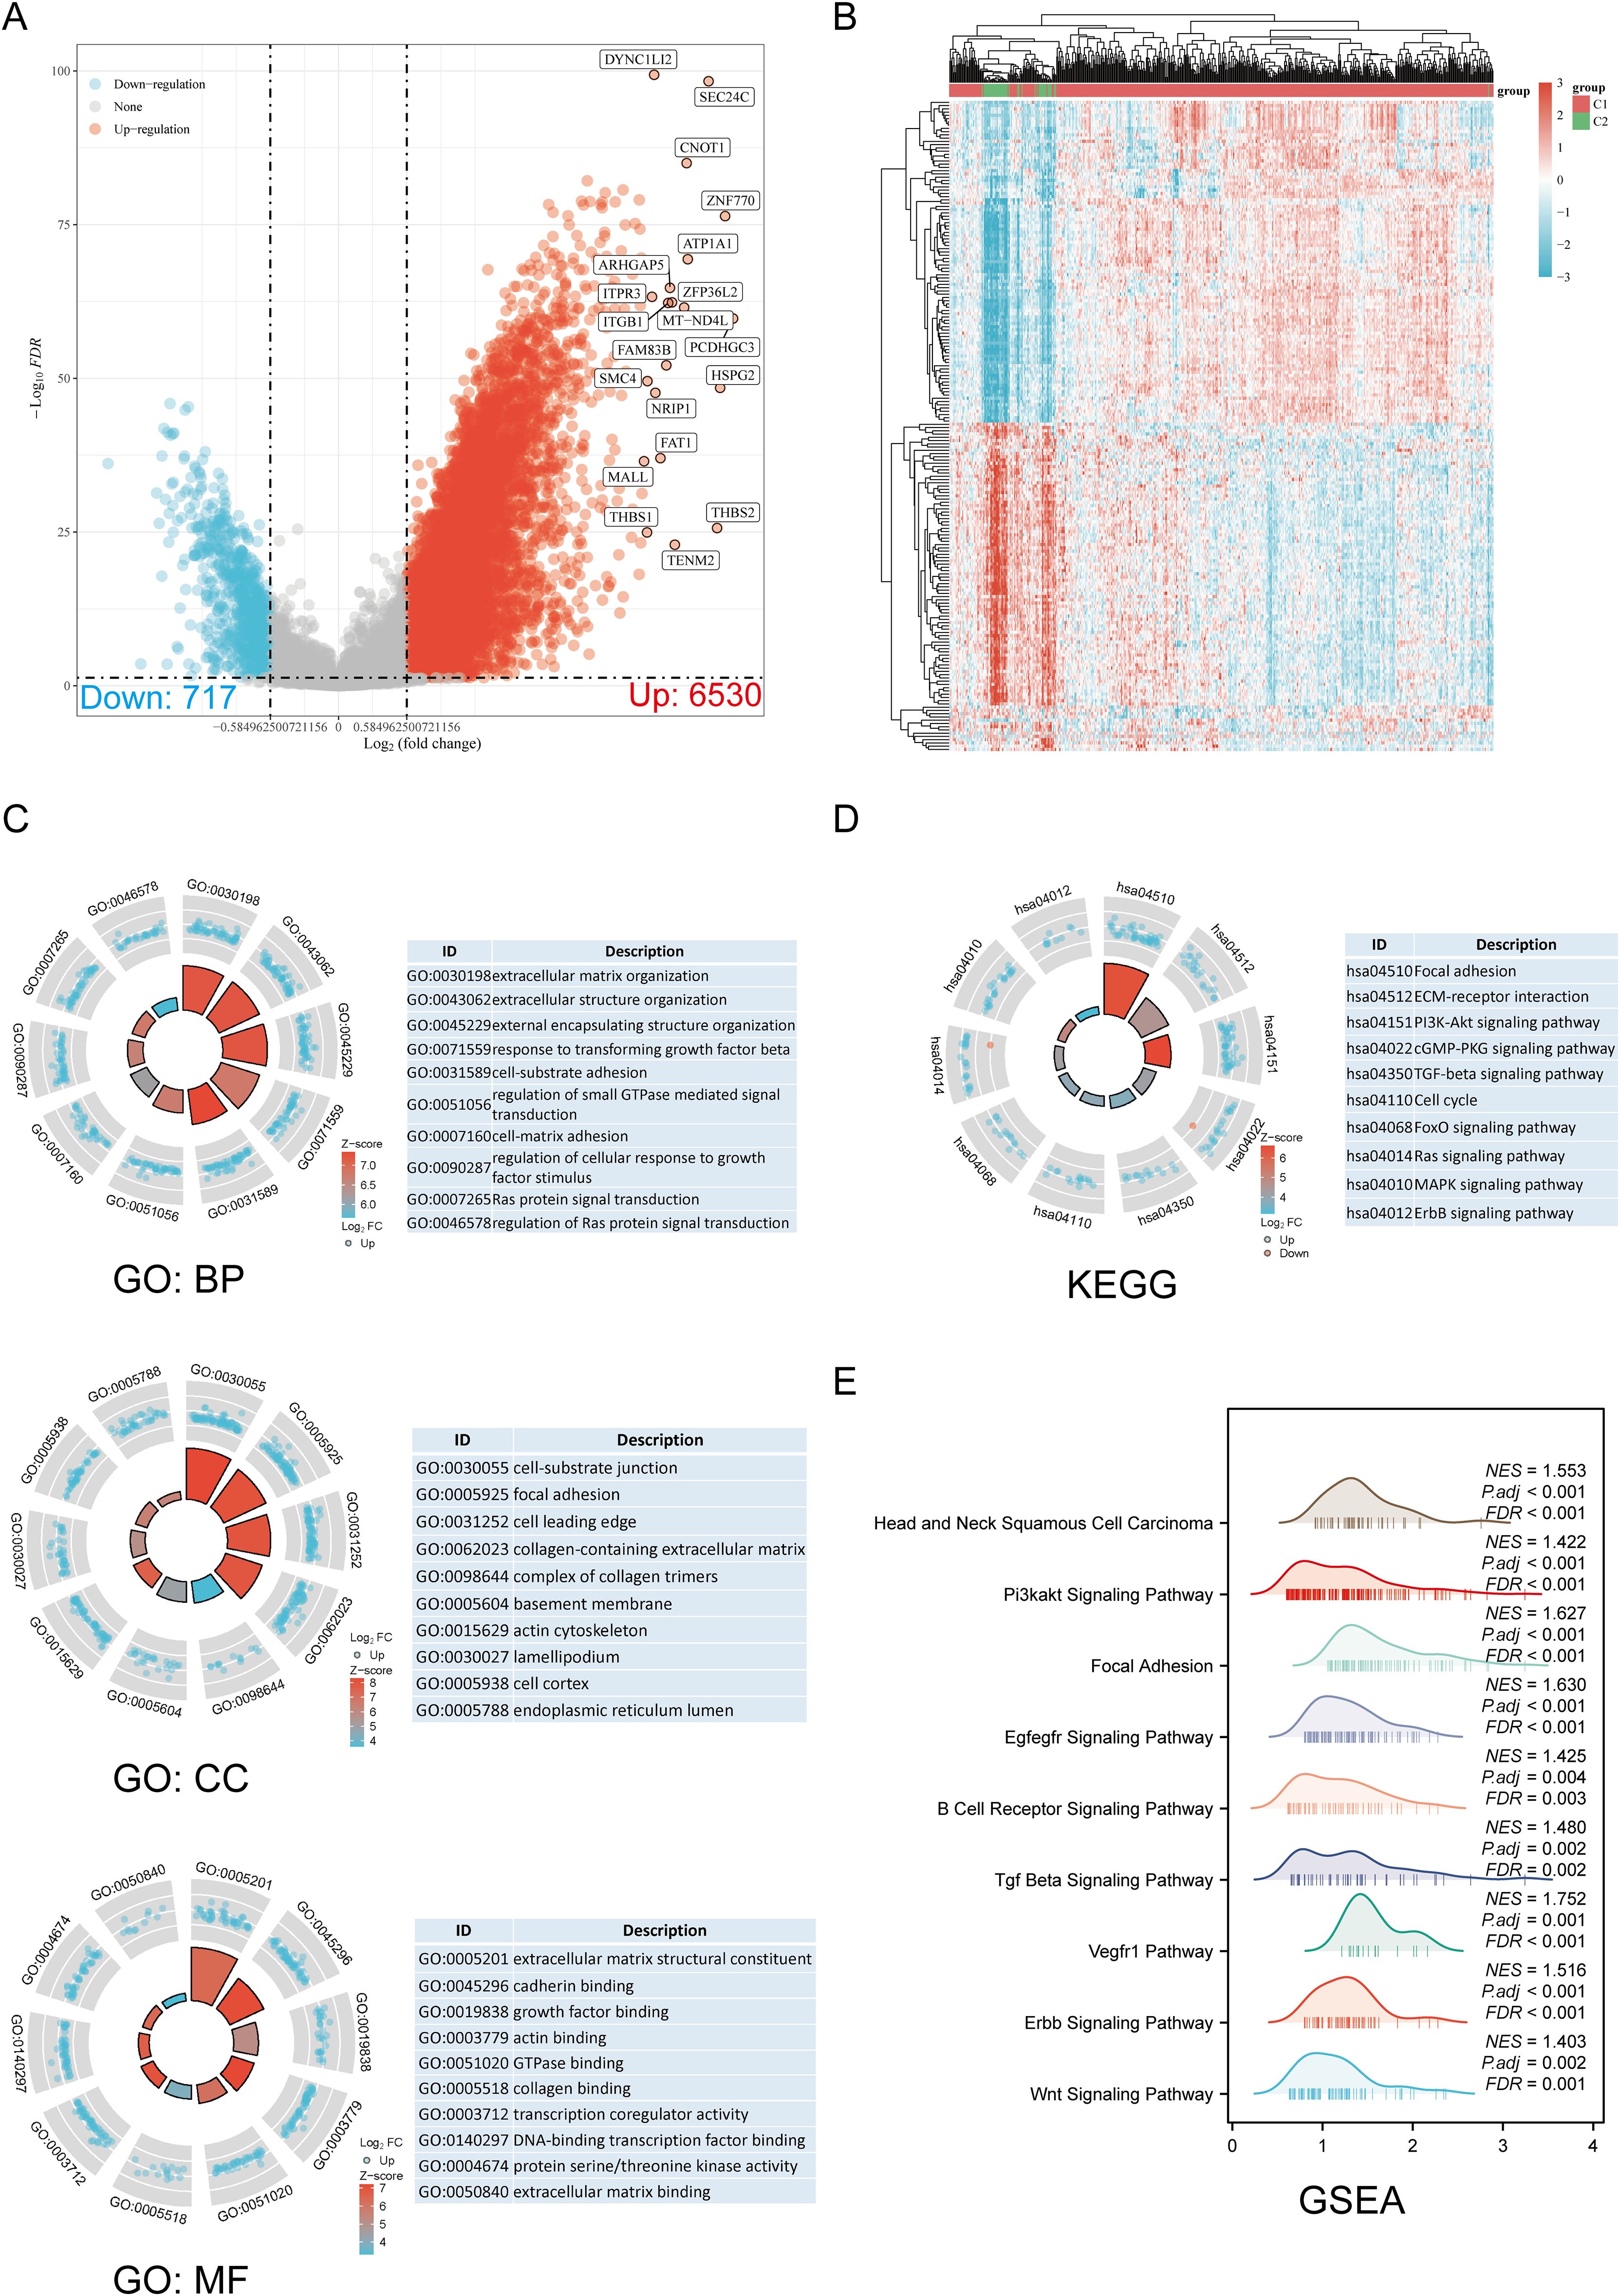
Figure 3. Screening of DEGs between DRG subtypes and functional enrichment analysis of DEGs. (A) The volcano plot of DEGs between C1 and C2 subtypes. (B) DEG heat map between C1 and C2 subtypes. (C, D) Enrichment analysis results of GO and KEGG for DEGs. (E) Enrichment map from GSEA.
3.3 Correlation analysis of genetic changesUsing the GSCA database, we analyzed the percentage map of SNVs on the chart. FLNA mutation frequency was high. The oncoplot provided the SNVs of the top 10 genes among DRGs, with FLNA (18%) and MYH9 (18%) having the highest mutation frequencies, followed by MYH10 (15%), TLN1 (15%), IQGAP1 (9%), FLNB (8%), NCKAP1 (6%), LRPPRC (6%), ACTN4 (6%), and ACTB (3%) (Supplementary Figure 1A). Mutations were categorized, with missense mutations accounting for the largest proportion (Supplementary Figure 1B). Single nucleotide polymorphisms (SNPs) were more frequent than deletions (Supplementary Figure 1C), and C > T was the most common type of SNV (Supplementary Figure 1D). By calculating the number of base changes per patient, we found that the median and maximum number of mutations were 1 and 5, respectively (Supplementary Figure 1E). The box plot shows the number of occurrences for each variant classification (Supplementary Figure 1F). By considering the total number of mutations and calculating multiple hits separately, we recalculated the top 10 mutated genes (Supplementary Figure 1G). CNV and methylation levels are important factors that affect gene expression levels and prognosis. We analyzed the correlation between DRG CNV, methylation status, and mRNA. The results showed a significant positive correlation between DRG CNV and mRNA expression, while gene methylation levels had a negative correlation with mRNA expression (Supplementary Figure 1H). Supplementary Figure 1I shows that for some DRGs, CNV and methylation levels are significantly associated with poor prognosis in HNSCC patients. Subsequently, we analyzed the CNV landscapes of the 24 DRGs in HNSCC (Supplementary Figure 1J). Supplementary Figure 1K shows high heterozygosity deletion/amplification rates. CNV analysis revealed that DRGs had heterozygous amplification and extensive heterozygosity loss, while TLN1, RPN1, and FLNA showed high-level homozygosity amplification, and NDUFS1 and FLNB showed high-level homozygosity loss.
3.4 Establishing a prognostic risk modelWe identified eight genes with prognostic value (SLC3A2, RPN1, NUBPL, ACTB, DSTN, FLNA, INF2, MYH9) using univariate Cox analysis and visualized them using a forest plot, including OS, PFS, and DSS (Figure 4A). As shown in Figure 4B, the OS rate of HNSCC patients with high expression levels of SLC3A2 (HR = 1.411, p = 0.012), RPN1 (HR = 1.322, p = 0.0414), NUBPL (HR = 1.365, p = 0.0229), ACTB (HR = 1.57, p = 0.00111), DSTN (HR = 1.365, p = 0.0234), FLNA (HR = 1.38, p = 0.0196), INF2 (HR = 1.366, p = 0.0232), and MYH9 (HR = 1.316, p = 0.0474) was lower. Therefore, high expression of these genes is a prognostic factor in HNSCC patients. Based on the expression profiles of these potential prognostic biomarkers, LASSO Cox regression analysis was performed to construct an OS prognosis model based on the eight prognostic DRGs (Figures 5A, B). The risk score for OS in patients with HNSCC was determined as follows: Risk score = (0.0807) * SLC3A2 + (0.2193) * NUBPL + (0.2167) * ACTB + (0.0082) * DSTN. According to the risk score, TCGA-HNSCC (training cohort) patients were divided into two groups. The risk score distribution, survival status, and expression levels of the four DRGs are shown in Figures 5C, D. With an increase in the risk score, the risk of death increased and survival time decreased (Figure 5C). The Kaplan–Meier curve showed that HNSCC patients with high risk scores had lower OS rates compared with patients with low risk scores [median time = 2.7 and 4.9 years, log-rank p = 7.47e-05, HR = 1.736 (1.321, 2.281)] (Figure 5D). The AUCs for the 1-, 3-, and 5-year ROC curves were 0.715, 0.678, and 0.669, respectively (Figure 5E). The same analysis was conducted for PFS and DSS. The higher the risk score, the shorter the PFS [median time = 3 and 15 years, log-rank p = 0.000205, HR = 1.733 (1.296, 2.317)]. The AUCs for PFS predicted by 1-, 3-, and 5-year ROC curves were 0.614, 0.607, and 0.519, respectively (Supplementary Figures 2A–C). The DSS of patients with high expression of HNSCC was lower than that of patients with low expression [median time = 6.7 and 15 years, log-rank p = 0.000433, HR = 1.91 (1.332, 2.738)]. The AUCs for the 1-, 3-, and 5-year ROC curves were 0.613, 0.639, and 0.526, respectively (Supplementary Figures 2D–F). Thus, the results of the DRG-related risk scoring model showed a significant correlation with the survival rate of HNSCC patients.
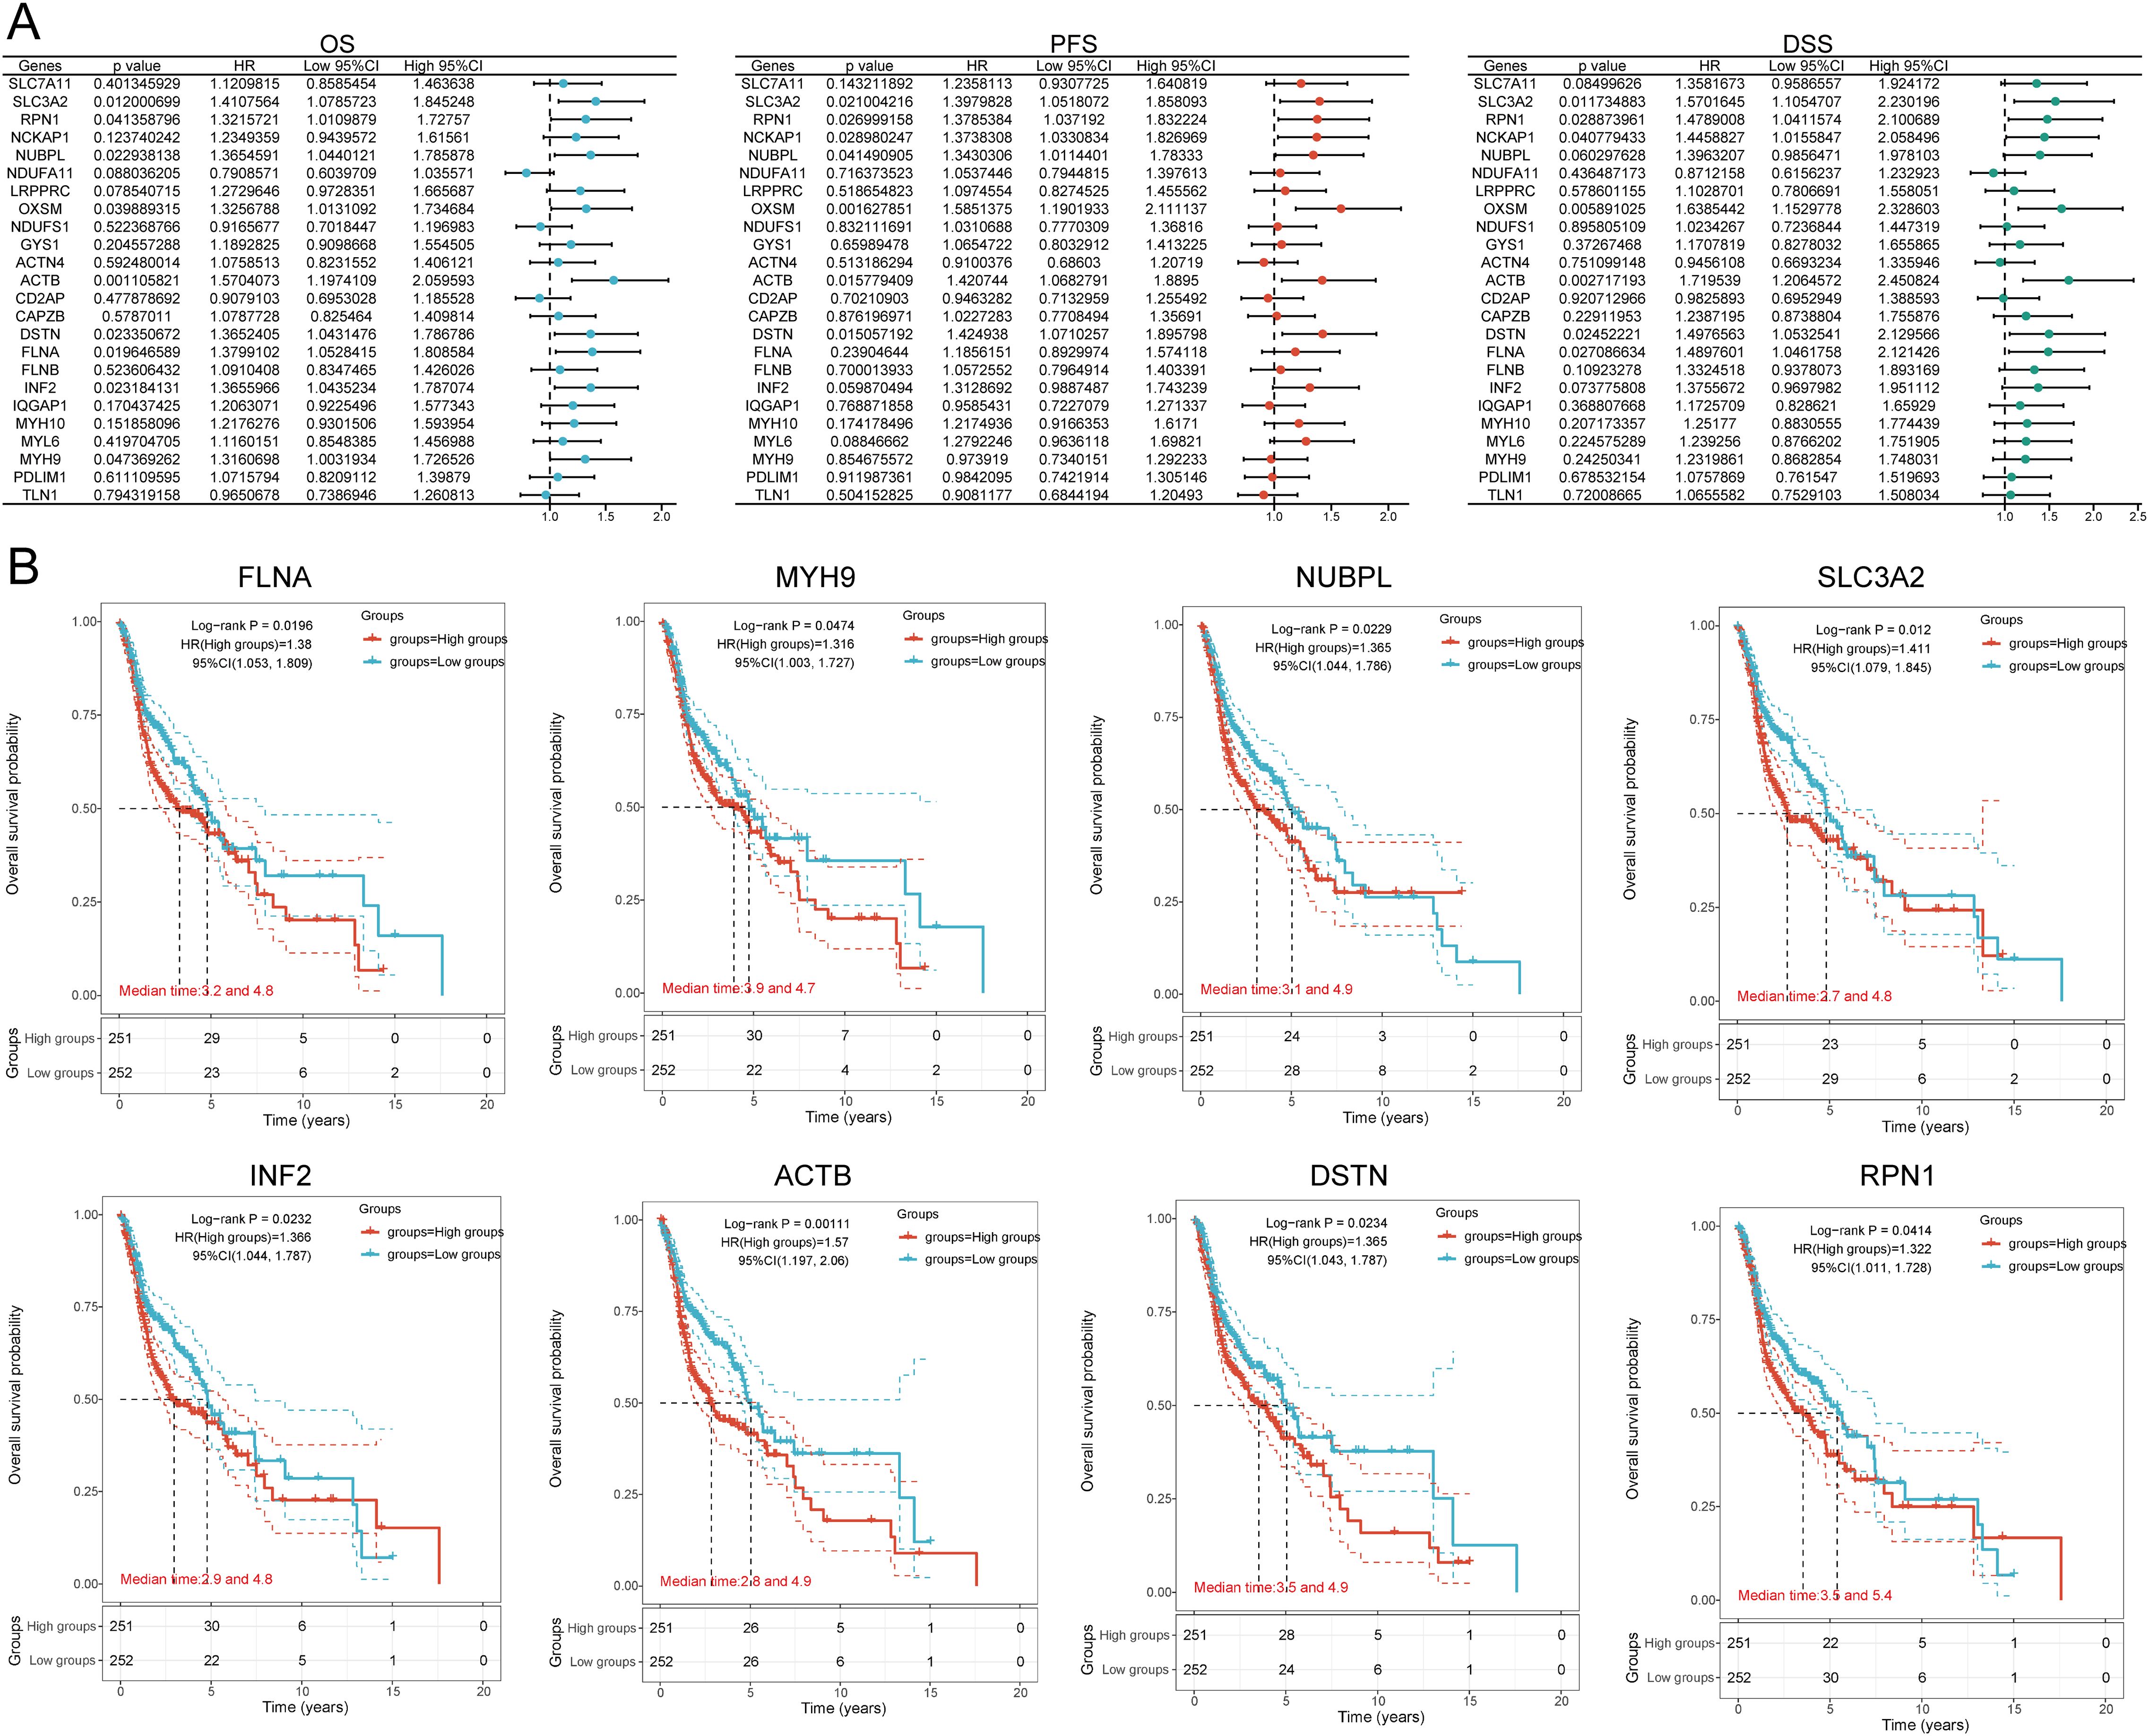
Figure 4. Prognostic value analysis of 24 DRGs expressions. (A) Univariate Cox regression analysis plots. (B) Prognostic value of the eight prognostic DRGs in high and low expression groups among HNSCC patients.
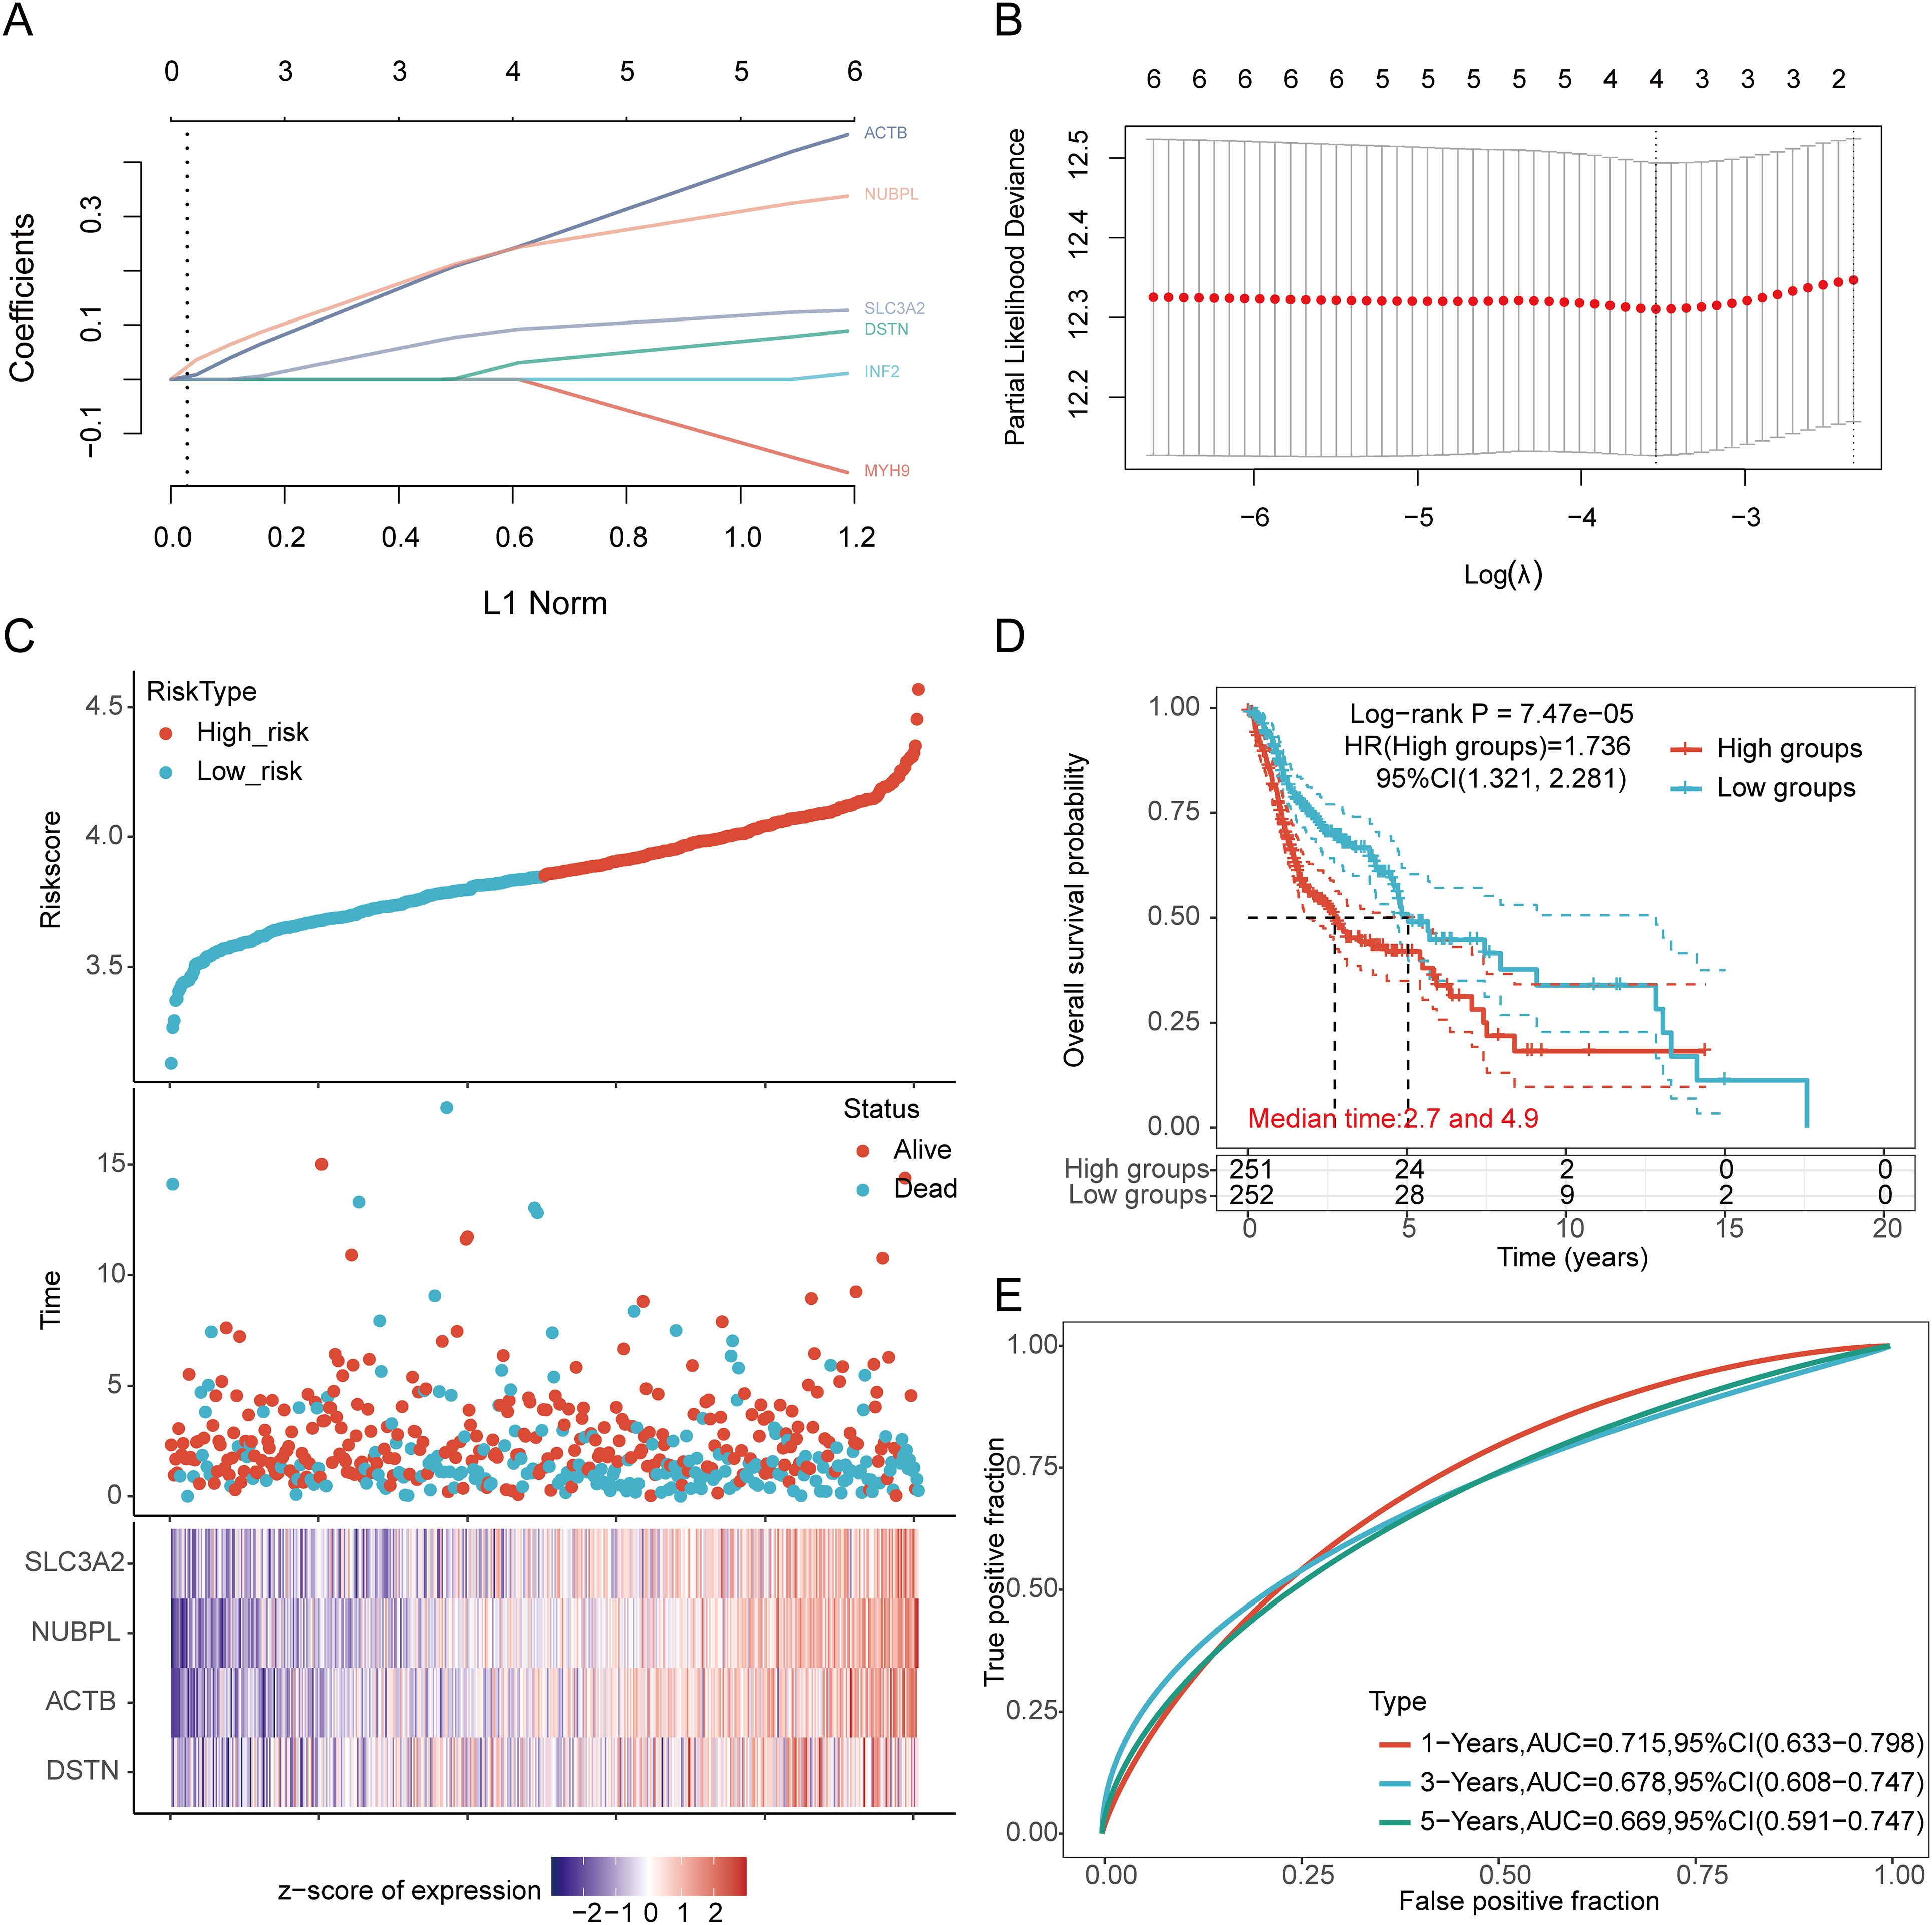
Figure 5. Construction of a prognostic model with the help of DRGs in HNSCC tissue. (A) LASSO coefficient curve of four DRGs. (B) Plots of the ten-fold cross-validation error rates. (C) Distribution of risk score, survival status, and expression of prognostic DRGs in HNSCC patients. (D) Overall survival curve of HNSCC patients in high/low-risk groups. (E) Time-dependent ROC curve for 1-, 3-, and 5-year OS for DRGs.
3.5 External validation of the DRGs prognostic signatureWe further validated the expression levels and diagnostic efficacy of prognostic DRGs using the GEO database. Compared with the low expression group, the expression levels of prognostic DRGs in the high expression group were significantly upregulated in the GSE30784 and GSE53819 datasets. In dataset GSE30784, the AUC values of SLC3A2, NUBPL, ACTB, and DSTN were 0.882, 0.631, 0.678, and 0.645, respectively (Figure 6A). In dataset GSE53819, the AUC values of SLC3A2, NUBPL, ACTB, and DSTN were 0.880, 0.750, 0.830, and 0.713, respectively (Figure 6B). The four prognostic DRGs (SLC3A2, NUBPL, ACTB, and DSTN) consistently showed good sensitivity and specificity in diagnosing HNSCC. To verify the predictive value of the four-gene signature, the GSE41613, GSE65858, and GSE85446 datasets were used as external validation cohorts. We calculated the risk scores for each patient using the same formula, consistent with the results of the TCGA cohort. The distribution of risk scores, survival time, and DRG expression in each HNSCC patient is shown in Figure 6C. In the validation set, OS was significantly worse in patients with the high-risk group compared to those with the low-risk group (p = 0.003, p = 0.021, p < 0.001) (Figure 6D). The AUCs for 1-year, 3-year, and 5-year OS were 0.681, 0.662, and 0.676 in the GSE41613 dataset, respectively. The AUCs for 1-year, 3-year, and 5-year OS were 0.604, 0.626, and 0.632 in the GSE85446 dataset, respectively. The AUCs for 1-year, 3-year, and 5-year OS were 0.619, 0.673, and 0.603 in the GSE65858 dataset, respectively (Figure 6E). To sum up, these results confirm the effectiveness of our risk scoring model. The four-gene signature can predict survival rates in HNSCC. Taken together, these results confirm the validity of our risk score model, and that the DRGs prognostic signature can predict OS in HNSCC.
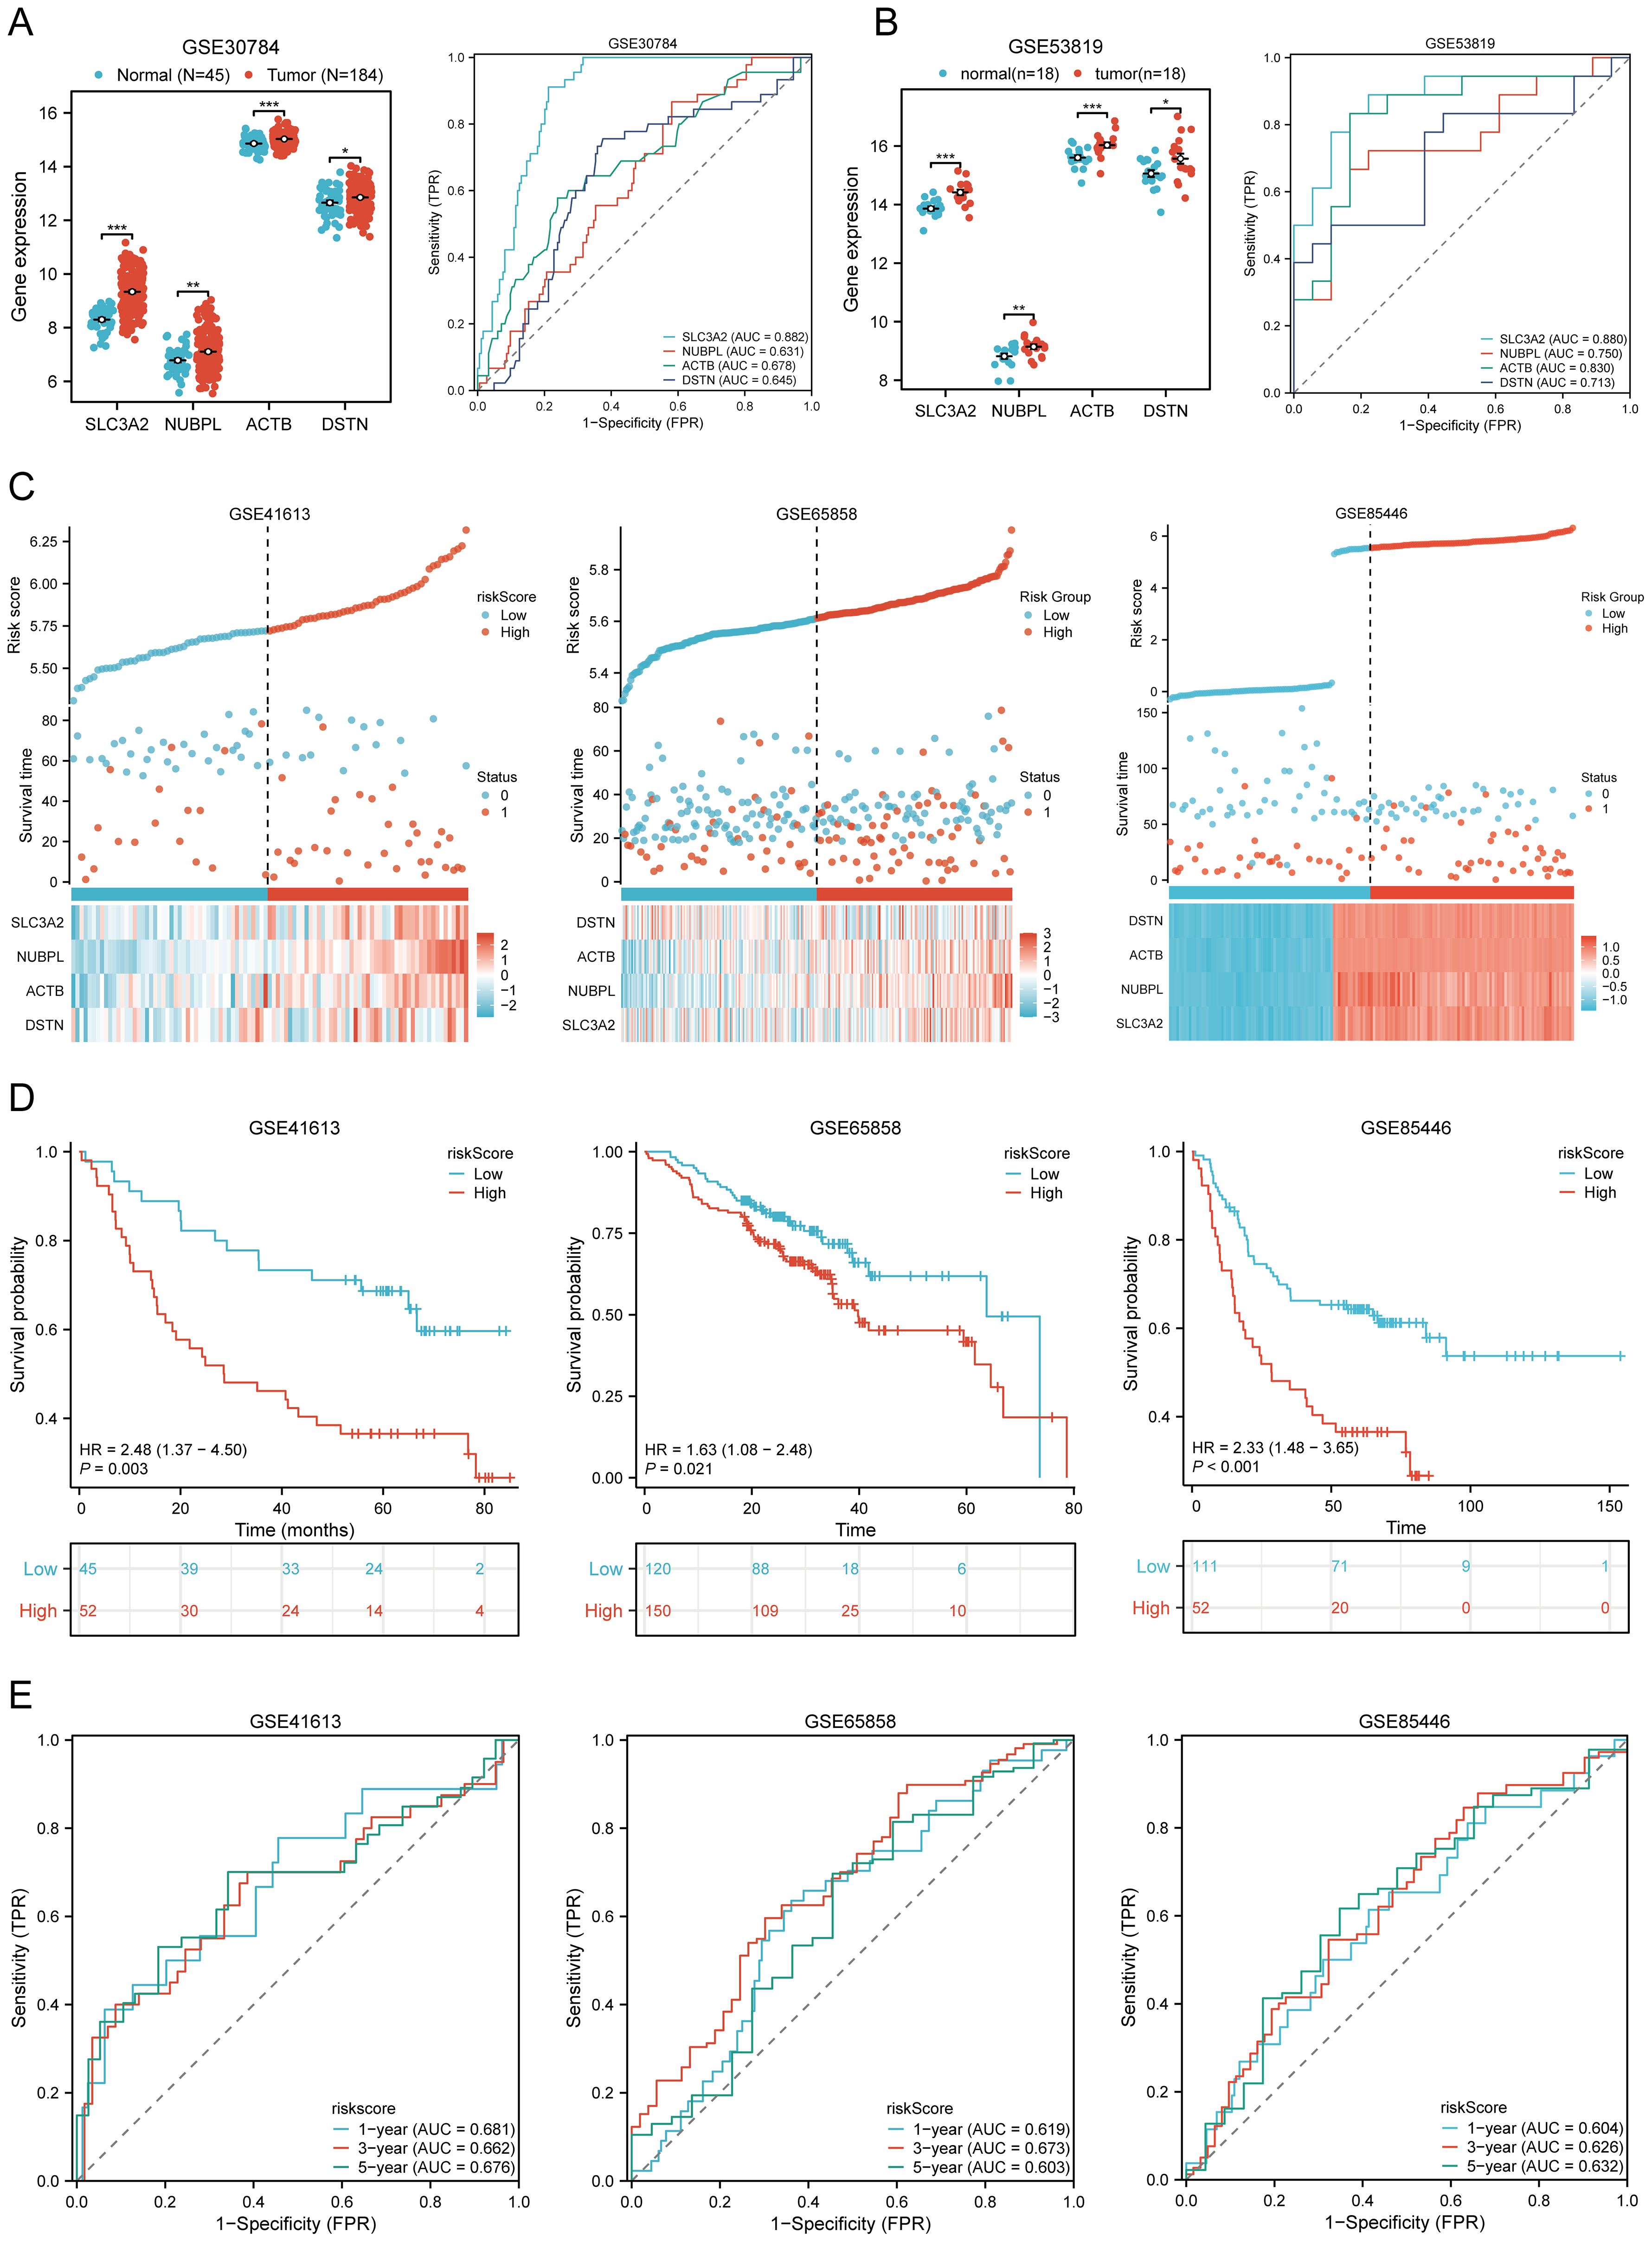
Figure 6. Prognostic value of DRGs signature in HNSCC patients. (A, B) The mRNA expression of prognostic DRGs and ROC curves to evaluate the ability of the prognostic DRGs expression to diagnose HNSCC in GSE12452 (A), GSE53819 (B) dataset. (C) Distribution of risk score, survival status, and expression of prognostic DRGs for patients in low- and high-risk groups in GSE41613, GSE65858, GSE85446 dataset. (D) Risk score and survival probabilities in GSE41613, GSE65858, GSE85446 dataset. (E) Time-dependent ROC curve analyses of risk score in GSE41613, GSE65858, GSE85446 dataset. *p<0.05, **p<0.01, ***p<0.001.
3.6 Clinical correlation analysisBased on the above-mentioned prognostic signature, we explored the survival analysis of clinical pathological features between high-risk and low-risk groups (Supplementary Table 4). Subgroup survival analysis showed that the high-risk group significantly affected the overall survival time of patients who were Age > 60 (p < 0.001, HR = 2.17 (1.50 − 3.14)), Female (p < 0.001, HR = 2.58 (1.52 − 4.37)), Male (p = 0.013, HR = 1.51 (1.09 − 2.10)), White (p < 0.001, HR = 1.74 (1.30 − 2.34)), Grade 1-2 (p = 0.008, HR = 1.55 (1.12 − 2.14)), Grade 3-4 (p = 0.010, HR = 2.10 (1.20 − 3.67)), Stage III-IV (p < 0.001, HR = 1.80 (1.33 − 2.43)), M0 Status (p < 0.001, HR = 1.78 (1.34 − 2.35)), N0 Status (p = 0.020, HR = 1.61 (1.08 − 2.40)), N1-3 Status (p < 0.001, HR = 2.07 (1.40 − 3.04)), T3-4 Status (p < 0.001, HR = 1.87 (1.32 − 2.63)), Neoadjuvant N0 (p < 0.001, HR = 1.69 (1.28 − 2.23)), Smoking Yes (p < 0.001, HR = 1.87 (1.32 − 2.63)) (Supplementary Figures 3A–M). However, factors such as Age <= 60 (p = 0.107, HR = 1.41 (0.93 − 2.14)), Asian + Black (p = 0.484, HR = 0.75 (0.33 − 1.69)), Stage I-II (p = 0.246, HR = 1.50 (0.76 − 2.95)), Neoadjuvant Yes (p = 0.152, HR = 4.81 (0.56 − 41.07)), Radiation N0 (p = 0.870, HR = 0.93 (0.39 − 2.20)), Radiation Yes (p = 0.061, HR = 1.77 (0.97 − 3.23)), Smoking N0 (p = 0.184, HR = 1.51 (0.82 − 2.75)), and T1-2 Status (p = 0.104, HR = 1.48 (0.92 − 2.39)) were not significantly associated with the overall survival time of HNSCC patients (Supplementary Figures 4A–H). This suggests that these factors play an important role in determining the survival outcomes of patients with HNSCC and should be considered when developing treatment strategies.
3.7 Establishment and validation of a predictive nomogramWe first performed univariate and multivariate Cox analyses to establish a predictive nomogram that integrates the DRGs risk score with other prognosis-related clinical factors. In univariate Cox regression analysis, M status (HR = 4.819, 95% CI = 1.775 - 13.083, p = 0.002), Stage (HR = 0.568, 95% CI = 0.394 - 0.821, p = 0.003), and risk score (HR = 0.576, 95% CI = 0.438 - 0.757, p < 0.001) were associated with OS in HNSCC patients. In multivariate Cox regression analysis, M status (HR = 3.919, 95% CI = 1.414 - 10.861, p = 0.009), Stage (HR = 0.560, 95% CI = 0.373 - 0.841, p = 0.005), and risk score (HR = 0.534, 95% CI = 0.403 - 0.709, p < 0.001) were shown to be independent predictors of OS in HNSCC patients (Supplementary Table 5). The risk score, M status, and Stage were then integrated to construct a nomogram for predicting 1-, 3-, and 5-year OS in HNSCC patients. The results of the predictive nomogram showed that 1-, 3-, and 5-year OS [C-index: 0.613 (0.594-0.633)] (Figure 7A), PFS [C-index: 0.603 (0.583-0.623)] (Supplementary Figures 5A–E), and DSS [C-index: 0.645 (0.622-0.669)] (Supplementary Figures 6A–E). The AUC values for 1-, 3-, and 5-year ROC curves were 0.630, 0.638, and 0.599, respectively (Figure 7B). Calibration curves showed good consistency between predicted and observed values, especially for 3-year OS (Figure 7D) and time-dependent AUC curves (Figure 7F). Finally, we performed DCA curves to assess the clinical utility of the nomogram, indicating its value in predicting survival rates (Figure 7H). In the GEO validation cohort, the AUC values for 1-, 3-, and 5-year OS were 0.625, 0.620, and 0.608, respectively (Figure 7C). Calibration curves and the time-dependent AUC for the nomogram model also maintained good performance in predicting patient OS (Figures 7E, G). DCA showed that the nomogram also provided clinical net benefits (Figure 7I). Thus, in both the TCGA cohort and GEO external validation cohort, the nomogram incorporating DRG risk score and clinical characteristics (M status and Stage) appears to accurately predict short-term and long-term OS in HNSCC patients. Overall, these results indicate that the constructed nomogram has predictive accuracy for the prognosis of HNSCC patients and may bring significant clinical benefits.
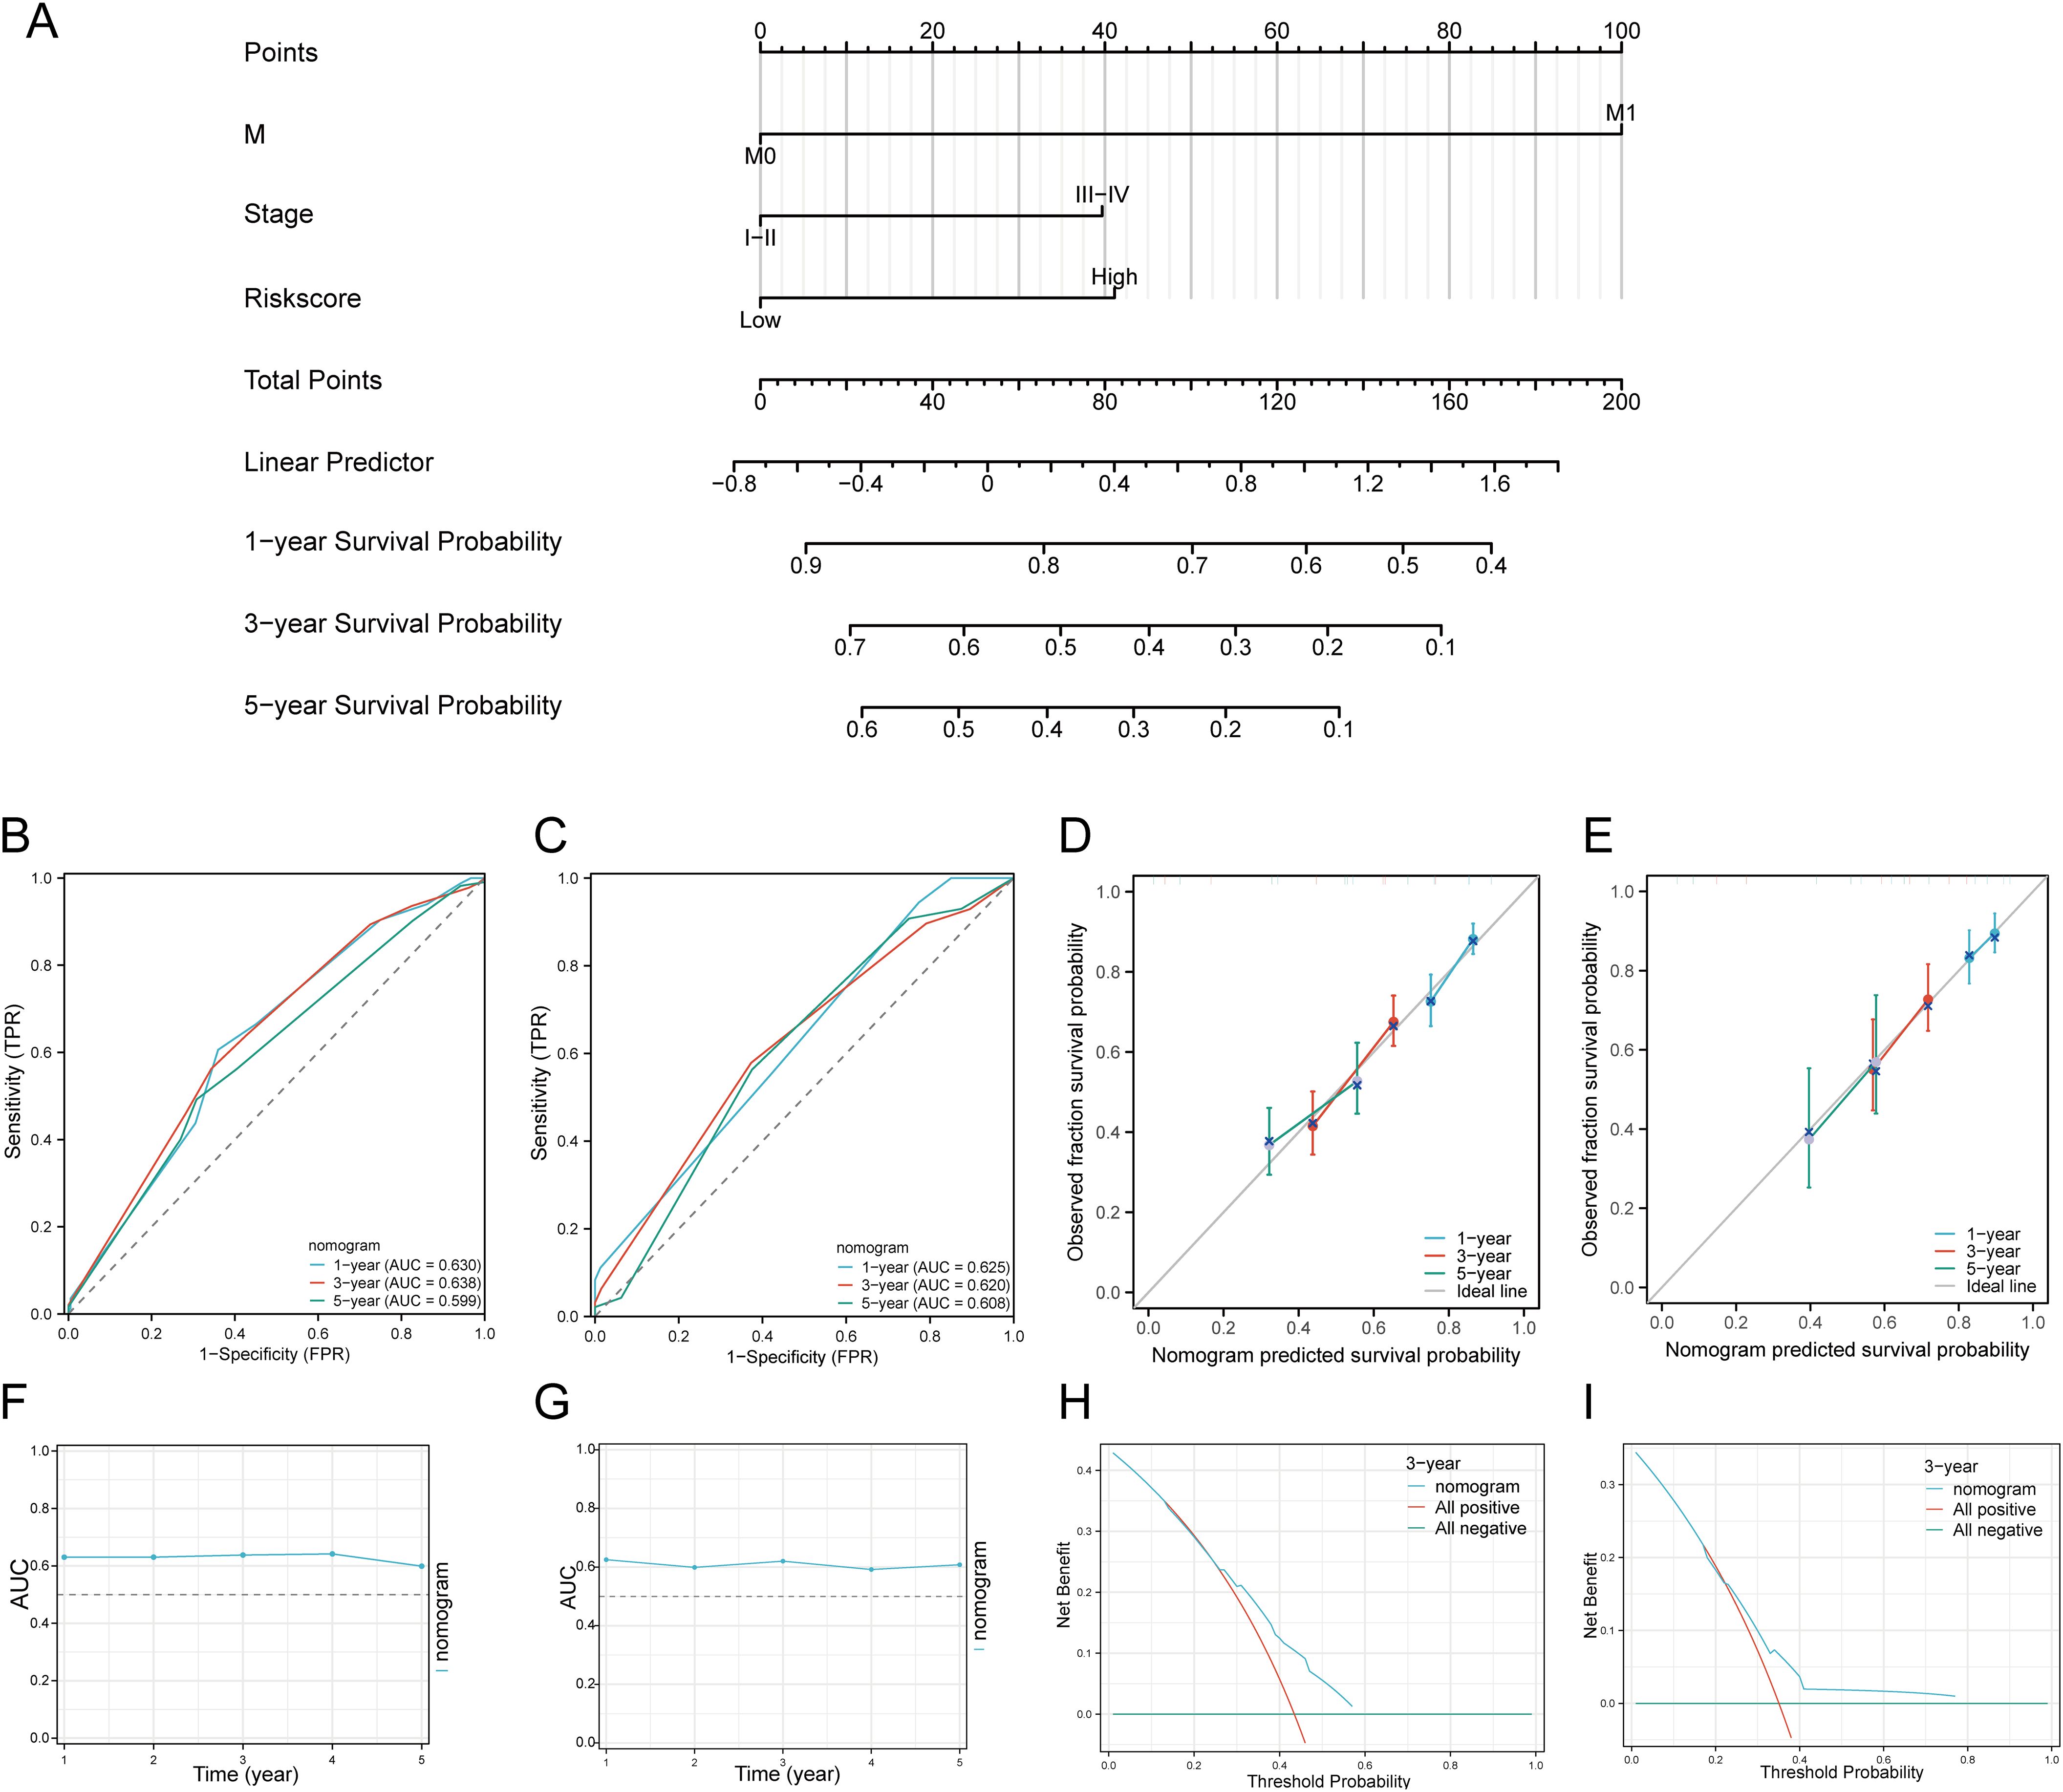
Figure 7. Construction of a predictive nomogram. (A) Nomogram for predicting 1-, 3-, and 5-year OS of HNSCC patients. (B, C) ROC curves for predicting 1-, 3-, and 5-year OS in the TCGA and GEO datasets. (D, E) Calibration curve of OS nomogram model in the discovery group in the TCGA and GEO datasets. (F, G) Time-dependent AUC curve shows the nomogram to predict OS performance in the TCGA and GEO datasets. (The diagonal dotted line represents the ideal nomogram). (H, I) DCA curves for the nomogram in the TCGA and GEO datasets.
3.8 Association of tumor immune cell infiltration with the disulfidptosis-related prognostic signature in HNSCCWe used six algorithms to observe the differences in immune cells between C1 and C2 subtypes of HNSCC samples. The QUANTISEQ algorithm showed significant differences in Macrophage M2 (P = 0.004), Monocyte (P = 3.14E-07), Macrophage M1 (P = 0.004), B cell (P = 0.0457), T cell regulatory (Tregs) (P = 5.15E-07), Neutrophil (P = 2.77E-07), and uncharacterized cell (P = 0.0004) between the two subtypes (Figures 8A, B). Further analysis using the QUANTISEQ algorithm found significant associations between risk scores and various immune cell populations. Risk scores were negatively correlated with B cells (P = 4.44E-11, Cor = -0.2880), Monocytes (P = 7.49E-08, Cor = -0.2368), T cells CD8+ (P = 2.63E-09, Cor = -0.2612), uncharacterized cells (P = 0.0155, Cor = -0.1079), and Myeloid dendritic cells (P = 0.0011, Cor = -0.1455), and positively correlated with Macrophage M1 (P = 8.39E-10, Cor = 0.2700), NK cells (P = 0.0048, Cor = 0.1253), and T cells CD4+ (non-regulatory) (P = 0.0003, Cor = 0.1616) (Figure 8C). Similarly, significant differences in the distribution of immunologic infiltration scores between C1 and C2 subtypes were also observed using the TIMER, xCell, MCP-counter, CIBERSORT, and EPIC algorithms (Supplementary Figures 7A–E). There was also a correlation between risk scores and various immune cell populations (Supplementary Figures 8A–E). It has been reported that immune infiltration may affect patient prognosis. Therefore, we conducted a survival analysis of the different types of immune cells mentioned above and found that high infiltration levels of B cells, NK cells, Macrophage M2, T cells CD8+, and Tregs were associated with good prognosis, while high infiltration levels of Macrophage M1, Neutrophils, and T cells CD4+ (non-regulatory) were associated with lower OS rates (Figure 8D). Considering the differences in immune cell infiltration, we further analyzed the correlation between the risk score model and three ESTIMATE scores. The analysis showed a significant negative correlation between the risk score and ImmuneScore (P < 0.001, Cor = -0.236), and a positive correlation with StromalScore (P = 0.015, Cor = 0.109), but no significant correlation with ESTIMATE scores (P = 0.068, Cor = -0.081) (Figure 8E).
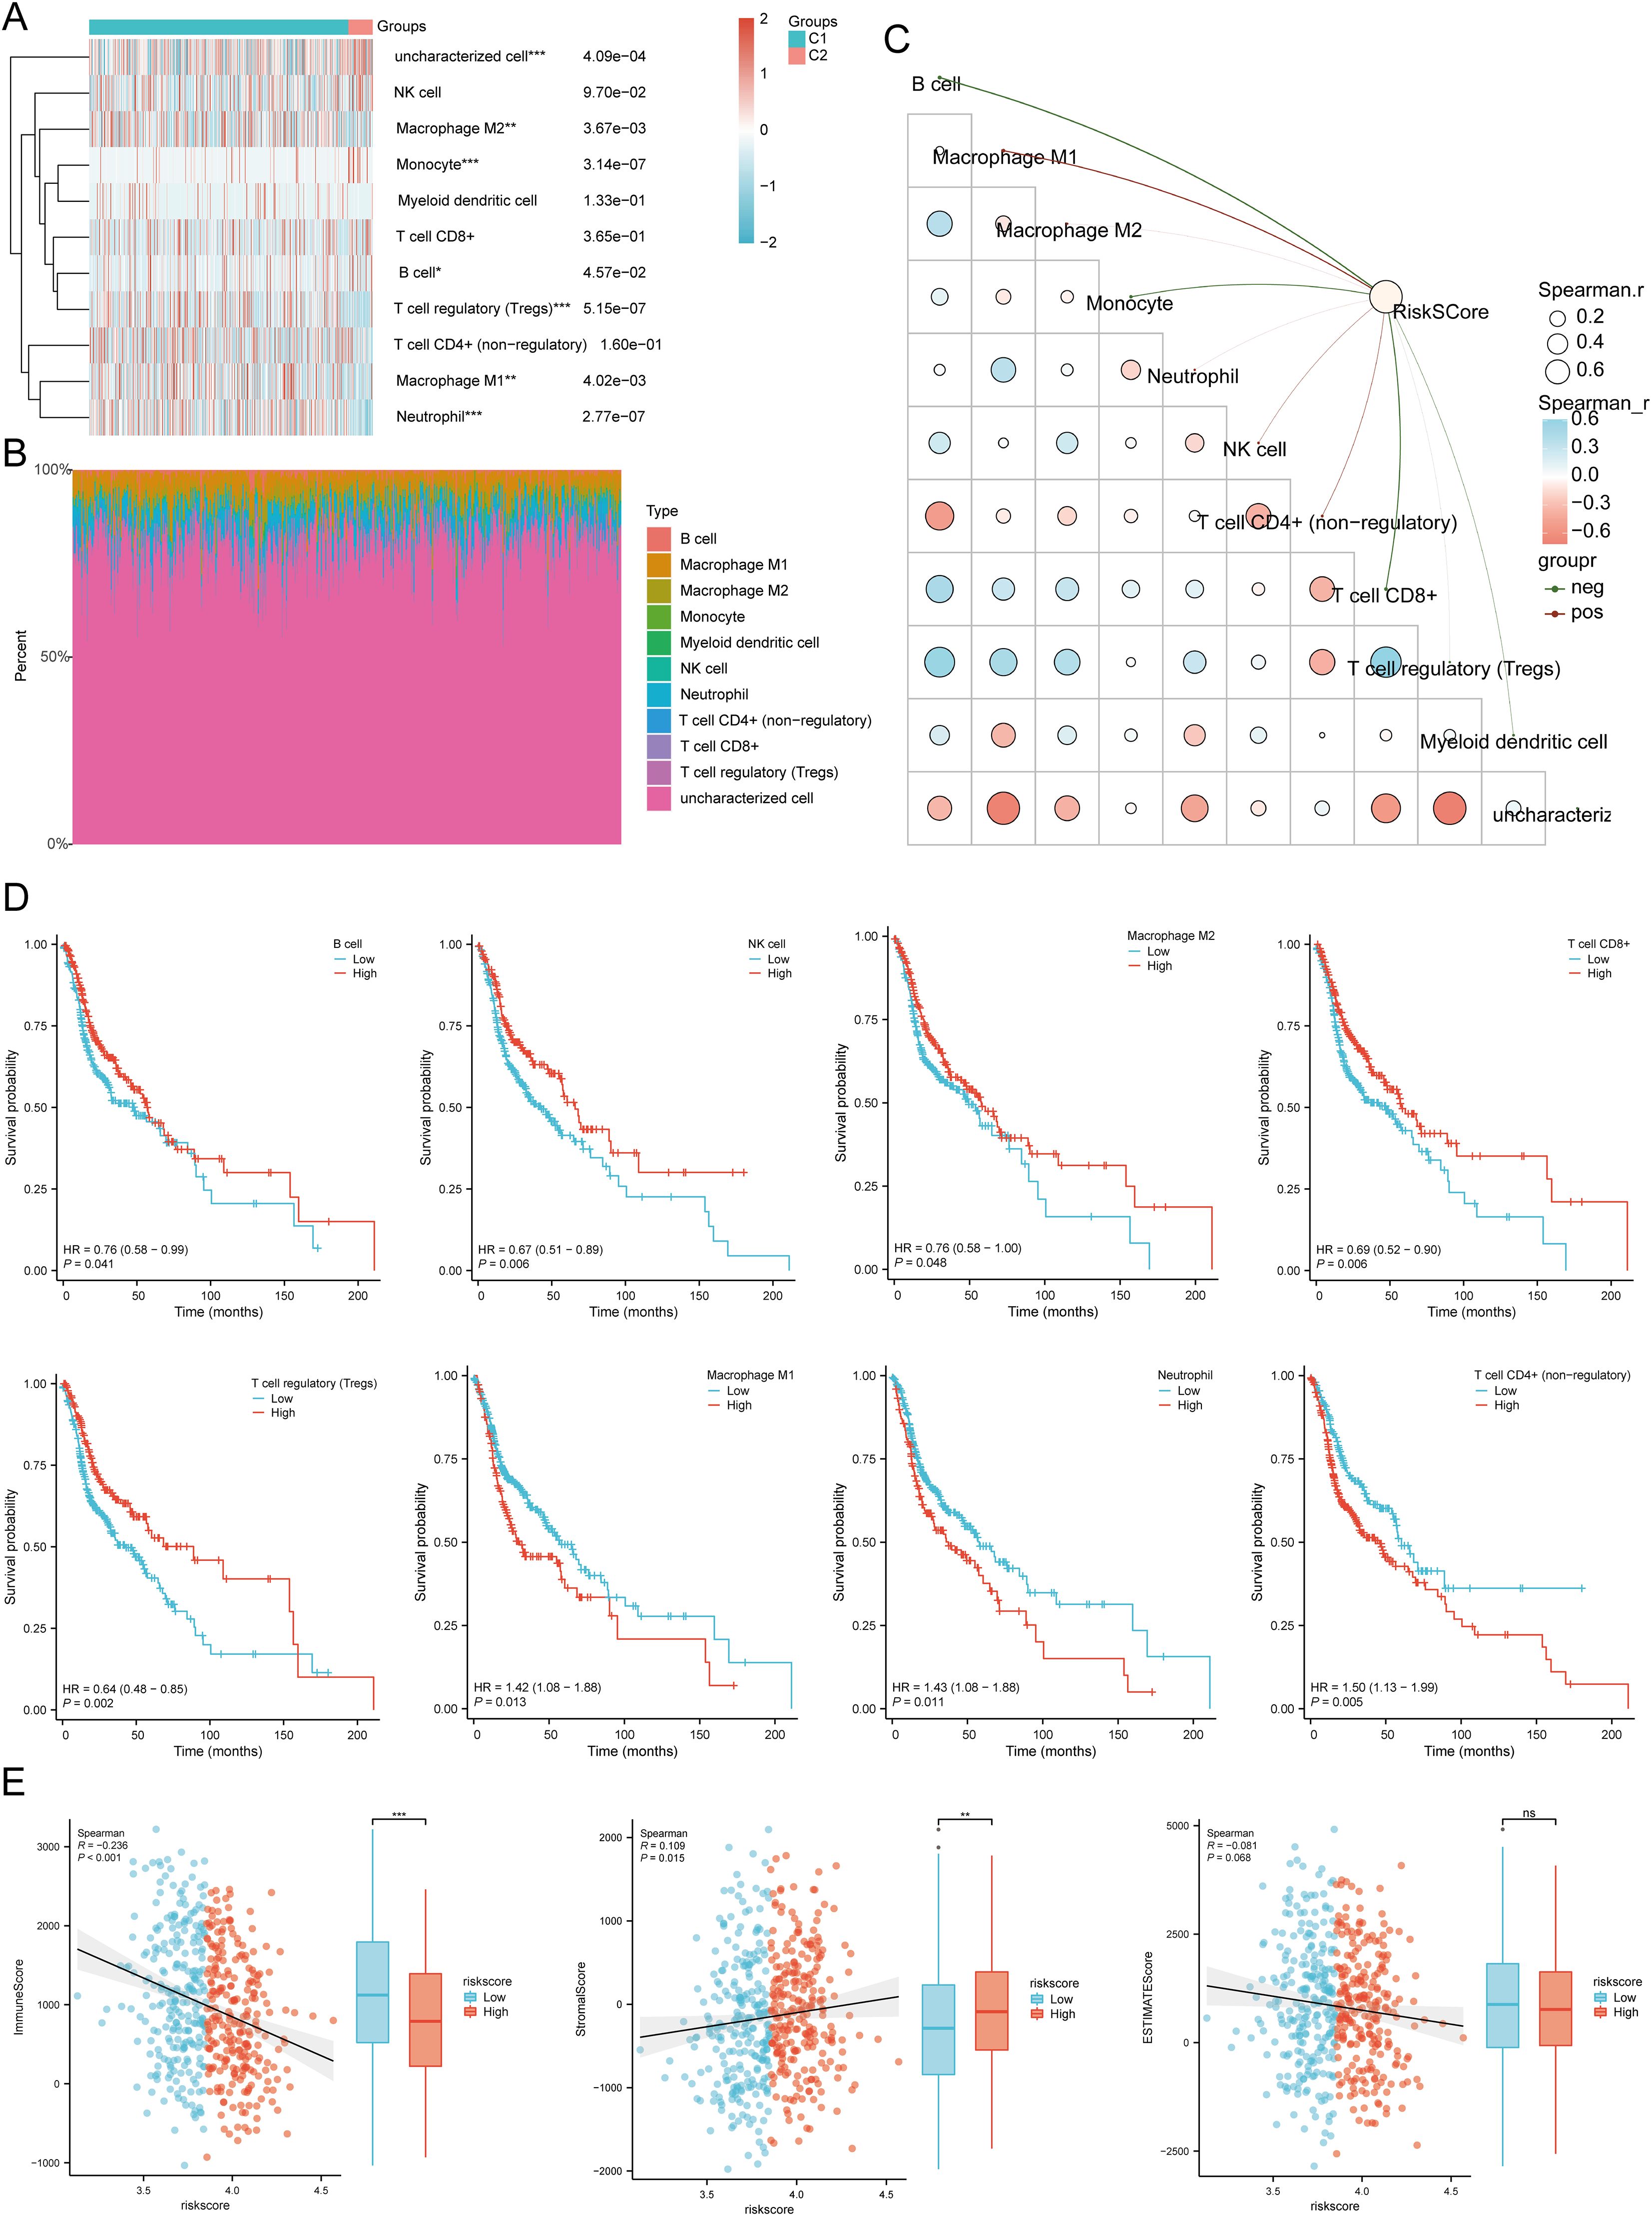
Figure 8. Relationship between the expression level of DRGs and immune infiltration in the tumor microenvironment. (A, B) Comparison of immune scores between C1 and C2 subtypes in TCGA (QUANTISEQ); the abscissa represents the type of immune cell infiltration, and the ordinate represents the distribution of the immune infiltration score in different groups. (C) The correlation analysis between Riskscore and immunoscore (QUANTISEQ). (D) The relationship between the level of immune cell infiltration and survival rate, including B cells, NK cells, macrophages M2, T cell CD8+, T cell regulatory (Tregs), Macrophage M1, Neutrophil, T cell CD4+ (non-regulatory). (E) Correlation between Riskscore and three ESTIMATE, and Differences in ESTIMATE between the high and low expression groups of the four prognostic DRGs in HNSCC. *p<0.05, **p<0.01, ***p<0.001.
Using the ssGSEA method, immune cell infiltration between high and low expression groups of SLC3A2, NUBPL, ACTB, and DSTN was analyzed (Supplementary Figure 9A). In addition, in the low-risk score group, the expression levels of aDC, B cells, CD8 T cells, Cytotoxic cells, DC, Mast cells, NK CD56dim cells, pDC, T cells, TFH, and Th17 cells were higher than those in the high-risk score group. However, Eosinophils, Macrophages, Neutrophils, NK cells, Tcm, Tgd, Th1 cells, and Th2 cells were expressed at higher levels in the high-risk score group, with statistical differences (Supplementary Figure 9B). Correlation analysis showed that SLC3A2 expression was positively correlated with Tgd and negatively correlated with Cytotoxic cells, T cells, B cells, and CD8 T cells; NUBPL expression was positively correlated with T helper cells, NK cells, Tcm, and Th2 cells, and negatively correlated with Cytotoxic cells, PDC, NK CD56dim cells, and T cells; ACTB expression was positively correlated with Macrophages, Tgd, Th1 cells, Neutrophils, and Th2 cells, and negatively correlated with B cells, NK CD56bright cells, PDC, and CD8 T cells; DSTN expression was positively correlated with Tgd and negatively correlated with Cytotoxic cells, T cells, B cells, and NK CD56dim cells (Supplementary Figure 9C). In addtion, TIMER database analysis showed that SLC3A2 was positively correlated with B cells, CD4+ T cells, neutrophils, macrophages and dendritic cells. NUBPL was positively correlated with tumor purity, neutrophils. ACTB was positively correlated with tumor purity, B cells, CD4+ T cells, CD8+ T cells, neutrophils, macrophages and dendritic cells. DSTN was also positively correlated with B cells, CD4+ T cells, CD8+ T cells, neutrophils, macrophages and dendritic cells in HNSCC (Supplementary Figure 9D). These results showed a significant correlation between DRGs and tumor immune infiltration, indicating potential targets for immunotherapy.
3.9 Immunotherapy response analysisWe analyzed the differences in expression between the two subtypes based on eight immune checkpoint-related genes. The results showed significant differences in the expression levels of CD274 (P < 0.01), LAG3 (p < 0.01), PDCD1LG2 (p < 0.001), and SIGLEC15 (p < 0.01) between the two subtypes. In group C1, the expression levels of CD274, PDCD1LG2, and SIGLEC15 were higher than those in group C2, with statistical significance (Figure 9A). We then explored the expression distribution of immune checkpoint-related genes in high and low risk score groups. The results showed significant differences in LAG3, PDCD1, PDCD1LG2, TIGIT, and SIGLEC15 between the high and low risk score groups (Figure 9B). Further analysis of the relationship between the expression of prognostic DRGs and immune checkpoint members in the TCGA database showed that the risk score was positively correlated with PDCD1LG2 (P = 7.6256E-08, Cor = 0.2369), SIGLEC15 (P = 0.0140, Cor = 0.1095), and CTLA4 (P = 0.0152, Cor = -0.1081). It was negatively correlated with LAG3 (P = 0.0002, Cor = -0.1659), PDCD1 (P = 1.1598E-06, Cor = -0.2148), and TIGIT (P = 0.0001, Cor = -0.1699) (Figure 9C). Survival analysis of immune checkpoint members showed that high levels of CTLA4 (p < 0.001, HR = 0.58 (0.44 - 0.76)), PDCD1 (p = 0.009, HR = 0.70 (0.53 - 0.91)), TIGIT (p = 0.001, HR = 0.64 (0.49 - 0.84)), and LAG3 (p = 0.046, HR = 0.76 (0.58 - 0.99)) were associated with good prognosis, while CD274 (p = 0.049, HR = 1.31 (1.00 - 1.72)) was associated with lower OS rates (Figure 9D). Additionally, we used the TIDE database and GSE91061, GSE135222, GSE78220, IMvigor210 datasets to predict the response of DRGs to immunotherapy. The results showed that the prediction of response rates to immunotherapies in patients with low risk scores was higher than that in the high risk group (p < 0.05) (Figure 9E). The low risk score group responded better to immune checkpoint blocking than the high risk score group (Figure 9F). TIDE Dysfunction scores were elevated in the low group (Figure 9G), and TIDE Exclusion scores were lower in the low group (Figure 9H). In the GSE91061, GSE135222, GSE78220, and IMvigor210 datasets, the AUC results further confirmed the accuracy of DRG expression in predicting immune response, with AUC values of 0.737, 0.849, 0.774, and 0.612, respectively (Figures 9I–L). To confirm the predictive role of DRGs risk score in immune therapy response in clinical tissue samples of HNSCC, 36 advanced HNSCC patients receiving anti-PD-1/PD-L1 therapy were analyzed. The results indicated that the expression of the four prognostic DRGs was lower in patients who achieved complete or partial remission (CR/PR). The AUC values of SLC3A2, NUBPL, ACTB, and DSTN were 0.727, 0.610, 0.769, and 0.788, respectively (Figure 9M). The low-risk group based on the prognostic model had a higher proportion of patients in the CR/PR group, with an AUC value of 0.723 for the risk score (Figure 9N). Therefore, DRGs risk score has significant potential in predicting immune therapy response, suggesting that patients with a low DRGs risk score may be more sensitive to ICI treatment. Overall, these results imply that DRGs low-risk score groups are more likely to have an immune response and respond to immunotherapy.
留言 (0)