
記住我


The global impact of the COVID-19 pandemic caused by SARS-CoV-2 has been profound, affecting nations, including India, with over 45 million cases and 533,300 deaths1. Understanding the distinct waves of the disease is crucial for an effective response2. Traditional methods focus on symptomatic cases, leaving pre-symptomatic and asymptomatic infections undetected3,4, casting doubt on solely relying on clinical surveys5.
Research has revealed that SARS-CoV-2 is excreted in various bodily fluids, including saliva, sputum, and faeces, introducing the virus into sewage water6-8. Analyzing wastewater becomes pivotal due to high viral loads in the gastrointestinal tract, supplementing respiratory-based testing8,9. Wastewater-based epidemiology (WBE) has gained recognition globally, offering real-time insights into COVID-19 transmission10. Wastewater-based epidemiology enables early detection of SARS-CoV-2 RNA, often preceding clinical cases, proving effective even in low-prevalence scenarios, serving as a sensitive tool for monitoring virus circulation and detecting early stages of outbreaks3,6,11.
In India, only Ahmedabad, Bangalore, Jaipur, Chennai, and Pune conducted sequencing-based SARS-CoV-2 surveillance5,10,12-14. For instance, the presence of B.1.617.2 in Jaipur in early March 2021 correlated with local clinical patient data12. However, Mumbai City relied solely on RT-PCR-based wastewater surveillance, lacking active sequencing-based surveillance15,16. This study aimed to fill the gap through genomic surveillance in Mumbai’s densely populated slums. Over 11 months, genomic surveillance of drains and sewage revealed temporal variations in SARS-CoV-2 RNA concentration, correlating with active COVID-19 cases and enabling early detection. The study identified predominant variants, advancing understanding of the virus’ behaviour and evolution within communities. This approach enhances public health measures in densely populated and resource-limited settings, contributing to global efforts to control and mitigate the impact of the ongoing pandemic.
Materials & Methods Wastewater sample collection and RNA isolationWastewater samples were systematically collected twice weekly from eight open drain sites in Mumbai’s slums [Dharavi: (D1, D2, D3), Kherwadi: (K4, K5), Behrampada: (B6, B7), Siddharth Nagar: (S8)] between August 17, 2022 and June 19, 2023. This was done with permission from the Municipal Corporation of Greater Mumbai (MCGM) and following guidance from the National Institute of Virology’s (NIV) polio surveillance programme. The collection sites were selected based on major slum locations in consultation with MCGM. To expand the analysis citywide, two new collection sites at sewage treatment plants (STPs) – Bandra STP and Worli STP – were introduced in March 2023. The Institutional Research Ethics Committee granted a waiver from ethics approval, as the study did not directly involve human participants. Additionally, the Institutional Biosafety Committee approved handling the live virus.
Sampling was conducted using 500 ml polypropylene bottles, with 400 ml collected between 8 AM and 11 AM to ensure efficient recovery. After sealing, bottles were wiped with 70% ethanol, placed in ziplock bags, and stored in an ice-packed cooler. Samples were processed within 24 h at a Biosafety Level 2 facility to obtain near real-time information on viral concentrations in sewage. Following pasteurization at 60°C for 1 h, 45 ml of wastewater (in duplicates) was centrifuged at 5,000 x g for 10 min at 4°C. The 40 ml supernatant was filtered first through two Whatman Grade 1 filter papers and then through a 0.22 μm PES membrane filter. The filtrate solution was combined with 3.2 g of PEG (8,000 MW) and 0.68 g of NaCl (1.7%) in a sterile 50 ml falcon bottle and incubated for 16 h at 48°C until PEG completely dissolved (SOP provided by Science and Engineering Research Board-SERB, https://serb.gov.in/ ).
After PEG dissolution, the solution was centrifuged at 10,000 rpm for 30 min at 4°C. Following supernatant removal, 140 μl of elution (TE) buffer was added to resuspend the pellets; one set of resuspended pellets was stored at -80°C for future use. The solution was vortexed to dissolve the pellets, and viral RNA was isolated using the QiaAmp viral RNA mini kit (Qiagen GmBH, Hilden, Germany) following the manufacturer’s protocol.
SARS-CoV-2 RT-qPCR detectionReal-time quantitative PCR (RT-qPCR) was conducted using the Bio-Rad CFX96 system (Bio-Rad, California, USA) and GenePath Dx CoViDx One v2.1.1TK kit (GenePath Diagnostics), targeting SARS-CoV-2 specific genes (N, RdRp, E). The kit provided qualitative outcomes, and viral load quantification was done using the COVID-19 viral load Calculation tool (RUO). Each sample was tested in duplicate to reduce false negatives, with any replicate positive for at least two genes considered positive. Tap water served as the negative control.
SARS-CoV-2 genome amplification and sequencingPositive samples with Ct values lower than 35-40 (before February 2023 <35, after was <40) were sequenced either by Illumina (n=38) or OxfordNanopore (n=85) sequencing. Pooled libraries were prepared using the Illumina COVIDSeq protocol for Illumina sequencing. cDNA was amplified using ARTIC primers in two pools, followed by sequencing on the NextSeq™ 2000 platform (Illumina, California) with 116 bp read length.
Nanopore sequencing used LunaScript RT SuperMix Kit (New England Biolabs) for cDNA synthesis and MIDNIGHT primers for amplification. Barcoding and adaptor ligation followed the rapid MIDNIGHT Protocol, and sequencing was performed on the MinION MK1B with the SpotON flow cell.
Early warning SARS-CoV-2 detection strategyA correlation analysis between viral RNA concentrations in wastewater and positive cases in the city was done to generate an early warning for impending SARS-CoV-2 waves.
Bioinformatics pipeline and analysesWastewater samples comprised a mix of actively circulating (sub-)variants. The raw reads were aligned to the SARS-CoV-2 reference genome (NC_045512.2) using the Burrows-Wheeler Alignment tool (BWA) MEM17. Coverage statistics were obtained using SAM tools18 and primer trimming for Illumina sequenced samples was performed with iVar19. Aligned reads were used for single nucleotide variants (SNVs) and INDELs calling using BCFtools18.
For lineage abundance prediction, a deconvolution matrix was generated using Freyja20– a bioinformatics pipeline for estimating lineage abundance from wastewater. Freyja utilizes SNV frequency and sequencing depth to estimate accurate lineage abundance within samples.
For the comparison of viral load across different seasons, the specific months were selected based on the weather patterns of the current research year. The monsoon periods were defined as August 17 to October 27, 2022, and June 19 to June 28, 2023. The winter period extended from November 2022 to February 2023, while the summer period was from March 14 to June 14, 2023. Statistical analyses and graph plotting were performed using GraphPad Prism version 9.1.2 ( https://www.graphpad.com/features ).
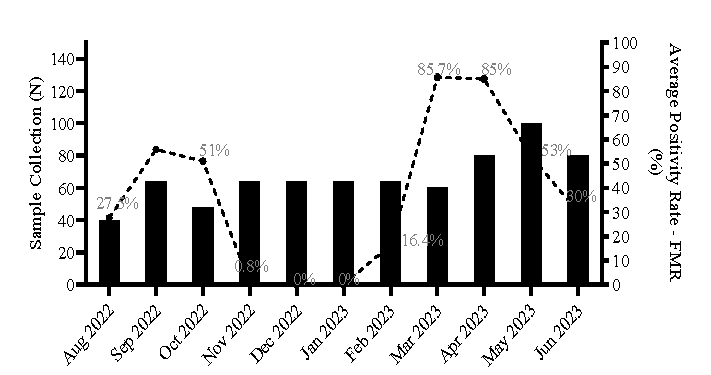
Results Sample collection overview and positivity rateWe analysed SARS-CoV-2 RNA variation in wastewater samples over 11 months (August 2022 to June 2023) to assess the pandemic’s status in vulnerable settings of Mumbai. Among the 728 samples processed (672 from open drains and 56 from STPs), 292 tested positive for at least two out of three targeted genes (E-gene, N-gene and RdRp). No SARS-CoV-2 genes were detected in negative control samples. Positive samples’ Ct values ranged between 30 and 40. The average positivity rate among all the samples collected during the study period was determined to be 36.5 per cent.
The calculation of the average positivity rate (%) for the wastewater samples collected is depicted below: Average Positivity Rate (%)=total number of positive samples per time point *100total number of collection sites per time point
A gradual decrease in positivity rate occurred from Oct 2022, with no (very low in November 2022) positivity between November 2022 and January 2023. The positivity rate in the samples increased from February 2023 to April 2023, followed by a decline from May 2023 to June 2023 (Fig. 1).
Export to PPT
A bar plot analysis (Supplementary Fig. 1) illustrated the distribution of viral load (number of copies) across different sites. Siddharth Nagar open drains exhibited the highest average viral load (mean: 4,585 copies/ml), followed by Kherwadi (mean: 2,440 copies/ml). Among the STPs, Worli STP showed a high viral load (mean: 3,358 copies/ml). A paired t-test revealed no significant difference (P=0.53) in viral load between STPs and open drains from the 57th time point (Supplementary Fig. 2).
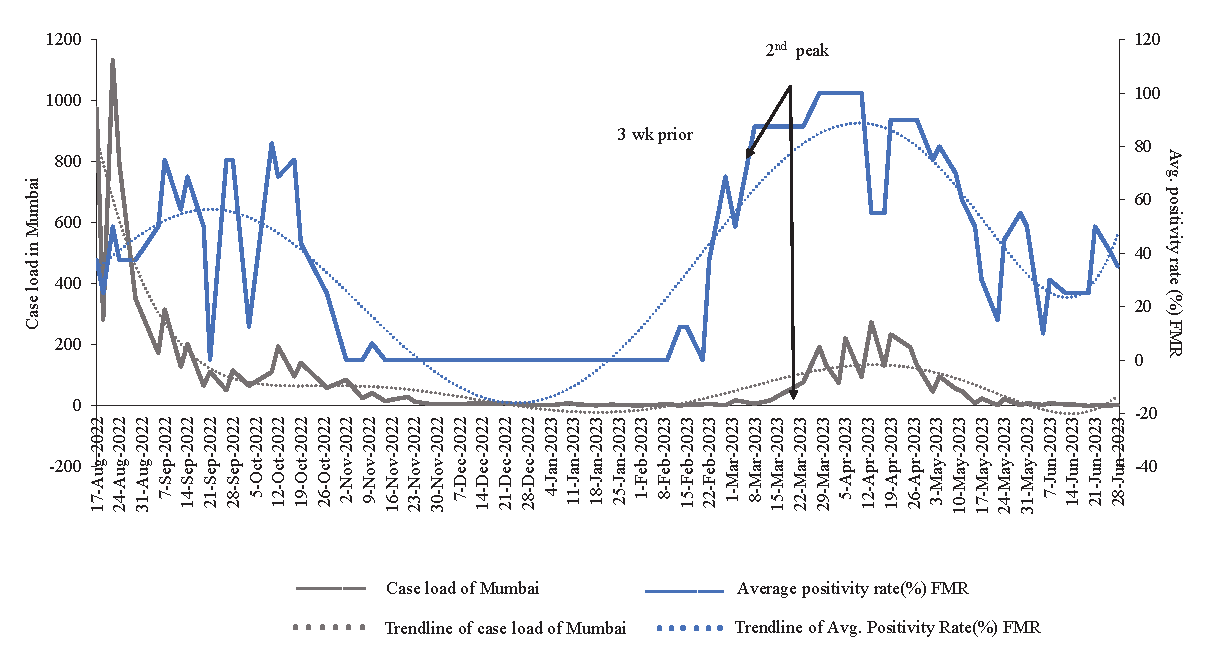
Temporal variation in SARS-CoV-2 RNA concentration and early warning detectionWe compared the average positivity rate (%) of samples to Mumbai’s COVID-19 case load during surveillance. A temporal trend analysis (Fig. 2) correlated SARS-CoV-2 RNA in wastewater with Mumbai’s positive cases. Viral load peaked twice during the SARS-CoV-2 waves in August 2022 and end of February 2023. The peak viral load coincided with the rise and decline of positive cases in Mumbai. From November 2022 to the second week of February 2023, no positive samples were found, aligning with Mumbai’s trendline of positive cases. A rise in viral load from February 24, 2023, preceded the surge in Mumbai’s cases by around 2-3 wk. Mumbai’s positive cases increased until May 24, 2023, and then declined in June 2023. Hence, the detection of SARS-CoV-2 RNA in wastewater signalled the early stages of local outbreaks.
Export to PPT
Sequencing statisticsOf the collected samples, 123 (17%) were sequenced by either Illumina or Nanopore sequencing. Statistics and lineage abundance were determined for 103 samples (Illumina: n=38; Nanopore: n=65). Sequenced reads ranged from 0.001 to 1.8 million, with a median sequence coverage of 209x. Genome coverage varied from 6 per cent to 98 per cent (Supplementary Table I).
Detection of variantsIn August 2022, BA.2.75 and its sub-variants predominated (70%) among other Omicron sub-variants. BA.2.75 dominance continued in September 2022 (80%), alongside BA.2.10 (5%) and the recombinant variant XBB.1* and XBB.2* (8%). From October 2022, fewer samples were sequenced, revealing XBB.2* and other Omicron sub-variants (Table I and Fig. 3).
Table I. Pre-dominant lineages determined based on sequencing (August 2022 – June 2023)
Month, yr No. of samples sequenced (n=103) Pre-dominant lineages August, 2022 12 BA.2.75 September, 2022 30 BA.2.75, BA.2.75* October, 2022 2 BA.2.10, XBB.2 November, 2022 0 - December, 2022 0 - January, 2023 0 - February, 2023 12 XBB.1.16, XBB.1.16.1 March, 2023 27 XBB.1.5* April, 2023 6 XBB.1.16.1, XBB.1.16 May, 2023 12 XBB.1.16*, BA.2* June, 2023 2 BA.2*, XAS, BA.2.65, BA.4*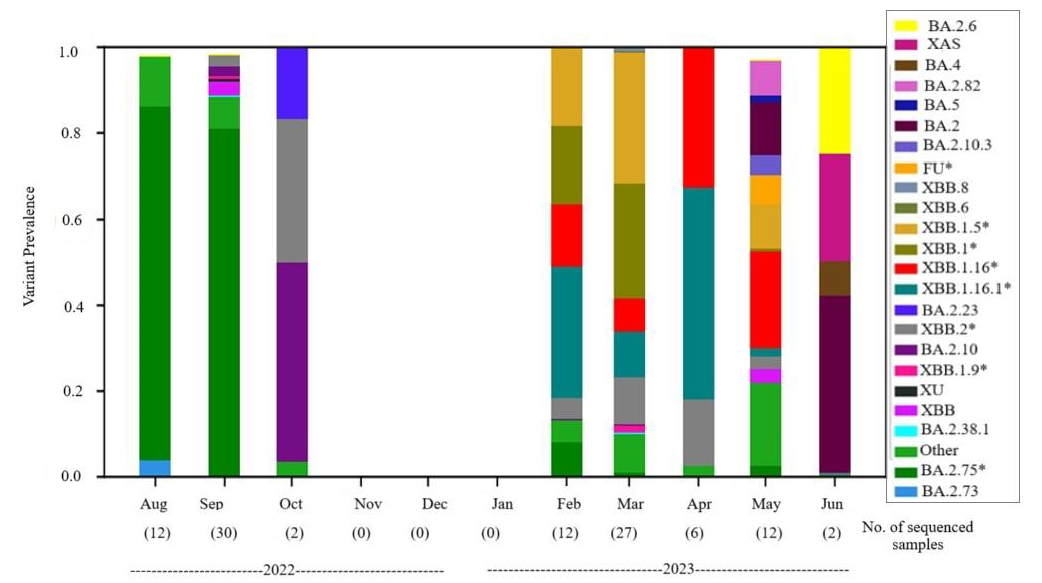
Export to PPT
During the second peak observed in this study between February and May 2023, XBB.1.16.1 (25%) and XBB.1.16 (15%) were dominant, followed by various sub-variants. These trends continued through May 2023, showing fluctuations in dominant variants (Supplementary Table II). All the variants for each sample are provided in the supplementary table II. Comparing variants from sewage drains and STPs revealed no differences (Supplementary Table III).
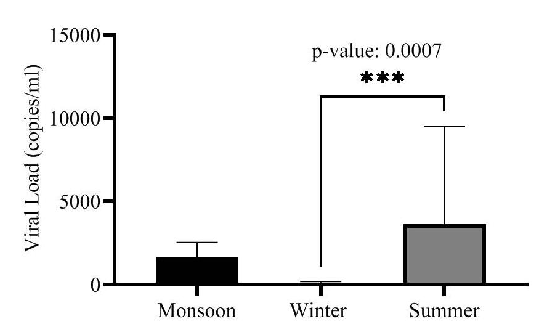
Impact of seasonal change on viral loadWe conducted a comparative analysis of viral load concentrations across various seasons (monsoon, winter and summer) to understand the role of seasonal changes in facilitating transmission. The average viral load in monsoon, winter and summer was determined to be 1,695 copies/ml, 72.5 copies/ml and 3,657 copies/ml, respectively. Summer exhibited a notably high average viral load (after excluding one outlier data point). One-way ANOVA test for viral load variations among different seasons showed statistically significant differences between viral loads of winter and summer (P=0.0007) (Fig. 4). Further, seasonal viral load was compared for each open drain site using one-way ANOVA, and for STPs, a t-test was used as the viral load was only available for the monsoon and summer seasons (Table II). All the open drains showed significant differences (P≤0.0001) in seasonal viral loads except Siddharth Nagar (S8) which had zero viral load in winter (P=0.1). The viral load difference between monsoon and summer for both the STPs was non-significant (P= 0.29, 0.15). Winter and summer showed significant differences in viral load at all sites except S8. The viral load between monsoon and summer was significant for all sites except Dharavi (D2) and S8 (Table II).
Export to PPT
Table II. Statistical comparison of seasonal viral load (copies/ml) across all sample collection sites
Locations Mean Monsoon Mean Winter Mean Summer Monsoon vs. Winter Monsoon vs. Summer Winter vs. Summer P value D1 1314 136 2422 * * **** <0.0001 D2 1674 71.7 3720 ns * **** <0.0001 D3 1063 71.2 1924 * ns **** <0.0001 K4 2084 36.5 2786 *** ns **** <0.0001 K5 3304 173 4256 ** ns **** <0.0001 B6 1425 28.6 1712 **** ns **** <0.0001 B7 1338 71.2 1506 **** ns **** <0.0001 S8 1274 0 13227 ns ns ns 0.1 T-test B9 684.2 - 2901 - ns - 0.29 L10 766.8 - 3790 - ns - 0.15 DiscussionThis study underscores the significance of WBE for monitoring SARS-CoV-2 in Mumbai’s urban slums. By showing a temporal correlation between viral loads in wastewater and city-wide COVID-19 case trends, with early detection three weeks prior to detection of clinical cases, WBE proves to be a cost-effective tool for early outbreak detection and public health intervention21. Additionally, genomic sequencing of wastewater samples helps track emerging variants, providing insights into viral evolution and transmission dynamics. These findings emphasize WBE’s value in public health response, particularly in resource-limited settings, making it vital for pandemic monitoring and preparedness.
Our longitudinal study on SARS-CoV-2 viral concentration in Mumbai’s vulnerable areas indicates early shedding in asymptomatic or non-reporting patients. Wastewater surveillance, complementing clinical testing, effectively predicts COVID-19 trends22. Over 11 months, we analysed 728 samples from open drains and sewage treatment plants (STPs), with 292 testing positive via RT-PCR, showing higher sensitivity for the E-gene. Significant viral load variations were observed among sites, with Siddharth Nagar-8 and Worli STP displaying the highest loads. No notable difference was found between open drain and untreated STP wastewater, affirming sampling consistency and data reliability (Supplementary Fig. 3).
The study revealed dynamic changes in SARS-CoV-2 lineages. BA.2.75 dominated from August-September 2022, shifting to XBB in October 2022. A temporary absence of positive samples from November 2022 to January 2023 was followed by a resurgence in February 2023 with XBB.1.16. Viral loads increased in Mar 2023, with a decline in XBB.1.16 and XBB.1.16.1 dominance by May 2023. Mixed sub-lineages were noted in later months, showcasing WBE’s impartial overview of viral diversity23. Our findings align with a similar study across Maharashtra, corroborating the prevalence of BA.2.75 and XBB.1.16 during comparable periods24. The SARS-CoV-2 lineages showed temporal but not geographical variation, validated against city-wide clinical sample data and the GISAID database, underscoring the Freyja tool’s effectiveness20 for identifying mixed SARS-CoV-2 variants.
Understanding the impact of seasonal changes on SARS-CoV-2 transmission is crucial. Our study found significant seasonal differences in viral loads, with higher concentrations in summer (average 3,657 copies/ml) compared to winter (P=0.0007) (Fig. 4). SARS-CoV-2 primarily spreads through droplets larger than 10 µm25. Increased transmission in March-April 2023 could be due to higher temperatures and dry air, which promote droplet evaporation, allowing them to stay airborne longer26. Conversely, high humidity in May 2023 and the monsoon season (June-September 2023) also influenced transmission patterns, with significant differences between summer and winter (P< 0.0001) and marginally significant differences between monsoon and winter, likely due to rain diluting wastewater (Fig. 4).
Wastewater-based monitoring is a global strategy for predicting COVID-19 outbreaks. Lamba et al10 detected SARS-CoV-2 trends in wastewater 8-14 days before the emergence of clinical data. Our findings align globally, highlighting wastewater analysis for revealing viral patterns and detecting emerging variants. Despite dilution challenges, deep sequencing overcomes genome coverage limitations. Expertise in identifying new variants is essential for enhanced monitoring in India.
The global adoption of wastewater surveillance, from Europe to North America, Australia, and Asia, underscores its role in forewarning potential COVID-19 spikes. Similar to polio surveillance, monitoring SARS-CoV-2 through WBE and correlating it with local clinical data is crucial for tracking outbreaks and providing a comprehensive view of the situation27. Our study’s correlation between wastewater viral trends and actual infection rates reflects a global sentiment, emphasizing the integration of WBE into pandemic monitoring frameworks. Real-time genomic surveillance is essential for understanding viral load patterns and identifying new variants, contributing to pandemic preparedness for future health crises.
Data availabilityThe genomic data produced in this research is accessible and downloadable through GISAID accession numbers (EPI_ISL_18216418 - EPI_ISL_18216453 and EPI_ISL_18226307 - EPI_ISL_18226373) on the GISAID repository ( https://gisaid.org/ ).
留言 (0)