Pancreatic ductal adenocarcinoma (PDAC), which represents more than 90% of pancreatic cancers (PC), is a highly aggressive disease with a poor prognosis (1). The disease arises from the uncontrolled growth of malignant cells in the pancreas, an essential organ responsible for producing digestive enzymes and hormones, including insulin. Despite low incidence rates, PDAC remains the sixth leading cause of cancer-related deaths worldwide (2). Due to its anatomical location, PDAC is characterized by its silent progression, often remaining undetected until advanced stages, resulting in poor prognoses and high mortality rates (3). Although there have been significant advancements in PDAC research, the mortality to incidence ratio has changed little over the past few decades. Compared with other cancers, PDAC exhibits remarkable resistance to conventional therapies and possesses a highly immunosuppressive tumour microenvironment (TME), enabling cancer cells to “hide” from the immune system (4). Surgery with curative intent together with adjuvant chemotherapy is the treatment of choice; however, this is only possible in about 10-20% of patients (5). Recent progress in targeting the immune system for cancer treatment, referred to as cancer immunotherapy, has caused a paradigm shift in therapeutic options for cancer patients. One of the most studied strategies involves targeting the immunosuppressive interaction between programmed death ligand 1 (PD-L1), which is present on tumour cells, and its receptor, programmed death receptor (PD-1), which is expressed on immune cells, such as activated T cells, natural killer (NK) cells, B cells, macrophages and different subsets of dendritic cells (DCs) (6). Inhibition of the PD-1/PD-L1 immune checkpoint axis has produced impressive response rates in various malignancies, such as melanoma, renal and lung cancer. However, despite PD-L1 being expressed in human PC samples, immunotherapy targeting PDAC has so far been ineffective due to reduced immune cell infiltration (7, 8). Thus, increased engagement of the immune response may provide significant clinical benefit for PDAC patients.
Type I interferons (IFN-Is) are cytokines that are released in response to pathogen or damage associated molecular patterns (PAMPs or DAMPs, respectively). They are expressed by almost all cells in the body and are involved in the regulation of many biological processes, such as cellular immune responses to infections, cell cycle regulation, differentiation and apoptosis (9). Nucleic acids released from damaged cells function as DAMPs and are recognized by pattern recognition receptors (PRRs), thereby eliciting an immune response. The presence of cytosolic DNA activates cyclic GMP-AMP synthase (cGAS), which synthesizes cyclic guanosine monophosphate-adenosine monophosphate (cGAMP). cGAMP subsequently activates stimulator of interferon response cGAMP interactor (STING) resulting in activation of TANK binding kinase 1 (TBK1), which phosphorylates IFN regulatory factor 3 (IRF3). IRF3 homodimerizes, translocates to the nucleus, and upregulates expression of IFN-Is, such as IFNβ, which is secreted from the cell (10). IFNβ binds to the IFNα/β receptor (IFNAR) complex on immune and non-immune cells, resulting in activation of signal transducer and activator of transcription 1 (STAT1) and STAT2. These proteins in turn form a complex with interferon regulatory factor 9 (IRF9) known as IFN stimulated gene factor 3 (ISGF3), which regulates the expression of IFN stimulated genes (ISGs) that play important roles in immunity (11). STING has emerged as a target for cancer therapy, providing new strategies to exploit the immune system to combat cancer (12). The expression levels of IFN-Is and other inflammatory cytokines downstream of STING activation contribute to enhanced anti-tumour immune responses (13). By utilizing this mechanism, STING agonists have been shown to induce tumour regression by enhancing the ability of immune cells to target cancer cells (14). IFN-Is regulate tumour infiltrating immune cells and are critically important in maintaining antigen-presenting lymphocyte function for effective anti-tumour immunity. They also exhibit cancer cell intrinsic properties, such as growth inhibition and increased apoptosis (11). Increasing IFN-I levels has shown promising results in the preclinical and clinical setting, and some studies report that they synergize with immune checkpoint inhibitors to reduce tumour growth in cancer models (15–18). In support of these findings, loss of IFN-I signalling enhances tumorigenesis and impairs anti-tumour responses (19). However, there is evidence that STING-mediated increases in IFN-I signalling induce pro-tumorigenic effects (20). STING activation in tumour cells has been reported to induce epithelial-mesenchymal transition (EMT) and promote tumour metastasis (21). IFN-Is induce PD-1 and PD-L1 levels in immune sand tumour cells. Radiation-induced IFN-I responses not only activate cytotoxic T cells but can also protect tumours from killing by cytotoxic T cells (22, 23).
PARP7, also known as 2,3,7,8-tetrachlorodibenzo-p-dioxin (TCDD)-inducible poly-ADP-ribose polymerase (TIPARP) is a member of the ADP-ribosyltransferase diphtheria-like (ARTD) family and a critical regulator of innate immune signalling (24). PARP7 uses NAD+ to transfer one molecule of ADP-ribose to specific amino acid residues on itself and on target proteins, in a process referred to as mono-ADP-ribosylation (MARylation) (25). MARylation is a reversible post-translational modification involved in several biological processes, such as immune cell function, transcriptional regulation, and DNA repair (26). PARP7 mRNA expression is regulated by several transcription factors, including the ligand-induced transcription factor aryl hydrocarbon receptor (AHR). In turn, PARP7 acts as a negative regulator of AHR signalling involving the MARylation of AHR (27–29). Previous studies have reported that PARP7 is required for AHR-dependent repression of IFN-I responses during viral infection associated with PAMP stimulation, a process that requires its catalytic activity (30). The repressive actions of PARP7 have been attributed to its ability to MARylate TBK1, thus preventing the downstream upregulation of IFN-Is (30). More recent studies provide evidence that PARP7 regulates IFN-I signalling downstream of TBK1 (31) and by targeting nuclear factor kappa B (32).
Treatment with IFN-I inducers in combination with immune checkpoint inhibitors has been shown to sustain anti-tumour responses in models of aggressive cancers (10). Recent studies in preclinical mouse models, showed that PARP7 inhibition (PARP7i) with RBN-2397 reduced CT26 colon tumour growth in immunocompetent mice, which was dependent on IFN-I signalling and that cotreatment of RBN-2397 with anti-PD1 further reduced tumour growth compared with either treatment alone (33). Consistent with these findings, we reported that injection of mice with murine EO771 breast cancer cells in which PARP7 was knocked out (Parp7KO) resulted in >80% reduced tumour growth in Parp7 deficient mice compared with injected wildtype (WT) EO771 cells in WT mice (32). This was due to an increased infiltration of tumour-associated immune cells, resulting in augmented anti-tumour immunity. These findings show that PARP7 loss or its inhibition reduces tumour growth in different preclinical models by increasing anti-tumour responses. However, PARP7’s involvement in PDAC remains unclear.
In this study, we show that loss of PARP7 expression or its activity increases basal ISG expression levels in murine pancreatic cancer cells in vitro, and we demonstrate that Parp7 loss decreases tumour growth through increased tumour infiltrating immune cells and enhanced anti-tumour immunity. Our results suggest that targeting PARP7 alone or combination with other immunotherapies should be considered as a new therapeutic strategy against PDAC.
Materials and methodsChemicals and plasmidsDMSO was purchased from Sigma Aldrich (St. Louis, MO, USA), DMXAA from Invivogen (San Diego, CA, USA), RBN-2397 from MedChemExpress (Monmouth Junction, NJ, USA), 6-formylindolo(3,2-b)carbazole (FICZ) from SelleckChem (Houston, TX, USA), and IFNβ from R&D Systems (Minneapolis, MN, USA). The pSpCas9(BB)-2A-Puro (PX459) plasmid was purchased from Addgene (plasmid #62988) (Watertown, MA, USA).
Cell cultureCR705 cells derived from a spontaneous pancreatic tumour in a LSL-KrasG12D/+;LSL-Trp53R172H/+;Pdx1-Cre (KPC) mouse were used in this study (34). K8484 cells were derived from KPC mice on the mixed 129/SvJae/C57BL/6 background. BxPC3 cells (CRL-1687) were purchased from ATCC. All cell lines were maintained in RPMI culture medium (1.0 g/L glucose), supplemented with 10% v/v heat-inactivated fetal bovine serum (FBS), 1% v/v L-glutamine and 1% v/v penicillin-streptomycin. Cells were cultured at 37°C with 100% humidity and 5% CO2, and subcultured when confluency reached 80%.
Generation of Parp7 knockout cellsThe guide oligos used to make the gRNA were: 5´- CACCGTCTTCTCAGAAATTCTCATT-3´ and 5´-AAACAATGAGAATTTCTGAGAAGAC-3´. After inserting the resulting gRNA into the PX459 plasmid, the cells were transfected, selected and expanded as previously described (32). To confirm knockout, genomic DNA from several clones was harvested, and the target site was amplified and sequenced. The primers used for sequencing were: Forward 5´-TGCAGATTTTTGCATAGCTTTTG-3´ and reverse 5´-TTGTCTTGGAAAGCTC CTGGT-3´. After screening, one clone was subsequently expanded, and further analysed. Cells transfected with an empty PX459 plasmid were also selected and expanded and will be referred to as CR705Cas9 cells.
Western blottingCells used for western blotting were seeded in six-well plates and treated the following day. Cells were lysed in TE-buffer supplemented with 1% w/v SDS. After brief sonication, the samples were boiled at 95°C for 10 min. Protein concentration was determined with a BCA assay (Thermo Fisher Scientific, Waltham, MA, USA). Proteins were separated by SDS-PAGE and transferred to polyvinylidene fluoride (PVDF) membranes. The antibodies used were: lab generated anti-PARP7 antibody (35), anti-AHR (Enzo Life Sciences, Farmingdale, NY, USA; bml-sa210-0100), anti-STING (Cell Signalling Technology, Danvers, MA, USA; D2P2F), anti-STAT1 (Cell Signalling Technology; #9172), anti-STAT2 (Cell Signalling Technology; D9J7L), anti-IRF9 (Cell Signalling Technology; D9I5H), anti-pSTAT1 (Y701) (Cell Signalling Technology; D4A7), and anti-β-actin (Sigma-Aldrich; AC-74). After incubation with corresponding secondary antibody (Rabbit, Mouse, Cell Signalling Technology), the protein bands were visualized with SuperSignal™ West Dura Extended Duration Substrate or SuperSignal™ West Atto Ultimate Sensitivity Substrate (Thermo Fisher Scientific, Waltham, MA, USA).
Real time qPCRTotal RNA was isolated using the Aurum™ Total RNA isolation kit (BioRad, Hercules, CA, USA), and used to synthesize cDNA with the High-Capacity cDNA Reverse Transcription Kit (Applied Biosystems, Waltham, MA, USA). The RT-qPCR assays were set up as previously described (35). The primers used are provided in Supplementary Table S1.
Proliferation assaysCells were seeded in 96-well plates on day 0, 24 h later the cells were treated with DMSO or 100 nM RBN-2397. Cell proliferation was measured using CellTiter Glo (Promega, Madison, WI, USA) assay according to the manufacturer’s instructions. Data are shown as a percent cell proliferation compared with 72 h DMSO treatment.
Mouse models and tumour studiesFemale immune deficient (NOD.Cg-Prkdcscid Il2rgtm1Wjl/SzJ, NSG: #005557) and immunocompetent (C57BL/6J: #000664) mice were purchased from The Jackson Laboratory (Bar Harbor, ME, USA). The generation of Parp7H532A/H532A (Parp7HA/HA) mice has been described previously (29). Mice aged 8-12 weeks underwent isoflurane anaesthesia before a single subcutaneous injection with either CR705Cas9 or CR705Parp7KO cells. CR705 cells were prepared as single cell suspensions and injected at a density of 5 × 10⁵ cells. Tumour growth was monitored with caliper measurements, and tumour volumes were calculated using the standard formula π/6 × W2 × L. Mice were euthanized at the end of experiments by cervical dislocation, and tumours were prepared for histological analyses. All experimental animals were housed in the Division of Comparative Medicine at the University of Toronto, with a 12 h light/dark cycle, and access to chow and water ad libitum. Care and treatment of animals followed the guidelines set by the Canadian Council on Animal Care and was approved by the University of Toronto Animal Care Committee.
ImmunohistochemistrySectioning and staining of the tumours were performed according to standard methods. Fixed tissues were provided to the HistoCore Facility at the Princess Margaret Cancer Centre (Toronto, Ontario, Canada), and sample processing, staining with Ki67, CD3, and CD8 and scanning were done at the facility. Quantification analysis was performed with QuPath v0.4.3 (36).
RNA sequencing and data analysisTotal RNA was isolated from approximately 100 mg of tumours from CR705Cas9 or CR705Parp7KO cells using the Aurum™ Total RNA isolation kit (BioRad) according to the manufacturer’s protocol. The raw RNA sequence paired-end fastq files were quantified using the Salmon tool with “libtype” flag as automatic and mm10 version of the Salmon index file (37). The index was generated using the salmon “index” flag with the mm10 transcripts fasta file supplied. The “tximport” import function from the tximport package [v1.26.1 (38)] was used to import the Salmon quantification data for further processing including differential expression analysis by DESeq2 (39). For all comparisons, empty vector (Cas9) tumour samples were considered as the control. Significant genes were considered as those with absolute log fold change greater than 1 and Benjamin Hochberg false discovery rate value of differential expression less than 0.01 and tested using the Wald Test implemented in DESeq2. Pathway analysis was done using the Reactome database and Ingenuity pathway analysis (Qiagen, Hilden, Germany).
Tumour and spleen dissociation into single cellsTumours were dissected at endpoint and were processed into single-cell suspensions using a Mouse Tumour Dissociation Kit (Miltenyi Biotec, Bergisch Gladbach, Germany) according to the manufacturer’s protocol. Approximately, 1-2 mm tumour pieces were placed in an ice-cold Tissue Storage Solution before being transferred into gentleMACS™ C Tubes (Miltenyi Biotec) containing the appropriate kit reagents and enzymes. The tumour samples were then incubated in a gentleMACS Octo Dissociator (Miltenyi Biotec). SmartStrainers were used to filter debris and erythrocyte lysis was done using Red Blood Cell Lysis Solution (Miltenyi Biotec). Cells were counted and frozen in MACS Freezing Solution and store at -80°C.
Spectral flow cytometry analysisSpectral flow cytometry analysis of stained cell suspensions was performed on a Cytek Aurora spectral flow cytometer equipped with a 3-laser, 38-detector array and operated by the Cytek SpectroFlo software version 3.2.1. Healthy splenocytes or Ultra-Comp control compensation particles (Thermo Fisher Scientific) defined spectral unmixing standards data for single colour controls for each of the 28 targets analysed (Supplementary Table S2). Cells suspensions were washed with PBS before viability staining with Zombie NIR viability dye for 15 min at room temperature. Cells were then incubated with Fc block for 15 min on ice. Staining with Anti-CD62L, TCRγδ, and CCR6 antibodies was then performed by incubating cells with optimized antibody concentrations for 30 min at 37°C. Staining with antibodies against other cell surface receptors was then performed for 30 min at room temperature. For intracellular staining, cells were fixed and permeabilized with the FoxP3 Fix/Perm buffer set (eBioscience) before incubating with anti-FoxP3 and RORγt antibodies for 1 hour at room temperature. All staining steps with fluorescent reagents were performed in the dark. The data was analysed with FlowJo v10 software.
Statistical analysisData are represented as standard error of the mean (S.E.M) of at least three individual experiments and were analysed with GraphPad Prism v8.2 (San Diego, CA, USA). Statistical analyses were done using a two-tailed student’s t-test, one- or two-way analysis of variance (ANOVA). For flow cytometry, cell counts, and population frequencies were determined using FlowJo V10 software. Differences in population frequencies of different tumour infiltrating leukocyte (TIL) populations between CR705Cas9 and CR705Parp7KO tumours were compared using Mann-Whitney test or mixed-effects analysis with Šídák’s multiple comparisons test.
ResultsPARP7 inhibition differentially affects AHR and IFN-I signalling in PDAC cell linesTo characterize the effects of PARP7 inhibition (PARPi) on AHR and IFN-I signalling and proliferation we exposed CR705, K8484 and BxPC3 cells to the AHR agonist, FICZ, and/or the PARP7 inhibitor, RBN-2397. CR705 and K8484 cells are PDAC cells derived from a pancreatic tumour in the LSL-KrasG12D/+;LSL-Trp53R172H/+;Pdx1-Cre (KPC) mouse model (34, 40). This model is commonly used to study human pancreatic cancer, as the mice spontaneously develop pancreatic cancer at 11-12 weeks of age, and the tumours display many of the key features of the TME observed in human patients (41). BxPC3 cells are a human PDAC cell line. We previously reported that PARP7 catalyses its own proteolytic degradation and that inhibition of PARP7 activity stabilizes its protein levels (35). As such, treatment with the PARP7 inhibitor RBN-2397 enabled visualization of PARP7 protein. Because of the well-established feedback inhibition that PARP7 has on AHR signalling, we also determined AHR levels in all cell lines. Western blotting confirmed PARP7 and AHR protein expression in all three cell lines (Figures 1A–C). The two distinct AHR protein bands in K8484 cells are consistent of the mixed 129/B6 background of the cells, since 129 mice express the long Ahrd allele (104 kDa) while C57BL/6 express the shorter Ahrb1 (96 kDa) allele (42). In line with PARP7’s role as a negative regulator of AHR, 4 h co-treatment with 100 nM RBN-2397 and 10 nM FICZ significantly increased expression levels of the AHR target gene, cytochrome P450 1a1 (Cyp1a1) compared with FICZ alone in all cell lines (Figures 1D–F). Despite PARP7’s role as an inhibitor of IFN-I signalling, 4 h treatment RBN-2397 only induced Ifnb levels in BxPC3 cells. We next determined whether the cell lines were sensitive to the antiproliferative actions of RBN-2397, which has been reported to be dependent on AHR expression (Figures 1G–I). RBN-2397 resulted in a slight (<9% decrease), albeit significant, decrease the proliferation of CR705 cells. K8484 and BxPC3 cells were insensitive to the antiproliferative effects of RBN-2397 (Figures 1J–L).

Figure 1. PARP7 inhibition differentially affects AHR and IFN-I signalling in CR705, K8484 and BxPC3 cells. Relative PARP7 and AHR protein levels in (A) CR705, (B) K8484 and (C) BxPC3 cells treated with or without RBN-2397 (100 nM) treatment for 24h. Cyp1a1 levels are increased with PARP7i in all cell lines. (D) CR705, (E) K8484 and (F) BxPC3 cells were treated with 10 nM FICZ, 100 nM RBN-2397 and FICZ+RBN-2397 for 4h. RBN-2397 treatment differentially induced Ifnb levels in (G) CR705, (H) K8484 and (I) BxPC3 cells. PARP7i resulted in decreased cell proliferation of (J) CR705 but not (K) K8484 nor (L) BxPC3 cells. Cells were treated with 100 nM of RBN-2397 for 72h. *p<0.05 significance compared with DMSO, #p<0.05 significance compared with FICZ. ns, not significant.
Loss of PARP7 increases levels of ISGF3 and downstream signallingSince the antitumour effects of PARP7i are reported to be dependent on IFN-I signalling (33, 43, 44), we further characterized the IFN-I pathway in CR705 cells. We chose CR705 cells because that were slightly sensitive to the antiproliferative effects of RBN-2397 and that are derived from C57BL/6 mice allowing us to do syngeneic tumour studies in immunocompetent mice. To this end we generated these Parp7 knockout cells, using CRISPR/Cas9 gene editing. After selection and sequencing of several potential clones, only one clone contained indels that resulted in frameshift mutations in the Parp7 gene (Supplementary Figure S1). This clone, referred to as CR705Parp7KO, was expanded and further characterized. Loss of PARP7 increased FICZ-induced increases in Cyp1a1 levels compared with CR705Cas9 control cells (Figure 2A). We then tested whether Parp7 loss affect IFN-I signalling. Cells were treated with RBN-2397 and co-treated with the murine specific STING agonist 5,6-dimethylxanthenone-4-acetic acid (DMXAA) (Figure 2B). Ifnb1 levels were unaffected by RBN-2397 and DMXAA alone or by their co-treatment. Ifnb1 levels did not significantly differ between CR705Cas9 and CR705Parp7KO cells. CR705Parp7KO cells proliferated slightly, but significantly, less (< 5%) than CR705Cas9 cells (Figure 2C), suggesting that they are weakly sensitive to the anti-proliferative effects following Parp7 loss.
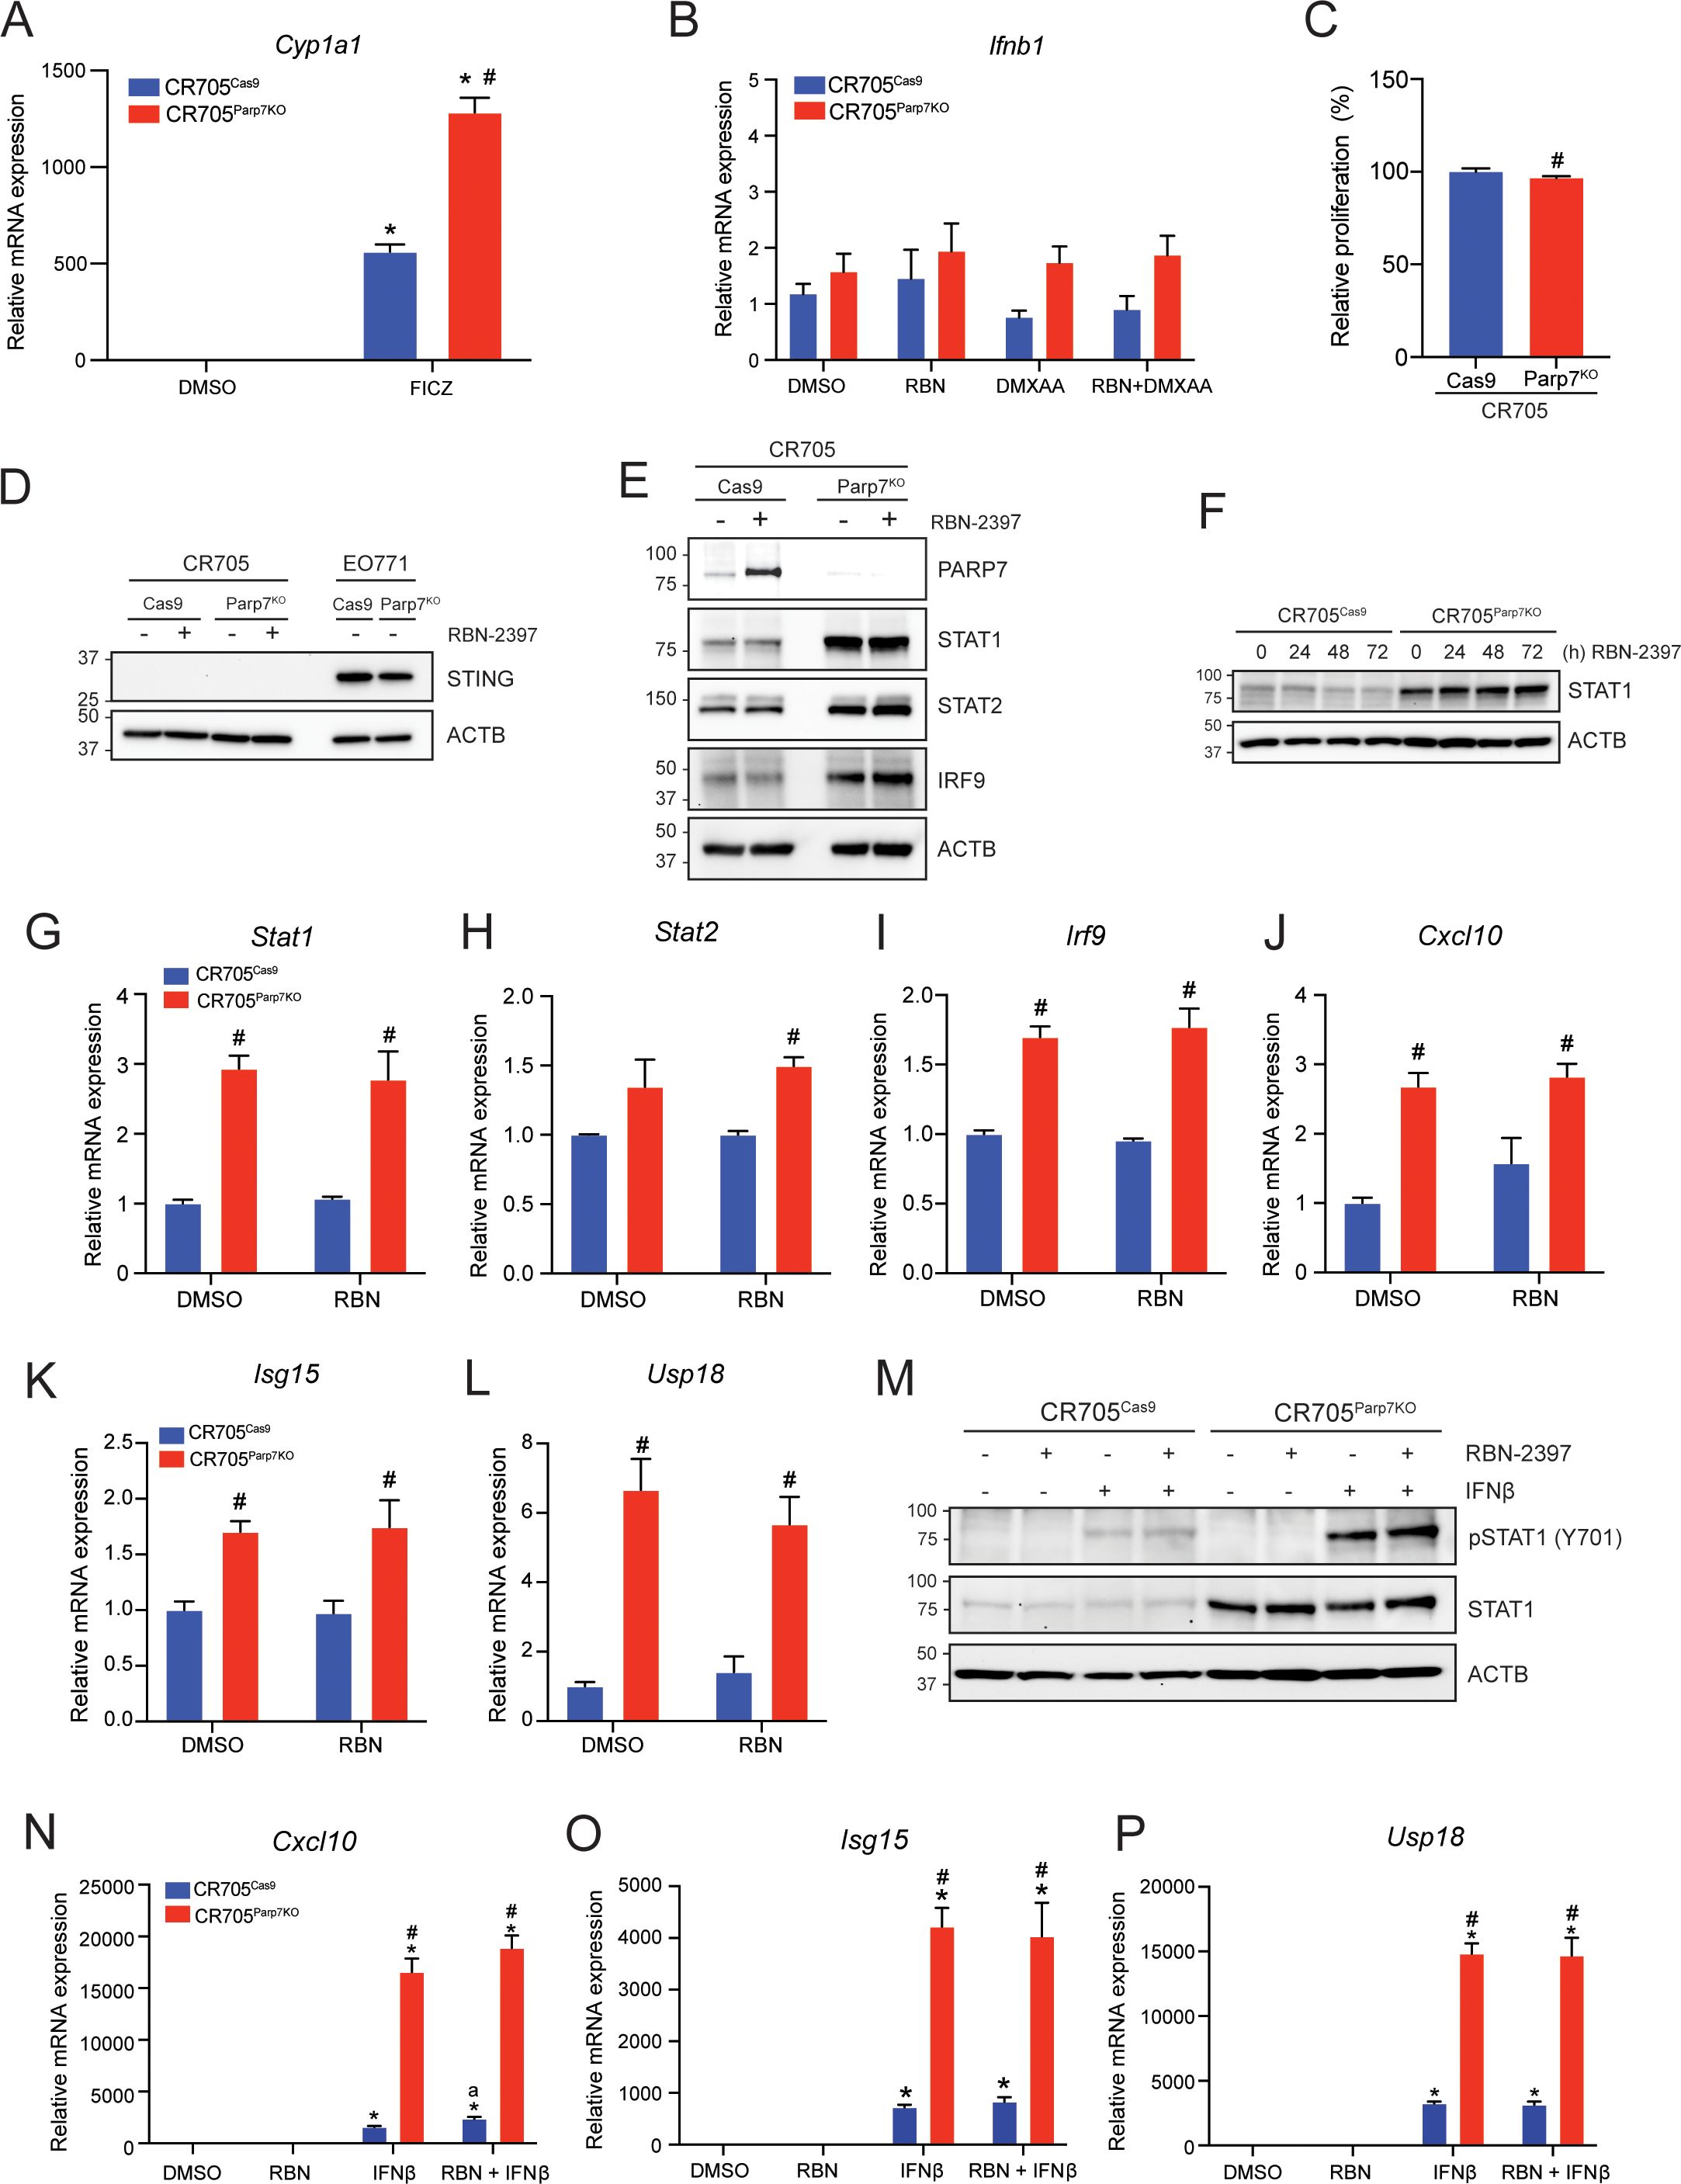
Figure 2. CR705Parp7KO cells do not express STING but have increased levels of ISGF3 and selected ISGs. (A) FICZ-induced Cyp1a1 levels were increased in CR705Parp7KO compared with CR705Cas9 cells. Cells were treated with 10 nM FICZ for 4h. (B) Expression levels of Ifnb1 did not significantly differ across the samples tested. CR705Cas9 and CR705Parp7KO cells were treated with 100 nM RBN-2397 for 24 h and/or 10 µg/mL DMXAA for 4 h, and expression levels were determined by RT-qPCR. (C) Loss of Parp7 cause a slight, but significant decrease in the proliferation of CR705 cells after 72h. (D) CR705 cells did not express STING. CR705 and EO771 cells were treated with 100 nM RBN-2397 for 24 h and their STING levels detected by western blotting. (E) Inhibition of PARP7 with 100 nM RBN-2397 for 24 h enabled visualization of PARP7 in CR705Cas9 cells. Protein levels of STAT1, STAT2 and IRF9 were increased in CR705Parp7KO cells. (F) STAT1 protein levels after treatment with 100 nM RBN-2397 for 24, 48 and 72h. (G-I) Expression of Stat1, Stat2 and Irf9 mRNA levels and (J-L) the ISGF3 target genes Cxcl10, Isg15 and Usp18 after 24 h treatment with 100 nM RBN-2397 in control and Parp7KO cells. (M) Treatment with 1000 U/mL IFNβ for 1 h induced phosphorylation of STAT1. (N) Expression levels of Cxcl10 were significantly elevated in response to IFNβ and was further increased in CR705Parp7KO and CR705Cas9 cells treated with RBN-2397. (O, P) Expression levels of Isg15 and Usp18 were significantly elevated in response to IFNβ, and this was further increased in the CR705Parp7KO cells. Cells were treated with 100 nM RBN-2397 for 24 h and exposed to 1000 U/mL of IFNβ for 4 h (L-N). *p<0.05 compared with DMSO, #p<0.05 significance due to Parp7 deficiency, and ap<0.05 significance due to PARP7 inhibition compared with IFNβ treatment alone.
Consistent with the lack of inducible Ifnb levels, neither CR705Cas9 nor CR705Parp7KO cells expressed STING (Figure 2D). STING expressing EO771Cas9 and EO771Parp7KO cells were used as positive controls. Western blots also confirmed that lack of PARP7 levels in CR705Parp7KO cells even after RBN-2397 treatment (Figure 2E). Since we previously reported that the ISGF3 complex was upregulated in Parp7 deficient cells, we tested whether this was also observed in CR705 cells (Figure 2E) (32). As expected, we observed that PARP7 protein levels were stabilized after treatment with RBN-2397. In agreement with previous findings, the expression levels of STAT1, STAT2 and IRF9, which form ISGF3, were upregulated in the CR705Parp7KO cells, but not in CR705Cas9 cells treated with RBN-2397. We were unable to detect phosphorylation of STAT1 in these samples (data not shown). In contrast to previous observations in EO771 cells, longer exposure to RBN-2397 (48 and 72 h) did not increase STAT1 levels in control cells (Figure 2F) (32). In line with the elevated protein levels, we also observed significant increases in Stat1 and Irf9 mRNA levels, but not Stat2 mRNA levels in CR705Parp7KO cells (Figures 2G–I).
We then determined the expression levels of ISGF3 target gene Cxcl10 to evaluate the downstream signalling pathway and found the levels to be significantly increased in CR705Parp7KO cells (Figure 2J) (45). To further confirm increased ISGF3 signalling in these cells, we tested the expression level of target genes Isg15 and Usp18 (Figures 2K, L). Both Isg15 and Usp18 mRNA levels were significantly upregulated in CR705Parp7KO cells, but not in control cells treated with RBN-2397. Longer exposure to RBN-2397 (48 and 72 h) did not further elevate the expression levels of these target genes (data not shown). Exposure to exogenously added IFNβ resulted in phosphorylation of STAT1, but this was not further increased by RBN-2397 (Figure 2M). CR705Parp7KO cells displayed increased levels of phosphorylated STAT1, but quantification of the bands revealed that the relative levels of pSTAT1 compared to the native STAT1 were lower than in CR705Cas9 cells (Supplementary Figure S2A). Downstream target genes Cxcl10, Isg15 and Usp18 were all significantly increased in response to IFNβ, and further elevated in the Parp7KO cells (Figures 2N–P). Treatment with RBN-2397 slightly increased levels of Cxcl10 in control cells but did not affect the levels of Isg15 or Usp18 (Supplementary Figures S2B-D). Taken together, these findings indicate that CR705 cells exhibit a partially functional IFN-I signalling pathway with increased responsiveness after Parp7 loss. Furthermore, exposure to IFNβ revealed an intact pathway downstream of the IFNAR complex, with increased activity in the Parp7 deficient cells. This may implicate a role for PARP7 in IFN-I signalling that is independent of upstream secretion of IFNβ.
Loss of Parp7 affects expression of ARTD family membersBecause Parp7 loss has been reported to resulted in increased expression of several members of the ARTD family (32), we determined their expression levels in CR705Cas9 and CR705Parp7KO cells (Figure 3A). Consistent with our previous findings, the levels of the MARylating enzymes Parp9, Parp10 and Parp14 were significantly upregulated in CR705Parp7KO cells, but not in CR705Cas9 cells after treatment with RBN-2397 (Figures 3B–D). Notably, PARP14 is also a target gene and positive regulator of the IFN-I pathway (46). Both loss and inhibition of PARP7 resulted in decreased expression of Parp2 and Parp13 (Figures 3E, G), while Parp7 loss, but not inhibition, decreased levels of Tnks2 (Figure 3F). The individual graphs for the other PARPs are provided in Supplementary Figure S3.
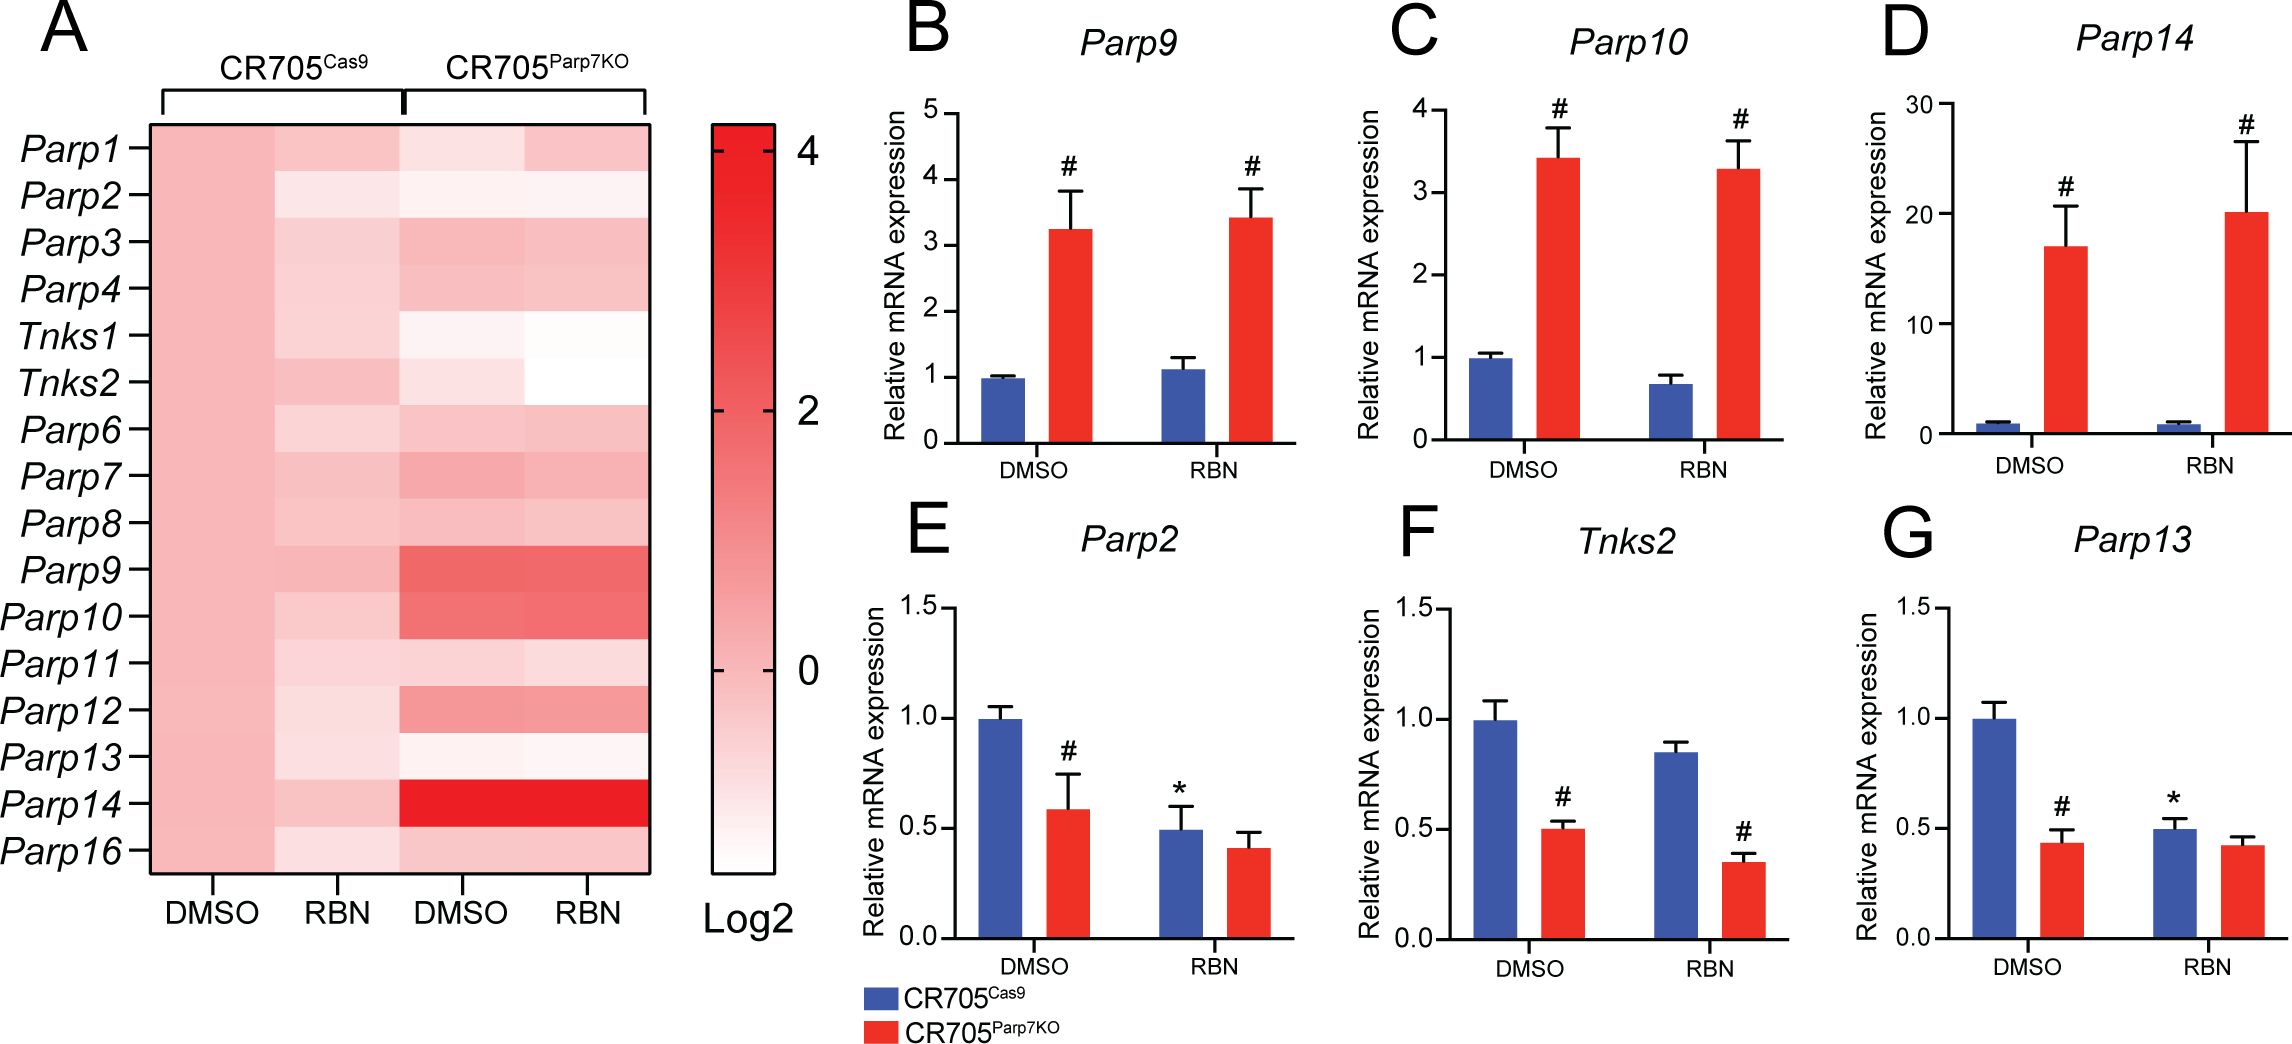
Figure 3. Loss of Parp7 affects expression levels of ARTD family members. (A) Heatmap showing expression levels of ARTD family members in CR705Cas9 and CR705Parp7KO cells after RBN-2397 treatment for 24h. The data are presented as log2-fold changes compared to the DMSO-treated control cells. (B-D) Levels of Parp9, Parp10 and Parp14 were significantly increased in the CR705Parp7KO cells, but unaffected by RBN-2397. (E-G) Levels of Parp2, Tnks2 and Parp13 were significantly lower in CR705Parp7KO cells. Parp2 and Parp13 were decreased after PARP7 inhibition in the control cells. * denotes statistical significance (p<0.05) from the DMSO treated samples, while # denotes significance (p<0.05) due to loss of Parp7.
Loss of Parp7 in CR705 PDAC cells reduces tumour growthTo determine the role of PARP7 on the ability of CR705 to form tumours in vivo, we injected CR705Cas9 and CR705Parp7KO cells into immune deficient NSG mice. Injection of CR705Parp7KO cells gave raise to tumours that grew more slowly compared with CR705Cas9 cells with an average final CR705Parp7KO tumour volume of 73% that of CR705Cas9 tumours. (Figure 4A). Because IFN-I signalling was increased in CR705Parp7KO cells and it is known to enhance immune cell-mediated anti-tumour effects, we next tested the abilities of CR705Cas9 and CR705Parp7KO cells to form tumours in immunocompetent C57BL/6 mice. Injection of CR705Parp7KO cells gave rise to smaller tumours compared with injection of CR705Cas9 cells in C57BL/6 mice (Figure 4B) and this effect was greater than that observed in NSG mice with final CR705Parp7KO tumour volume of 33% that of CR705Cas9 tumours. We did not observe any differences in the number Ki67+ cells, a marker of cell proliferation from CR705Cas9 or CR705Parp7KO tumours in C57BL/6 mice (Figure 4C, D). However, increased staining of T cells (CD3+) and specifically CD8+ T cells was observed in CR705Parp7KO compared with CR705Cas9 tumours (Figures 4E–H).

Figure 4. CR705Parp7KO cells form smaller tumours when injected into immunocompetent mice. (A) CR705Parp7KO cells gave rise to smaller tumors when injected into immunodeficient NSG mice. n=6. (B) CR705Parp7KO cells gave rise to smaller tumours when injected into right flank of female C57BL/6 mice. n=8-9. (C) Representative images of Ki67 staining. (D) Quantification of Ki67+ cells, displayed as positive cells per mm2. (E) Representative images of CD3 staining. (F) CR705Parp7KO tumours had increased levels of infiltrating CD3+ cells compared with CR705Cas9 tumours. Quantification of CD3+ cells, displayed as positive cells per mm2. (G) Representative images of CD8 staining. (H) CR705Parp7KO tumours had increased levels of infiltrating CD8+ cells compared with control. *p<0.05, ** p<0.001, ***p<0.0001. ns, not significant.
Tumours deficient in Parp7 display a less immunosuppressive repertoire of infiltrating immune cellsSpectral flow cytometry was then used to assess differences in the proportion of tumour infiltrating leukocyte (TIL) populations between CR705Parp7KO and CR705Cas9 tumours. A broad range of TILs including several lymphocyte, and myeloid lineage cell populations were identified based on their expression of characteristic cell surface markers (Figures 5A–C; Supplementary Figure S4). Relative proportions of each population were reported as a percentage of the total CD45+ leukocytes in the tumour. TILs from CR705Parp7KO tumours had a higher proportion of NK cells, eosinophils, and F4/80High Sig-FHigh Ly6GHigh Ly6CLow cells. This latter population could be inclusive of mature and long-lived neutrophils (47) and myeloid-derived suppressor cells (MDSCs) (48) (Figures 5D, E). In contrast, CR705Parp7KO tumours had a lower proportion of B cells, macrophages, and CD11b+ dendritic cells (CD11b+ DCs). Although we observed a continuum of macrophage phenotypes rather than distinct populations, we were able to use staining controls to delineate M1-like (CD80High CD206Low) pro-inflammatory and M2-like (CD80Low CD206High) anti-inflammatory cells (Supplementary Figure S5A). A similar proportion of macrophages from CR705Parp7KO and CR705Cas9 tumours had an M1 phenotype (Supplementary Figure S5B); however, a lower proportion with an M2 phenotype were observed specifically in CR705Parp7KO tumours (Figure 5F). The net difference in relative macrophage abundance was absorbed by populations we could not identify as either M1 or M2 (Supplementary Figure S5A). Further, CR705Parp7KO tumours harboured fewer F4/80Low Ly-6GHigh Ly-6CLow and F4/80High Ly-6GLow Ly-6CHigh cells, which have been previously defined as polymorphonuclear and monocytic MDSCs, respectively. No differences in the expression of the immune checkpoint PD-L1 were observed across all TIL populations (Supplementary Figure S5C).
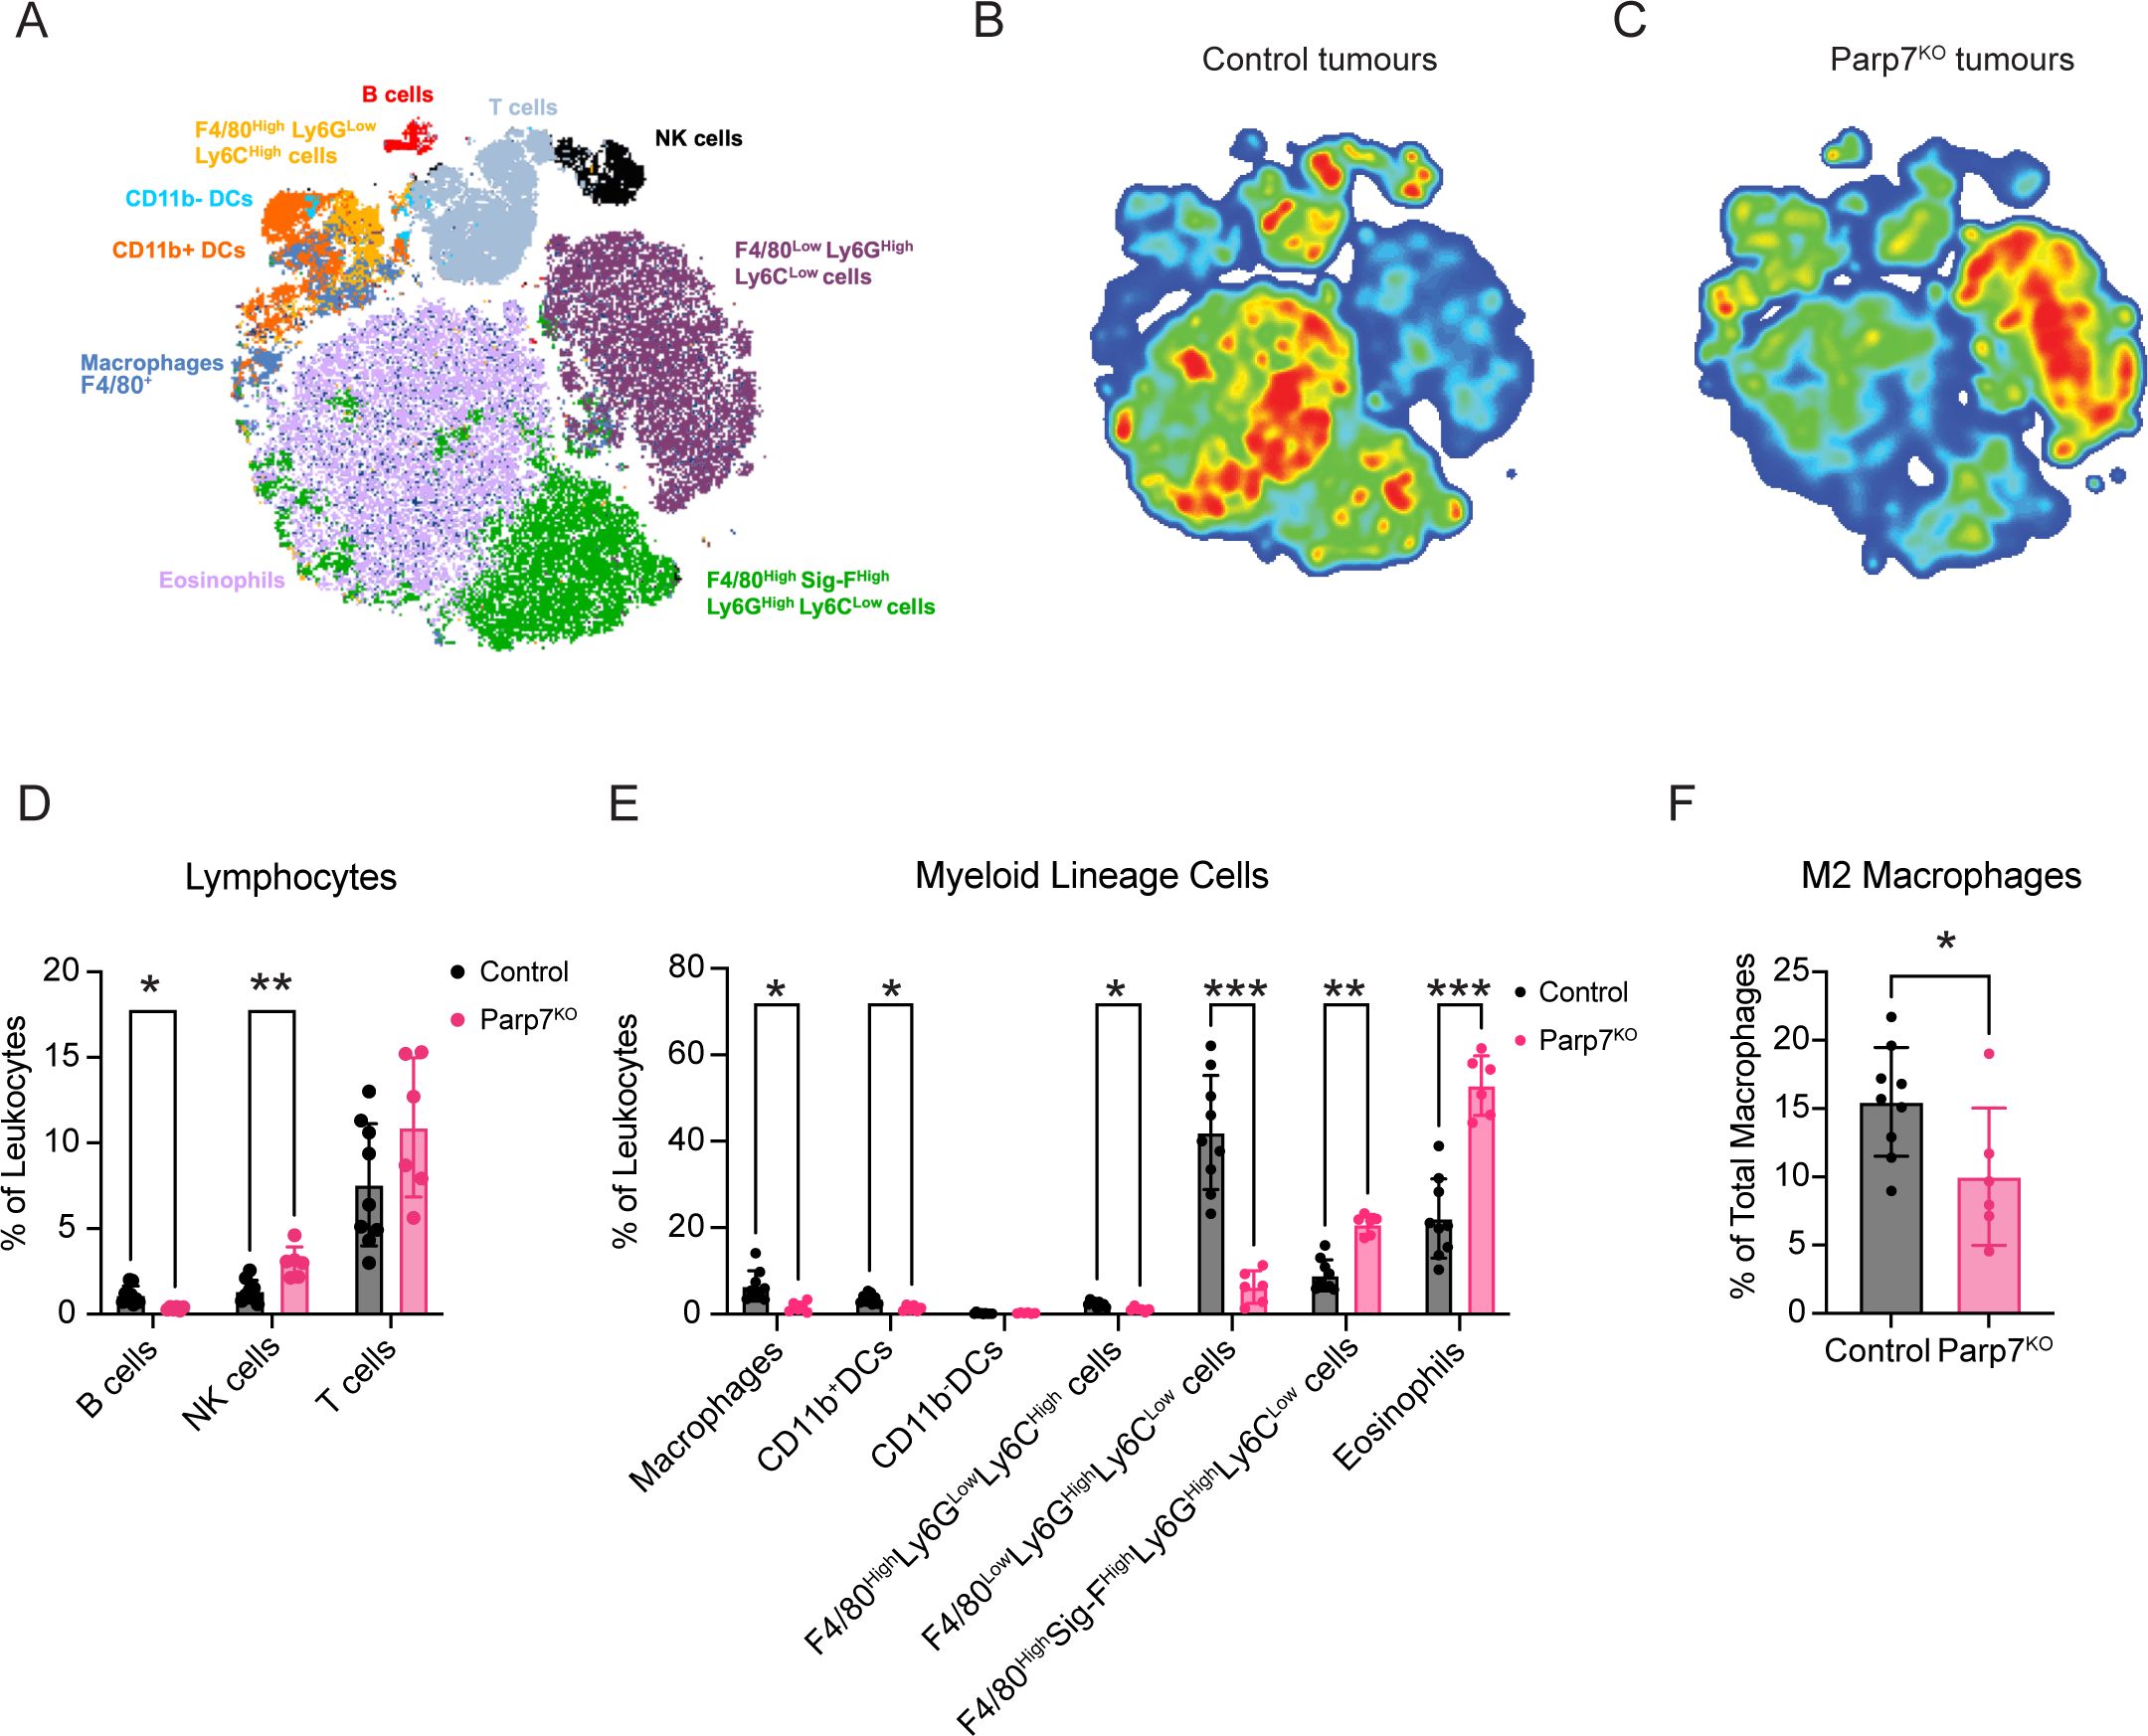
Figure 5. Spectral flow cytometry identifies differences in the proportion of tumour infiltrating leukocytes (TILs) between CR705Cas9 and CR705Parp7KO tumours. (A) t-stochastic neighbour embedding (t-SNE) plot of TIL cell populations. Density plots of TIL cell populations from (B) CR705Cas9 and (C) CR705Parp7KO tumours. Red is higher density whereas blue is lower density. Changes in tumour infiltrating (D) lymphocytes and (E) myeloid lineage cells as a percentage of total leukocytes in CR705Cas9 and CR705Parp7KO tumours. (F) Changes in M2 macrophages as a percentage of total macrophages in CR705Cas9 and CR705Parp7KO tumours. Cell counts and population frequencies determined using FlowJo V10 software. Differences in population frequencies of different TIL populations between CR705Cas9 and CR705Parp7KO tumours were compared using Mann-Whitney test or mixed-effects analysis with Šídák’s multiple comparisons test. *p<0.05, **p<0.01, ***p<0.001.
Despite the average proportion of total T cells from CR705Parp7KO tumours being slightly higher than that of CR705Cas9 tumours, this was not statistically significant (Figure 5D). To better understand the effect of Parp7 loss on T cell tumour infiltration, we also used a dedicated spectral flow cytometry panel capable of differentiating cancer-relevant T cell subpopulations including cytotoxic (CD8), helper (CD4), and TCRγδ T cells (Figures 6A–C; Supplementary Figure S6). We next determined the proportion of each of these major T cell populations, reported as their abundance relative to the total number of CD4+, CD8+, and TCRγδ T cells. A higher proportion of cytotoxic CD8+ T cells was observed in CR705Parp7KO tumours relative to CD4+ and TCRγδ T cells (Figure 6D). Although the difference in the proportion of CD4+ T cells was not statistically significant, CR705Parp7KO tumours with the highest relative CD8+ T cell infiltration also had the lowest relative CD4+ T cell infiltration (Figure 6E). Within the CD4+ T cell compartment, there were more T effector/memory (TEM; CD44+, CD62L-) and less T regulatory (Treg; FoxP3+) cells in CR705Parp7KO compared with CR705Cas9 tumours (Figure 6F). This was specifically reflected in the relative proportion of cells expressing high levels of the immune checkpoint protein PD-1, with no difference in the proportion of PD-1Low CD4+ TEM or Tregs. Unlike CD4+ T cells, there was no significant difference in the proportion of CD8+ T cells that were PD-1High (Figure 6G). However, a higher proportion of TCRγδ T cells were PD-1High in CR705Parp7KO tumours (Figure 6H). Overall, these findings show that CR705Parp7KO tumours had a higher proportion of cytotoxic CD8+ T cell infiltration, as well as a lower relative amount of PD-1High CD4+ Tregs vs. effector memory CD4+ T cells. The higher ratio of effector T cells:Tregs coupled with the lower proportion of M2 macrophages and increased relative amounts of cytotoxic NK cells suggest that loss of Parp7 may counteract the development of an immunosuppressive TME.
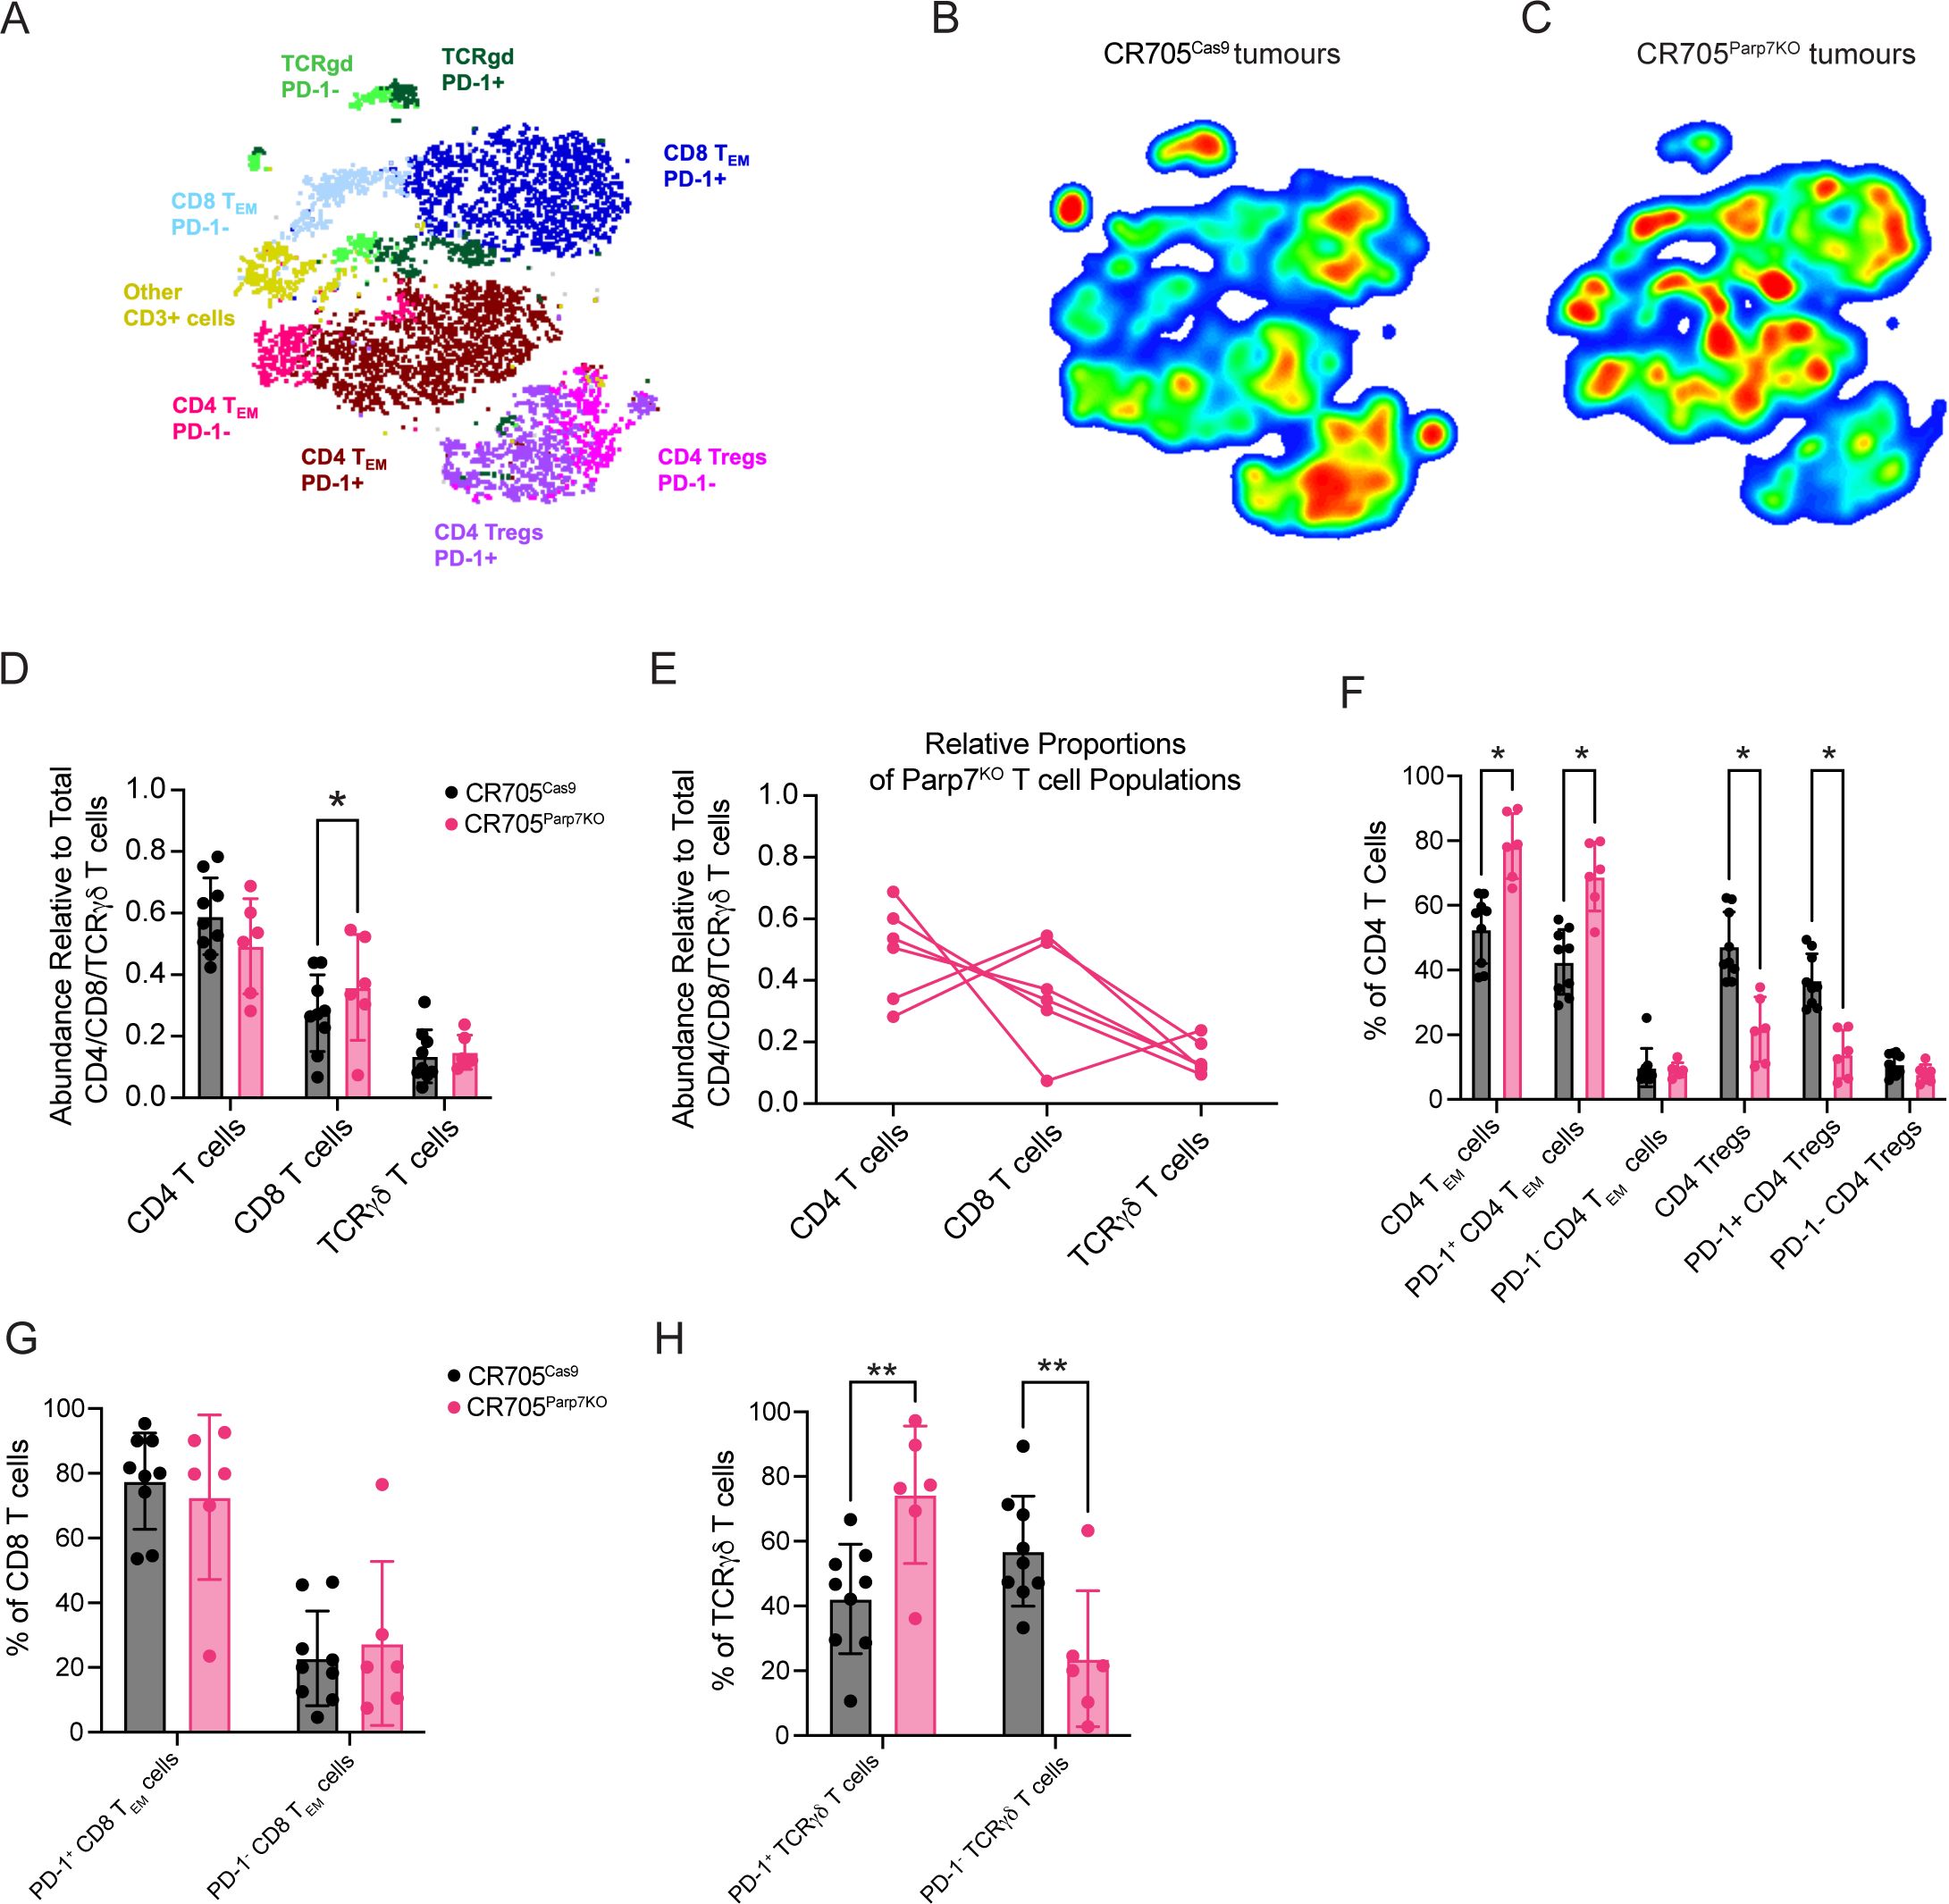
Figure 6. Spectral flow cytometry identifies differences in the proportion of tumour infiltrating T cell populations between CR705Cas9 and CR705Parp7KO tumours. (A) t-stochastic neighbour embedding (t-SNE) plot of T cell populations. Density plots of T cell populations from (B) CR705Cas9 and (C) CR705Parp7KO tumours. Red is higher density whereas blue is lower density. (D) Relative abundance of T cell populations in CR705Parp7KO compared with CR705Cas9 tumours. (E) Relative proportions of CD4, CD8 and TCRγδ relative to T cells in CR705Parp7KO tumours. Changes in the percentages of (F) CD4, (G) CD8 and (H) TCRγδ subsets between CR705Parp7KO compared with CR705Cas9 tumours. Cell counts and population frequencies determined using FlowJo V10 software. Differences in population frequencies between CR705Cas9 and CR705Parp7KO tumours were compared using Mann-Whitney test or mixed-effects analysis with Šídák’s multiple comparisons test. *p<0.05, **p<0.01.
Gene expression profiling of CR705Parp7KO tumours reveals increased activation of interferon and other immune signalling pathwaysRNA sequencing was then used to investigate gene expression profiles and identify cellular pathways differentially regulated between CR705Cas9 and CR705Parp7KO tumours. Principal component analysis revealed distinct clustering between CR705Cas9 and CR705Parp7KO tumours (Figure 7A). Hierarchical clustering in the form of a heatmap was used to show distinct expression patterns for overlapping differentially expressed genes (DEGs) between CR705Cas9 and CR705Parp7KO tumours (Figure 7B). We identified 1592 significantly changed genes of which 1142 were increased and 450 were decreased in CR705Parp7KO vs CR705Cas9 tumours (Figure 7C; Supplementary Table S3). Gene expression profiling confirmed increased expression levels of other members of the ARTD family including Parp9, Parp10, Parp12 and Parp14 in Parp7KO tumours. Parp7 (Tiparp) levels were also increased in Parp7 deficient tumours, which might be due to Parp7 levels in TILs. Cxcl10 and its receptor, Cxcr3, as well as granzyme A (Gzma) and granzyme B (Gzmb) levels, which support an activated T cell responses, were elevated in CR705Parp7KO tumours (Table 1; Supplementary Table S3). Pathway analysis using the Reactome database revealed increases in many immune regulated pathways in CR705Parp7KO tumours including immunoregulatory interactions, interferon signalling pathways, complement activation, neutrophil degranulation, as well as in GPCR signal pathways (Figure 7D). These data are consistent with PARP7’s role in regulating IFN signalling and suggest that the loss of PARP7 results in increased inflammation in the TME that may lead to increased immune infiltration and enhanced anti-tumour responses.
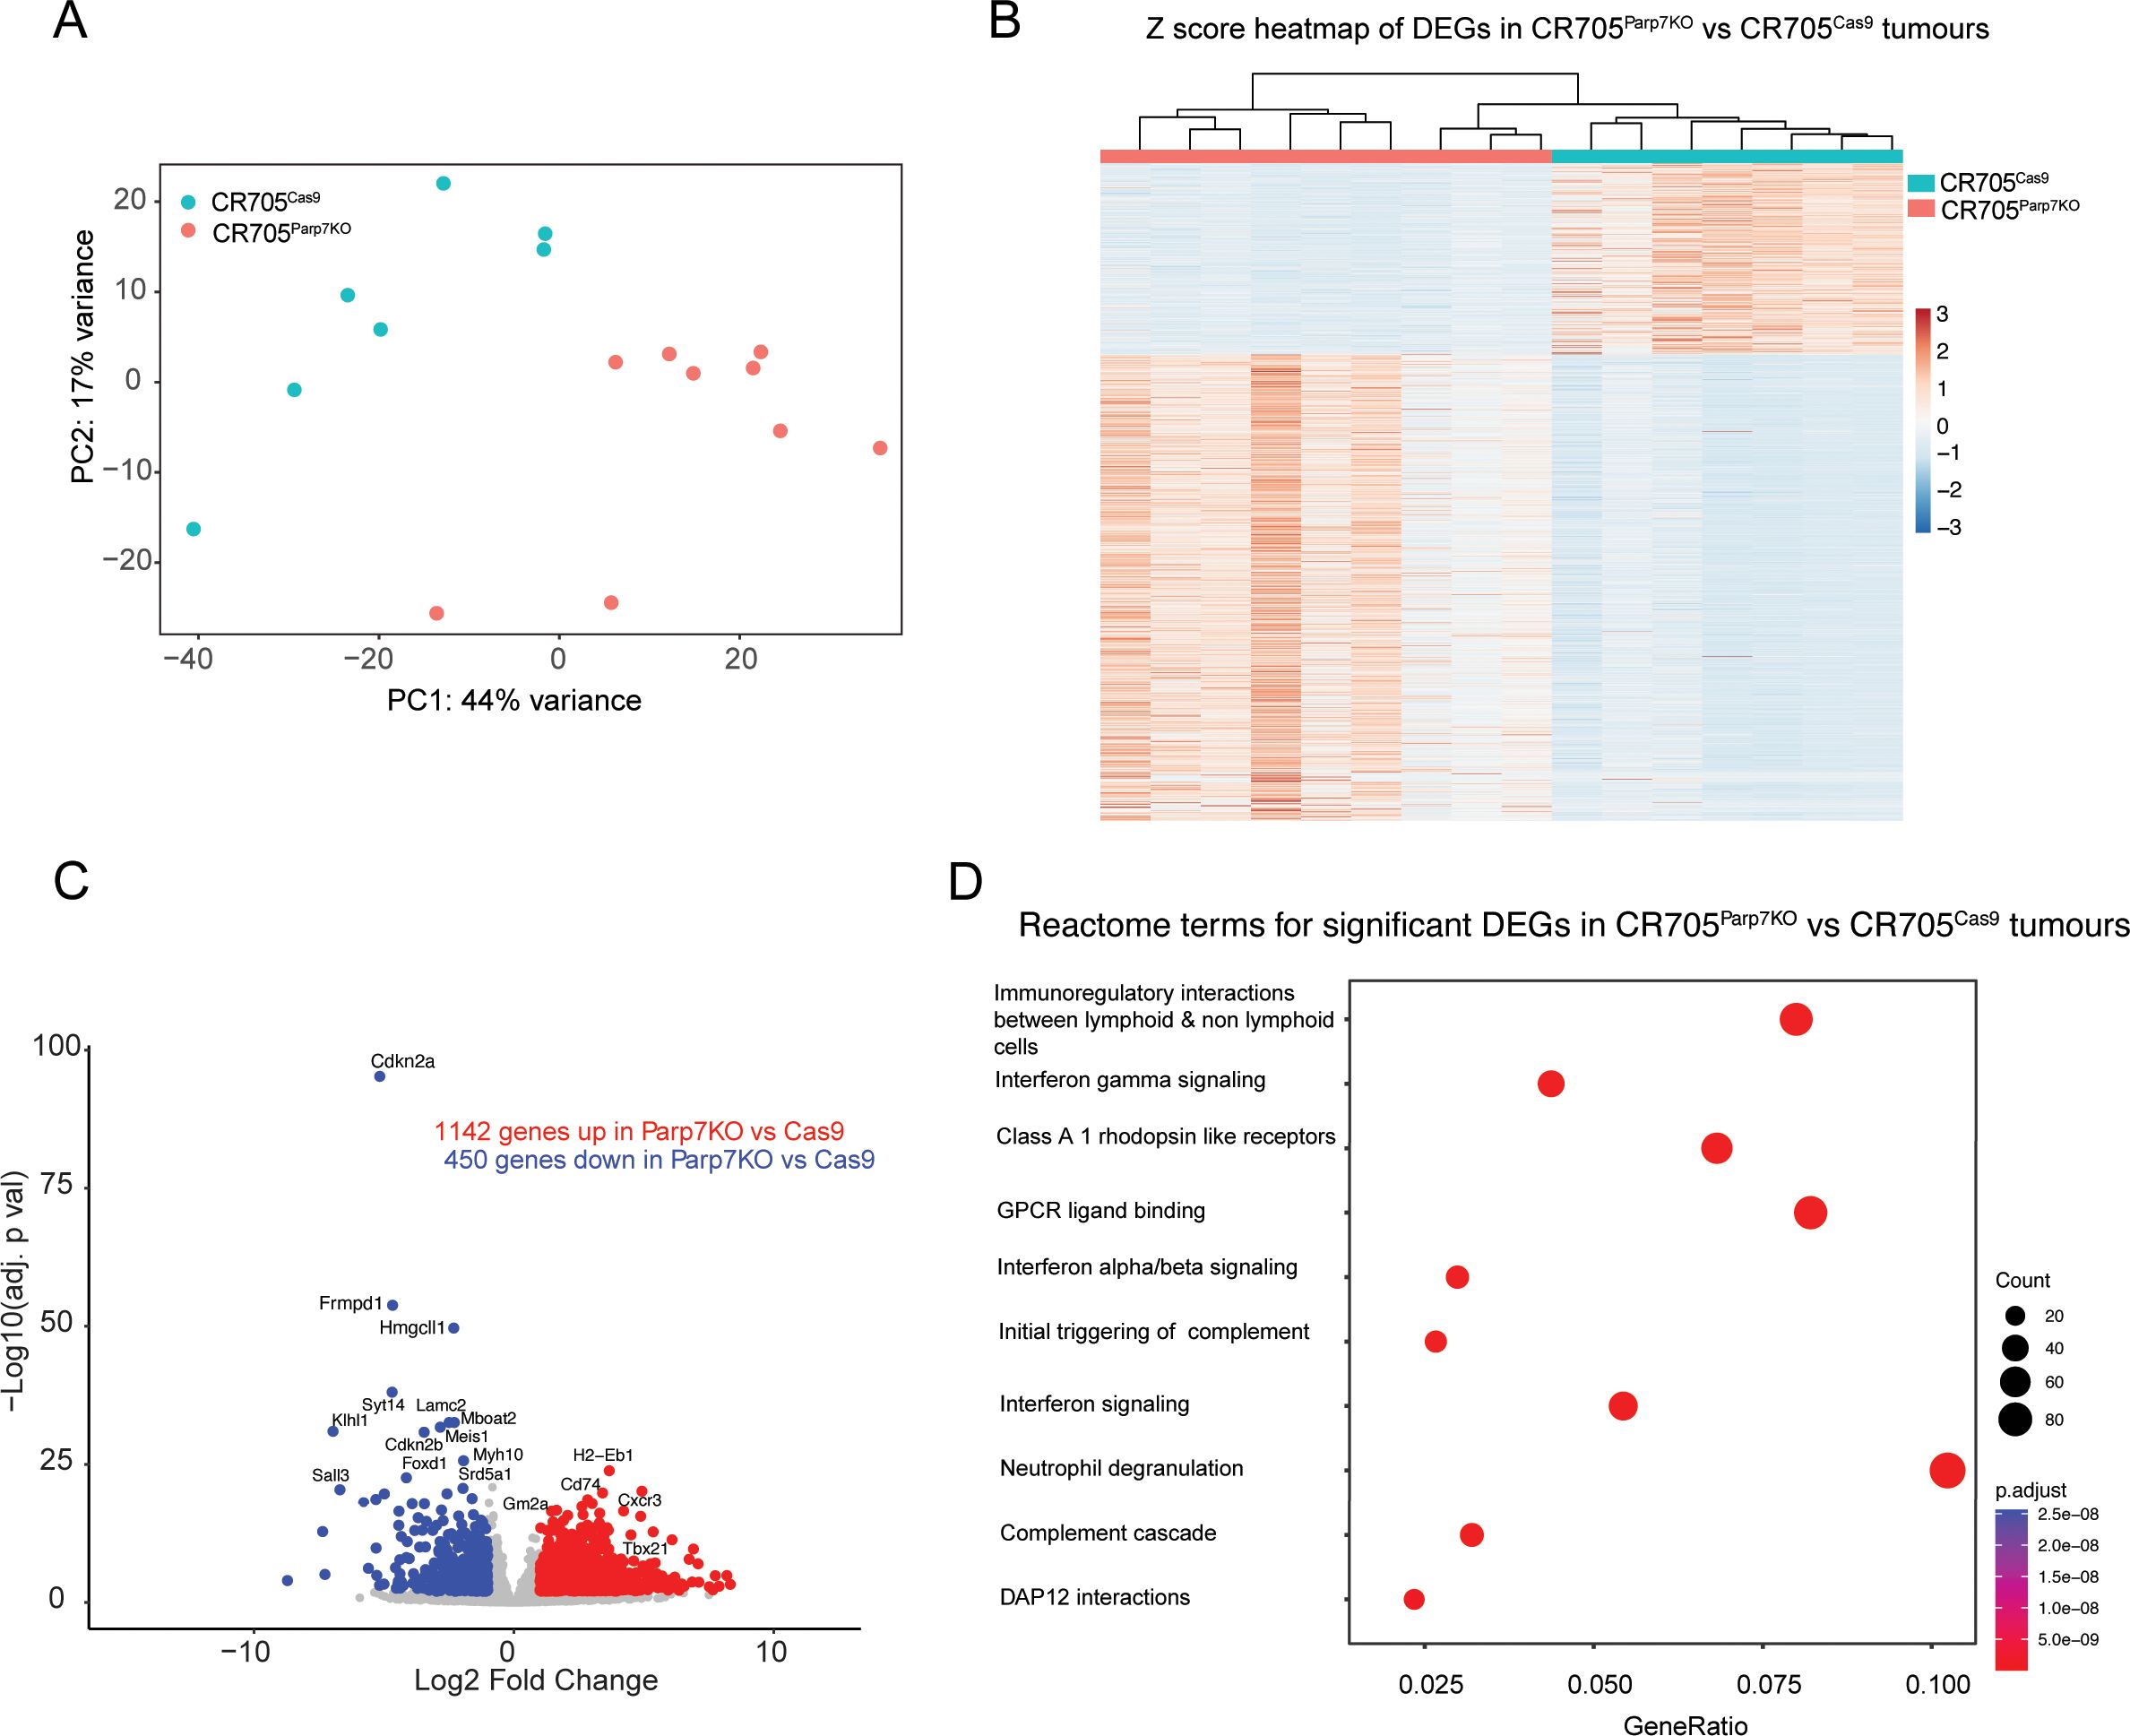
Figure 7. Gene expression profiling of CR705Parp7KO and CR705Cas9 tumours reveals an increased number of genes regulating interferon and inflammatory immune signalling. (A) Principal component analysis (PCA) plot of all samples. (B) Heatmap displaying illustrating the relative gene expression profiles of overlapping differentially expressed genes in CR705Parp7KO and CR705Cas9 tumours for each replicate. Genes and individual samples are arranged by hierarchical clustering. CR705Parp7KO and CR705Cas9 tumours are indicated with coloured bars at the top of the heat map. (C) Volcano plot showing the genes that are significantly upregulated and downregulated genes. Differentially expressed genes were determined using an absolute log2 fold change 1 and an adjusted p value < 0.01. (D) Top 10 pathways identified using the Reactome database that were significantly changed in Parp7KO compared with Cas9 tumours.
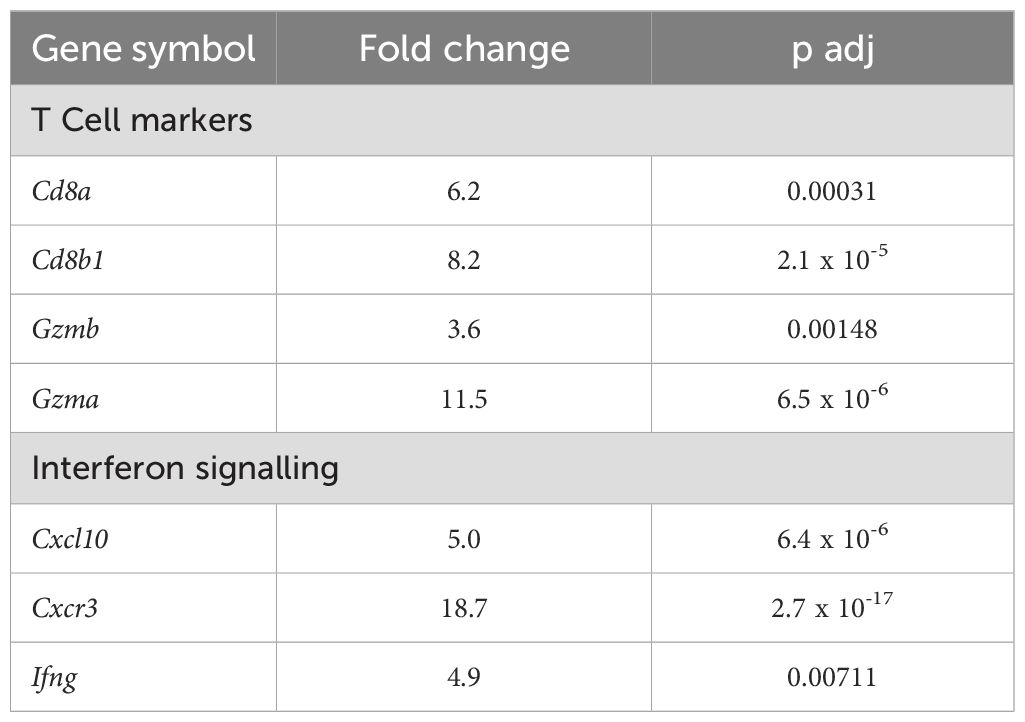
Table 1. Differentially expressed genes (DEGs) in CR705Parp7KO compared with CR705Cas9 tumours.
Reduced growth of CR705Cas9 and CR705Parp7KO tumours in Parp7HA/HA compared with C57BL/6 miceTo determine if loss of PARP7 activity in immune cells and other cells in the tumour microenvironment contributes to reduced tumour growth, we injected CR705Cas9 and CR705Parp7KO cells into Parp7HA/HA mice. Parp7HA/HA harbour a histidine 532 to alanine mutation in Parp7 resulting in a catalytic deficient PARP7. Characterisation of Parp7HA/HA, also known as TiparpH532A/H532A mice, has been described elsewhere (29, 32). Injection of CR705Parp7KO cells into Parp7HA/HA mice gave raise to tumours that grew more slowly compared with CR705Cas9 cells (Figure 8A). A comparison of the tumour volumes on day 21 between Parp7HA/HA than in C57BL/6 mice showed that CR705Cas9 and CR705Parp7KO tumours were significantly smaller in Parp7HA/HA compared with C57BL/6 mice (Figure 8B). We observed increased staining of T cells (CD3+) and CD4+ in CR705Parp7KO compared with CR705Cas9 tumours (Figures 8C–E). No increases in the staining of CD8+ T cells were observed in CR705Parp7KO compared with CR705Cas9 tumours in Parp7HA/HA mice. However, Parp7HA/HA Cas9 tumours had increased staining of CD8+ T cells compared with C57BL/6 Cas9 tumours (Figure 8E). RNA sequencing was then used to investigate gene expression changes and identify cellular pathways that were differentially regulated between CR705Cas9 and CR705Parp7KO tumours in Parp7HA/HA mice. We identified 863 significantly changed genes of which 264 were increased and 599 were decreased in CR705Parp7KO vs CR705Cas9 tumours (Figure 9A; Supplementary Table S4). Pathway analysis using the Reactome database revealed enrichment in pathways involving ribosomes, cellular metabolism and oxidative phosphorylation, but not inflammatory or immune regulated pathways (Figure 9B).
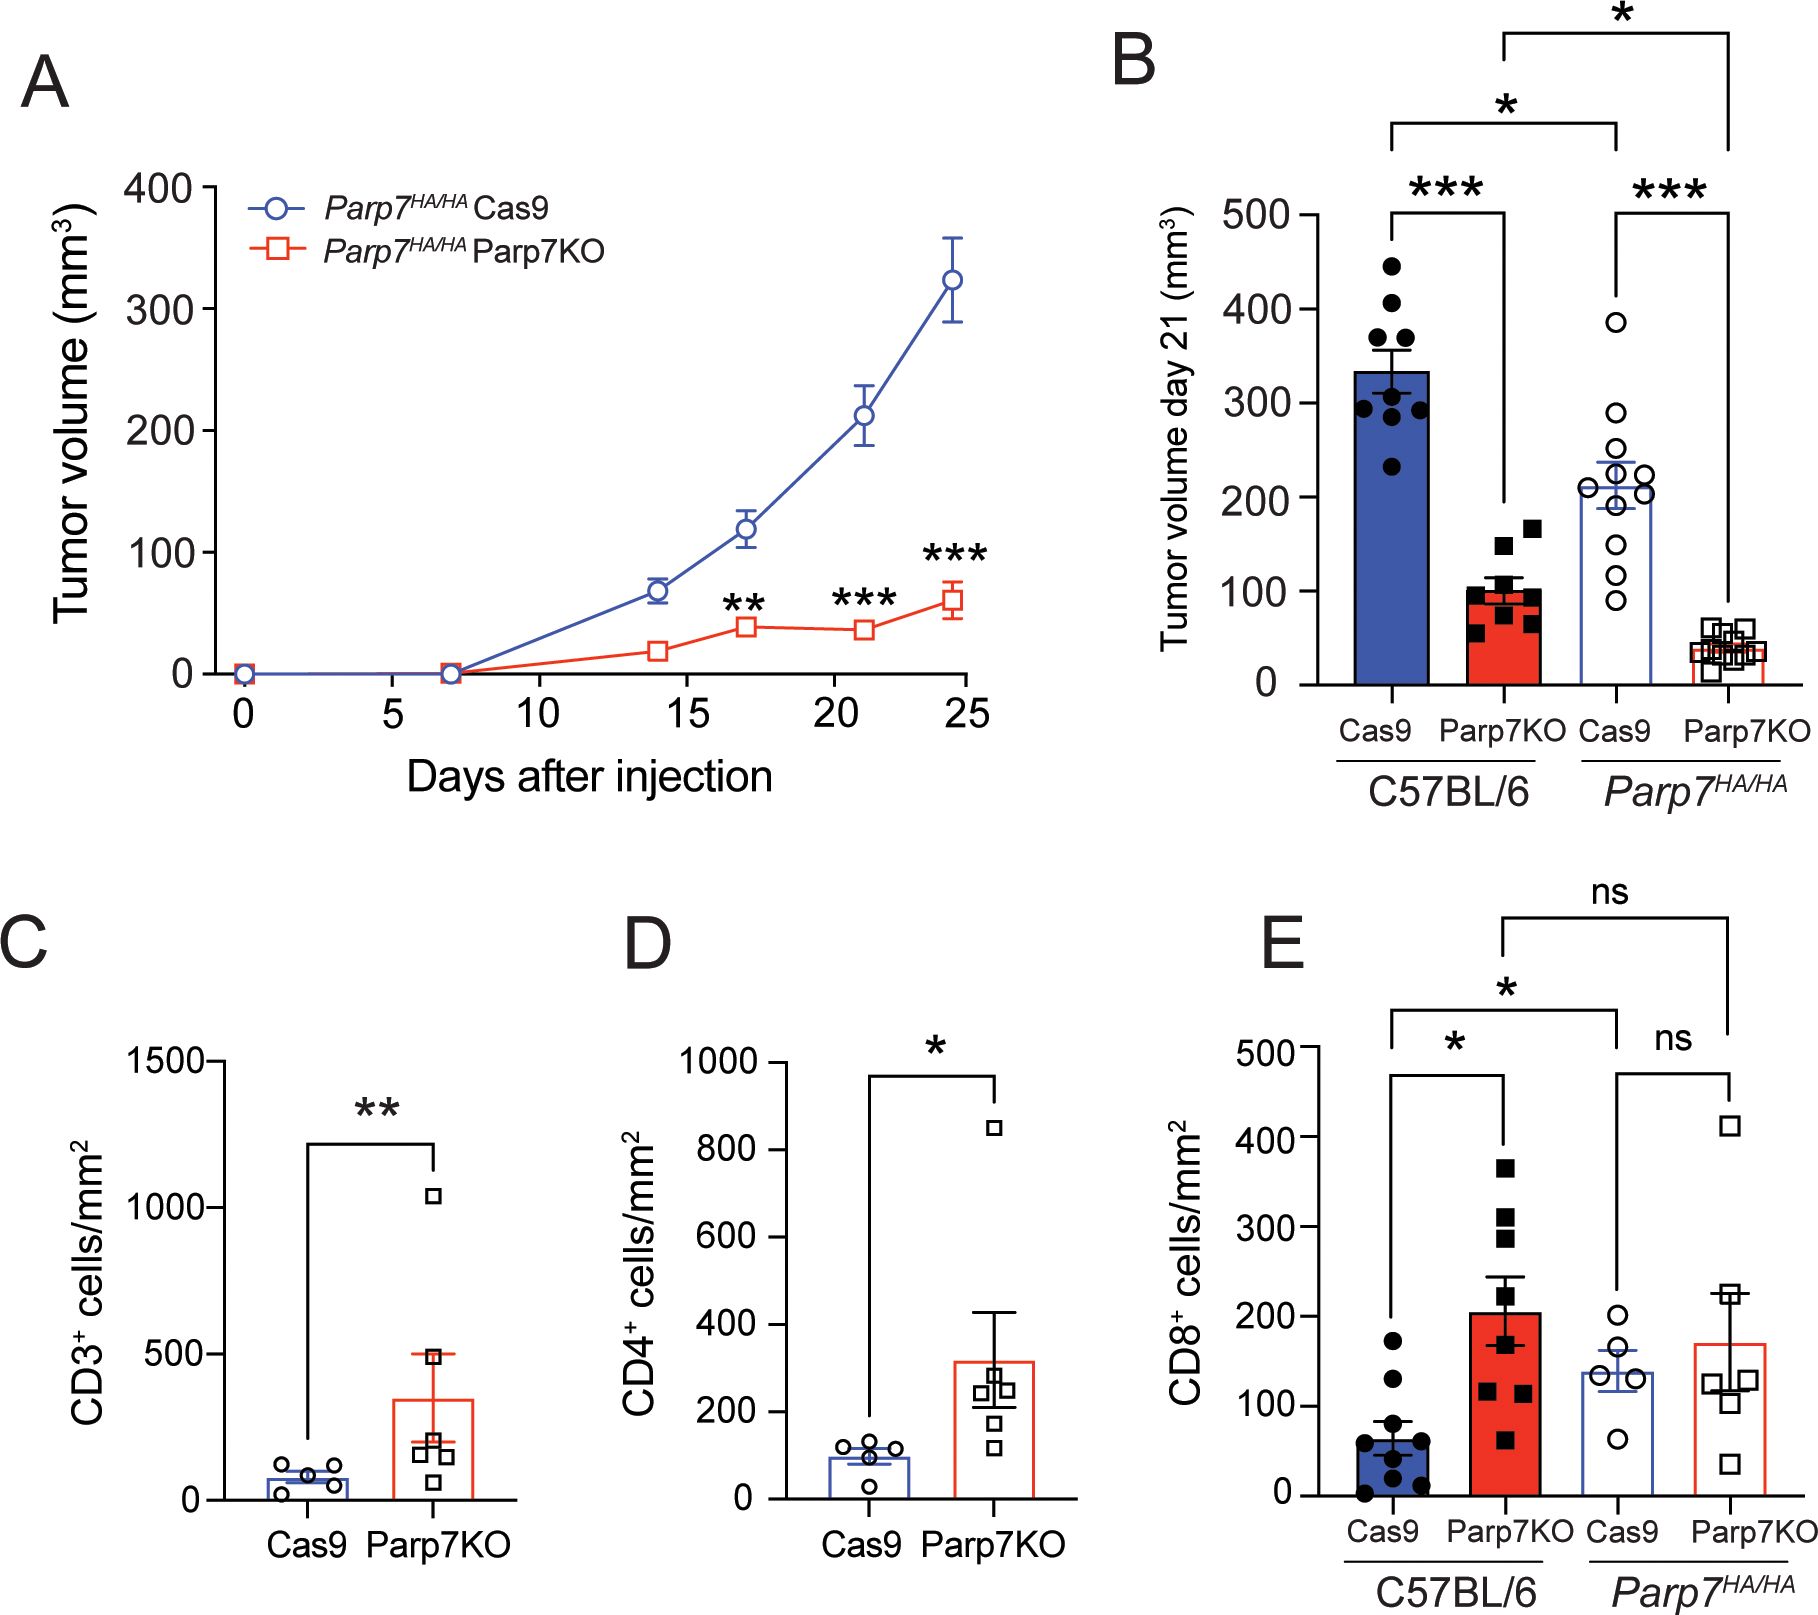
Figure 8. CR705Parp7KO cells form smaller tumours when injected into Parp7HA/HA catalytic deficient mice. (A) CR705Parp7KO cells gave rise to smaller tumours mice compared with CR705Cas9 cells when injected into female Parp7HA/HA. n=5-6. (B) At day 21 after injection, CR705Parp7KO and CR705Cas9 tumours grew more slowly in Parp7HA/HA compared with C57BL/6 mice. n=8-11. (C) CD3+ T cells and (D) CD4+ T cells compared with CR705Cas9 tumours. (E) CR705Parp7KO tumours had increased levels of infiltrating CD8+ cells compared with control. *p<0.05, ** p<0.001, ***p<0.0001. ns, not significant.
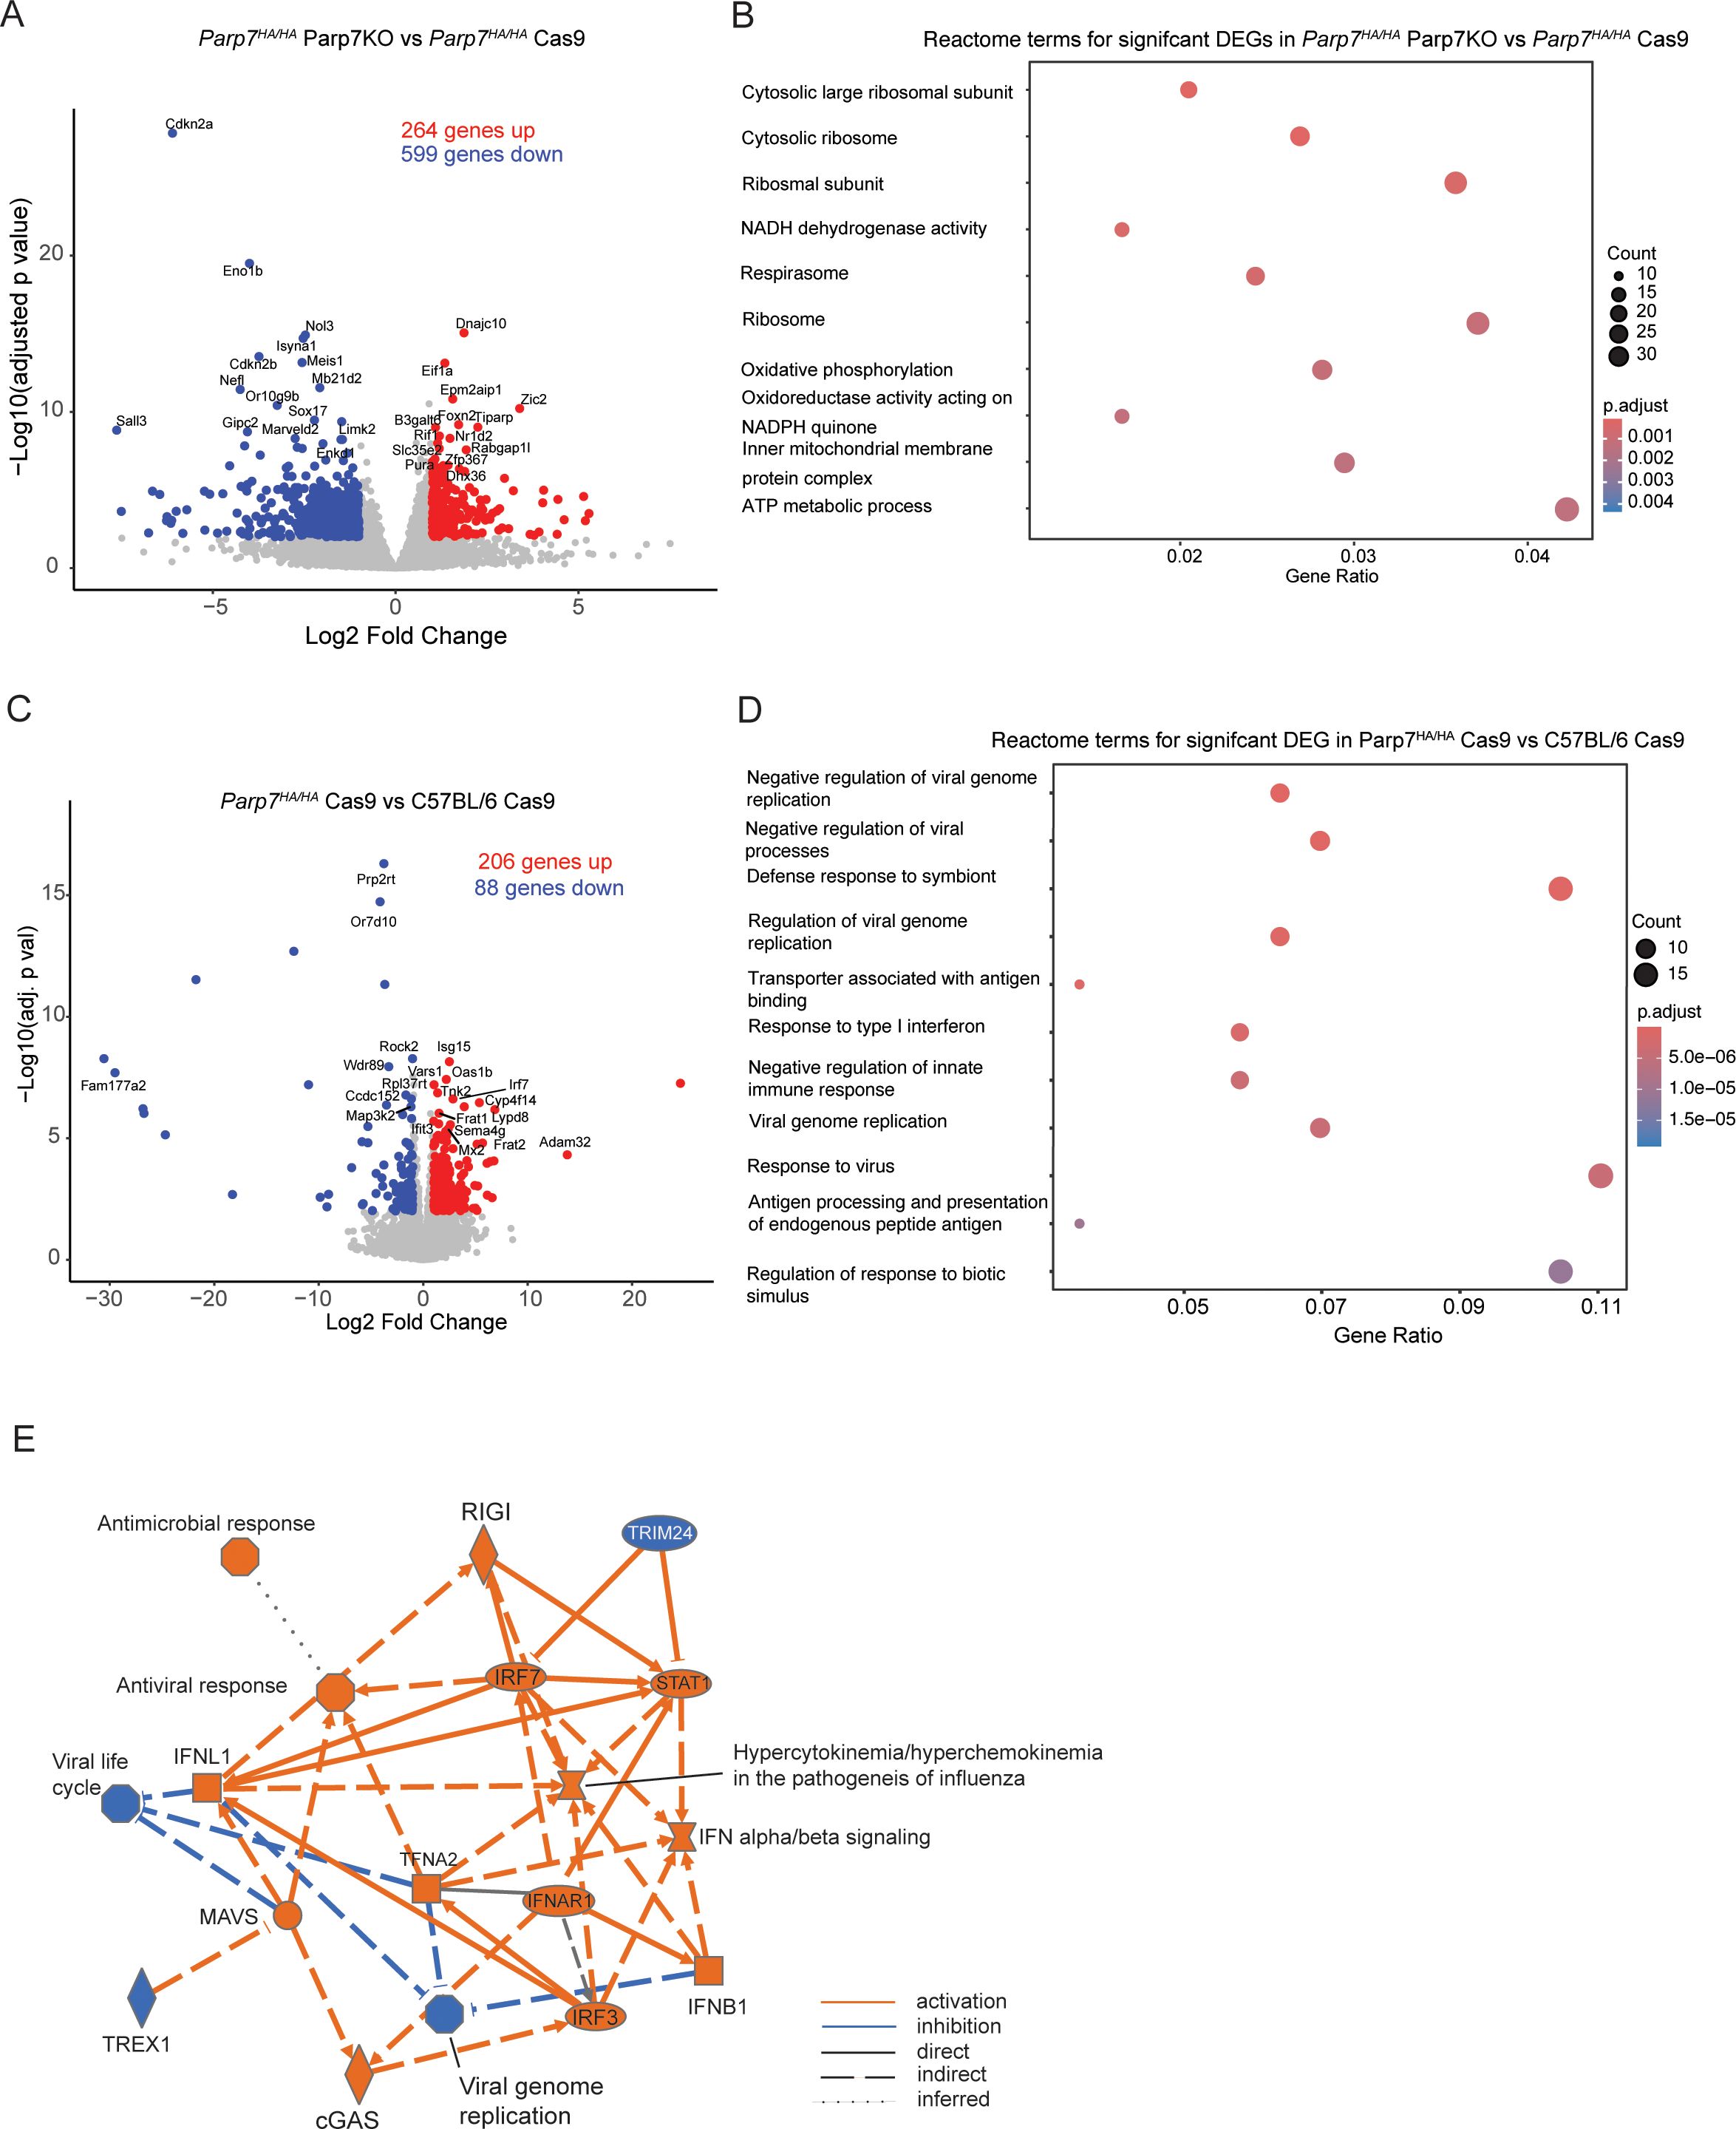
Figure 9. Gene expression profiling of CR705Parp7KO and CR705Cas9 tumours in Parp7HA/HA mice. (A) Volcano plot showing the genes that are significantly upregulated and downregulated genes CR705Parp7KO vs CR705Cas9 tumours in Parp7HA/HA mice. Differentially expressed genes were determined using an absolute log2 fold change 1 and an adjusted p value < 0.01. (B) Top 10 pathways identified using the Reactome database that were significantly changed in Parp7KO compared with Cas9 tumours. (C) Volcano plot of significantly upregulated and downregulated genes Cas9 tumours in Parp7HA/HA compared with C57BL/6 mice. (D) Top 10 pathways identified using the Reactome database that were significantly changed in Cas9 tumours in Parp7HA/HA compared with C57BL/6 mice. (E) Graphical summary of the most significant genes or pathways and the connections among them as determined by Ingenuity pathway analysis of DEGs from Cas9 tumours Parp7HA/HA compared with C57BL/6 mice. Orange lines specify activation, blue lines specify inhibition, solid lines indicate direct interaction, dashed lines indicate indirect interaction, and dotted lines indicate an inferred relationship.
To further investigate the role of PARP7 in IFN-I signalling in non-cancer cells of the TME, we determined gene expression changes and cellular pathways differentially regulated between CR705Cas9 tumours in Parp7HA/HA and C57BL/6 mice. We identified 294 DEGs of which 206 were increased and 88 were decreased in Parp7HA/HA and C57BL/6 mice (Figure 9C; Supplementary Table S5). Reactome pathway analysis revealed the enrichment of pathways involved in the negative regulation of viral replication and viral processes, and response to type I interferons (Figure 9D). Ingenuity pathway analysis was also used to identify cellular pathways that were commonly changed between CR705Cas9 tumours in Parp7HA/HA and C57BL/6 mice (Figure 9E). Cons
留言 (0)