Chinese mitten crabs (Eriocheir sinensis) are a valuable aquaculture species in East Asia (Sun et al., 2013; Qin et al., 2024). However, the expansion of intensive aquaculture models has created new opportunities for the crab farming industry but has also led to frequent occurrences of bacterial (Wang, 2011; Tian et al., 2024), viral (Zhang et al., 2004; Lorgen-Ritchie et al., 2023), and parasitic diseases (Li et al., 2011; Xin et al., 2024). These diseases have resulted in significant decreases in farm production and substantial economic losses (Sun et al., 2013) Although bacterial diseases in crabs are less common than viral and protozoan diseases (Wang, 2011), research has primarily focused on marine crabs that develop bacteremia or bacterial diseases affecting the exoskeleton (Krantz et al., 1969; Sizemore et al., 1975; Davis and Sizemore, 1982; Coates and Rowley, 2022). Previous studies on Callinectes sapidus, Callinectes bocourti (Wang, 2011), and Cancer irroratus (Newman and Feng, 1982) have observed significant reductions in blood cell counts and intravascular coagulation following Vibrio infection, with endotoxins in the bacterial cell wall penetrating tissues (Sritunyalucksana and Söderhäll, 2000; Jin et al., 2020; Zhang et al., 2022). Several studies have demonstrated the ability of Vibrio parahaemolyticus (V. parahaemolyticus) to infect Chinese mitten crabs and their offspring (Liu et al., 2020). Further research on the infection process and the harm caused by V. parahaemolyticus to Chinese mitten crabs is crucial for enhancing the overall health of crab breeding practices.
The extensive range of genes and virulence factors of Vibrio splays a crucial role in its heightened pathogenicity, which allows it to successfully invade a variety of host species, causing severe damage while evading host defenses. One highly dangerous species is V. parahaemolyticus, which poses a threat to both humans and aquatic animals in freshwater, estuarine, and marine environments (Baker-Austin et al., 2018). The genomes of V. parahaemolyticus exhibit a high level of diversity, with two chromosomes, frequent horizontal gene transfer, and high recombination rates (Martinez-Urtaza and Baker-Austin, 2020). Toxigenic strains of V. parahaemolyticus produce various virulence factors, such as the heat-stable direct haemolysin (TDH) and the TDH-associated haemolysin, which are responsible for Kanagawa hemolysis. The encoding genes for these toxin factors are tdh and trh, respectively (Okuda et al., 1997). Nonetheless, strains lacking hemolysins can also be associated with human infections (Martinez-Urtaza and Baker-Austin, 2020). In the aquaculture process, we concentrate on specific strains that have the potential to cause diseases in aquatic animals.
V. parahaemolyticus has been expanding globally, with epidemics often linked to coastal warming (Baker-Austin et al., 2018). In 2021, a specific strain of V. parahaemolyticus emerged in Asia, primarily impacting crustaceans, particularly shrimp (Powers et al., 2021). Infection with this bacterium, referred to as acute hepatopancreatic necrosis disease (AHPND) or early mortality syndrome (EMS), has been extensively researched and found to carry the binary toxins PirA Vp and PirB Vp in the extrachromosomal virulence plasmid pVA1 (Tran et al., 2013; Lee et al., 2015; Thitamadee et al., 2016; Vandeputte et al., 2024). Clinical indications of AHPND in shrimp include a damaged hepatopancreas, soft shells, discontinuous or atrophic gut, absence of contents, and pale discoloration, often resulting in mortality rates as high as 100% (Han et al, 2015). Our previous research has shown that this strain has the potential to infect freshwater crustaceans (Wu et al., 2017; Chen et al., 2021). Given that the Chinese mitten crab is a migratory and reproducing crustacean, it is also vulnerable to infection. Hence, it is imperative to conduct additional research on the infection mechanism and impact of V. parahaemolyticus on Chinese mitten crabs.
The protection of multicellular organisms from invasive species has greatly relied on the evolution of the immune system. To resist the invasion of pathogenic microorganisms, two effective immune systems have evolved: innate immunity and adaptive immunity (Lee and Söderhäll, 2002). Invertebrates exhibit limited adaptive immunity and primarily depend on innate immunity to combat pathogen invasion (Loker et al., 2004; Schulenburg et al., 2007; Tong et al., 2022). E. sinensis, being an invertebrate, predominantly utilizes innate immune mechanisms, such as agglutination, encapsulation, phagocytosis, coagulation proteins, and bactericidally active peptides (Vazquez et al., 2009). The humoral immune system activates the phenol oxidase (ProPO) system, which leads to the production of antimicrobial peptides (AMPs). Cellular immune responses primarily involve phagocytosis and encapsulation of pathogenic bacteria (Lemaitre et al., 1995; Lemaitre and Hoffmann, 2007; Chen et al., 2025). The current understanding of the immune regulation of Chinese mitten crabs in response to V. parahaemolyticus infection is limited. Further investigation is needed to explore the immune response of Chinese mitten crabs at various stages of Vibrio infection and analyze the differential transcription of the transcriptome.
E. sinensis, a migratory crustacean, is susceptible to infection by Vibrio, particularly V. parahaemolyticus, which carries the priA/priB toxin gene. This study aims to develop an animal infection model using molecular biology and RNA-seq technologies. The model will be used to comprehensively analyze the changes in body fluid enzyme activity factors, hepatopancreas damage, and hepatopancreas function of E. sinensis during the infection process with V. parahaemolyticus. Furthermore, the study will investigate the differential expression of transcriptome genes, immune response, and changes in body indicators of experimental animals during the infection process. The findings from this study will contribute to a better understanding of the infection process of V. parahaemolyticus and the host’s immune mechanism.
2 Materials and methods2.1 Information about test animals and V. parahaemolyticusSpecimens of E. sinensis were acquired from Baodao Agricultural Technology Co., Ltd., located in Dongping County, Shandong Province, which specializes in aquaculture. These crabs had a mean weight of 15 ± 0.5 grams. They were housed in a laboratory tank equipped with a circulating water system and aerated with tap water. The temperature of the water was maintained at 26 ± 1.5°C. To provide hiding spots, PE pipes and artificial water plants were placed within the tank. Prior to the experiment, the crabs were acclimated in the laboratory for a duration of 1 week. Pre-experiments and acute infection experiments were conducted once the crabs’ state was stable. Prior to the commencement of the experiment, we randomly selected 10 experimental animals for the assessment of V. parahaemolyticus. The results indicated that these experimental animals did not harbor V. parahaemolyticus. Throughout the acclimation period, the crabs were provided with commercial crab feed; however, feeding was ceased on the day preceding the experiment. Specifically, the strain of V. parahaemolyticus was isolated from red claw crayfish culture ponds.
The V. parahaemolyticus strain utilized in this experiment was obtained, purified, and identified by the Research Laboratory of Aquatic Animal Health Breeding within the College of Animal Science and Technology at Shandong Agricultural University. This strain is stored at the Phage Research Centre within the College of Agriculture at Liaocheng University. The whole genome analysis of the strains utilized has been completed, and the original sequencing data are stored in the National Center for Biotechnology Information (NCBI) under the storage number PRJNA902323. To culture the strains, overnight growth was achieved on citrate bile salt sucrose agar sulphate plates (TCBS, Cat: HB4130, Qingdao Hope Biotechnology Co., Ltd., China). Single colonies were then transferred to LB broth (LB, Cat: HB0128, Qingdao Hope Bio-Technology Co., Ltd., China) and incubated for 6 hours. Subsequently, 1 mL of broth was centrifuged at 4000 rpm for 5 minutes, the supernatant was discarded, and 50 μL of RNase-free water was added. To detect the virulence genes carried by the experimental strains, PCR was used. After amplification and sequencing of the PCR products, we performed BLAST comparative analysis on all valid PCR results using the NCBI database. The sequences of all virulence genes can be found in Table 1. The primer sequences pertinent to this article are also listed in Table 1.
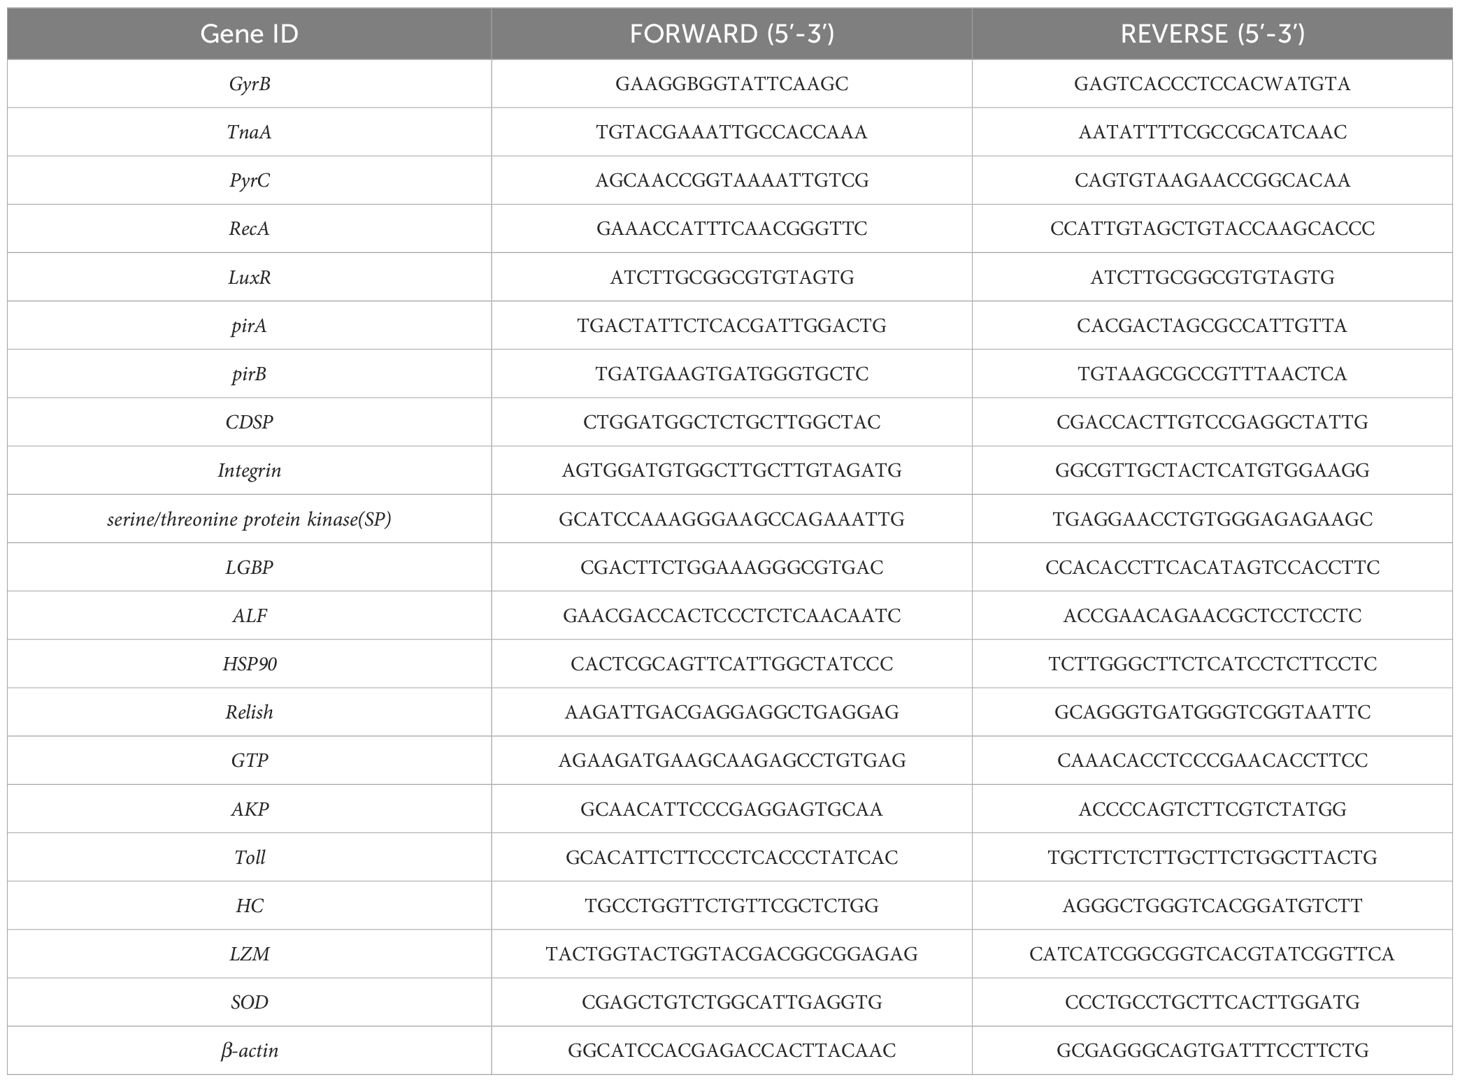
Table 1. Primer sequences.
2.2 Modeling of infection and sample collectionA total of 100 specimens of Chinese mitten crabs were randomly distributed into 5 groups, each comprising 20 individuals. Cultivated strains (100 mL) were incubated overnight at a temperature of 37°C, after which they were centrifuged at a speed of 4000 rpm for 10 minutes using a high-speed centrifuge. The supernatant was discarded, and the strains were washed three times using a phosphate buffer solution. The concentration of the bacterial solution was measured using an ultra-microspectrophotometer and subsequently diluted with a buffered salt solution to obtain concentrations of 1×10⁵, 1×10⁶, 1×10⁷, and 1×10⁸ CFU/mL. Each experimental subject was administered an injection of 50 μL of the bacterial solution, whereas the control group received an injection of the same volume of phosphate-buffered saline (PBS).
The mortality rate of the experimental group was recorded at various intervals following the initiation of the disease (Supplementary Table S1), and the LD50 concentration of the pathogenic strain was determined to be 1.78×10⁶ CFU/mL after 24 hours using this methodology (Saganuwan, 2016). In the subsequent stage, 200 experimental subjects were arbitrarily selected and divided equally into two groups: the experimental group and the control group, each containing 100 specimens. The experimental group was administered an injection of 50 μL of fresh bacterial solution at the LD50 concentration, whereas the control group was administered an injection of the same volume of phosphate-buffered saline (PBS).
Samples of tissue from the hepatopancreas were procured at intervals of 6, 12, 24, 48, and 72 hours after the infection. Based on clinical symptoms and behavioral observations of Chinese mitten crabs, individuals exhibiting significant pathological conditions within 6 hours after challenge were categorized as the susceptible group (Es_SC), whereas those in good health or displaying no apparent symptoms after 24 hours were classified as the disease-resistant group (Es_AI). The individuals injected with PBS were designated as the control group (Es_CG). When collecting samples, begin by using 75% alcohol-soaked cotton balls to thoroughly wipe the entire body of the experimental animals. Once all samples have been obtained, they should be rapidly frozen in liquid nitrogen to preserve their freshness, and stored in a refrigerator at -80°C for subsequent assays to determine immunoenzymatic activity and extract RNA, respectively. Additionally, hepatopancreatic tissues were collected at different intervals after rinsing with phosphate-buffered saline and fixing them with a solution of 4% paraformaldehyde. Pathological sections were prepared to observe any changes in pathology (Zhang et al., 2020).
2.3 Histopathological analysisHistopathological analysis was conducted on the hepatopancreas of E. sinensis at 6, 24, and 72 hours after infection, with the PBS injection group serving as the control. The hepatopancreas was fixed with paraformaldehyde for 24 hours and then embedded in paraffin blocks. Subsequently, the tissue was dehydrated using different concentrations of ethanol. Using a microtome, the blocks were sectioned into thicknesses of 5-6 μm. The resulting sections were stained with hematoxylin and eosin and subsequently examined under light microscopy following fixation with resin.
2.4 Detection of humoral immunoenzymatic activityTo detect humoral immunoenzymatic activity, tissue samples were thawed from the -80°C refrigerator. Filter paper was de-watered, weighed, and cut appropriately with scissors. The cut tissue samples were placed in sterile 1.5 mL centrifuge tubes and mechanically ground on ice using a grinder. After spinning at 2500 revolutions per minute (rpm) for 10 minutes, the liquid above was discarded. Subsequently, the tissue was mixed with saline solution to produce a 1% solution of crushed tissue for examining the activities of immune-related enzymes. The primary immune-related enzymes evaluated included acid phosphatase (ACP: A060-2-2), peroxidase (PO: A084-1-1), total antioxidant capacity (T-AOC: A015-2-1) alkaline phosphatase (AKP/ALP: A059-3-1), alanine transaminase (GPT/ALT: C009-1-1), aspartate transaminase (AST/GOT: C010-2-1), Lysozyme (LZM: A050-1-1) and superoxide dismutase (SOD: A001-4-1). These kits were procured from Nanjing Jiancheng Bioengineering Institute in China (http://www.njjcbio.com/) and were used according to the manufacturer’s instructions. Three biological replicates were conducted for each sample.
2.5 RNA sequencing groupingRNA was extracted from three samples randomly selected from a total of nine collected samples, which were maintained at low temperatures throughout the process. Total RNA extraction from crabs was performed according to the manufacturer’s instructions using TRIzol (Invitrogen, USA). Each high-quality, non-degraded RNA sample underwent library construction using the NEBNext® Ultra™ RNA Library Preparation Kit (NEB, USA) with 1 μg per sample. The HiSeq 4000 platform (Illumina, USA) was used to generate 150 bp paired-end (PE) reads. RNA-Seq analysis and clustering were outsourced to Novogene Biotechnology Co., Ltd. in Beijing, China, which employs Illumina sequencing technology. Initial processing of raw data (raw reads) in fastq format was performed using an in-house perl script.
2.6 Data quality control and bioinformatics analysisFor RNA-seq data without a reference genome, data quality control was performed with the Trimmomatic software (Bolger et al., 2014) to remove adapters and low-quality reads (N content >5%, base mass values <20). Clean reads were obtained and then assembled using Trinity (Grabherr et al., 2011) to generate a reference sequence for subsequent analysis.
To identify genes that are under-expressed or only partially detected across samples, all samples from the same species were combined to achieve a comprehensive assembly result for subsequent analyses, such as differential expression analysis. However, samples from different species underwent separate assemblies due to significant genomic differences. In the absence of a reference genome, transcriptome analysis involved assembling the obtained sequences into transcripts and utilizing the Corset software (Davidson and Oshlack, 2014) for hierarchical clustering. The clustered sequences served as a reference for subsequent analyses, including quality control, annotation using seven databases (NR: NCBI non-redundant protein sequences; NT: NCBI nucleotide sequences; Kyoto Encyclopedia of Genes and Genomes) KEGG: http://www.genome.jp/kegg/; SwissProt: http://www.ebi.ac.uk/uniprot/; PFAM: http://pfam.sanger.ac.uk/; GO: http://www.geneontology.org; KOG: http://www.ncbi.nlm.nih.gov/COG/), quantification, differential expression analysis, and functional enrichment.
2.7 RT-qPCR validationThe 2-ΔΔCt was employed to compute the relative gene expression (Livak and Schmittgen, 2001). In this investigation, we assessed the expression levels of four genes in diverse samples via RT-qPCR, examining gene alterations during infection. To facilitate the comparison of detected samples during the exponential phase of the RT-qPCR reaction, it is essential to first establish a specific fluorescence signal threshold. Typically, this threshold is determined based on the fluorescence signals from the initial 15 cycles of the PCR reaction, which serve as the fluorescence background signal. If a detected fluorescence signal surpasses this threshold, it is regarded as a true signal and can be utilized to define the threshold cycles (Ct) for the sample. There exists a linear inverse relationship between the Ct value of each template and the logarithm of the starting template’s copy number in the sample; thus, a higher starting copy number corresponds to a lower Ct value. Each specimen was analyzed in triplicate, and the Ct values were averaged. The primer sequences employed in this study are listed in Table 1.
2.8 Statistical analysisMost data analyses were conducted using software or built-in algorithms within the software packages. Feature enrichment tests were carried out using the GOseq package, while differential expression analyses were performed using the DESeq2 package. The criteria used for screening differentially expressed genes were | log2(Fold Change) | > 1, with a padj value of less than 0.05 (P < 0.05). considered statistically significant.
To assess the significance of differences between the means of two datasets, Independent Student’s t-tests were performed using SPSS version 22.0. This analysis included comparisons between RT-qPCR and RNA-seq data, with a p-value below 0.05 (P < 0.05). indicating statistical significance, a p-value below 0.01 (P < 0.01). indicating high significance, and a p-value above 0.05 (P > 0.05) indicating no significance.
3 Result3.1 Information on V. parahaemolyticus strainTo analyze the virulence gene present in the strains, we conducted a gel electrophoresis (PCR) analysis. The cultured fresh colonies were identified using PCR, confirming the presence of several virulence genes: Gyr (629bp), TnaA (463bp), PyrC (533bp), RecA (773bp), and LuxR (679bp). Additionally, the virulence genes PirA (284bp) and PirB (392bp), which are associated with pancreatic necrosis, were also detected (Figure 1) (Cheng and Wang, 2022). The PCR products were sequenced by a sequencing company and subsequently compared with known virulence gene sequences of V. parahaemolyticus in the NCBI database. The results indicated that all identified virulence genes were pathogenic genes associated with V. parahaemolyticus. The antibacterial susceptibility test revealed that the macrolide antibiotic erythromycin exhibited no activity against the bacteria (Table 2).

Figure 1. V. parahaemolyticus virulence gene gel electrophoresis. (A) M:2000bp marker, lane1: Gyr gene (629bp), lane2: TnaA gene (463bp), lane3: PyrC gene (533bp), lane4: RecA gene (773bp) and lane5: LuxR gene (679bp); (B) lane1.2: PirA gene (284bp), lane 3.4: PirB gene (392bp).
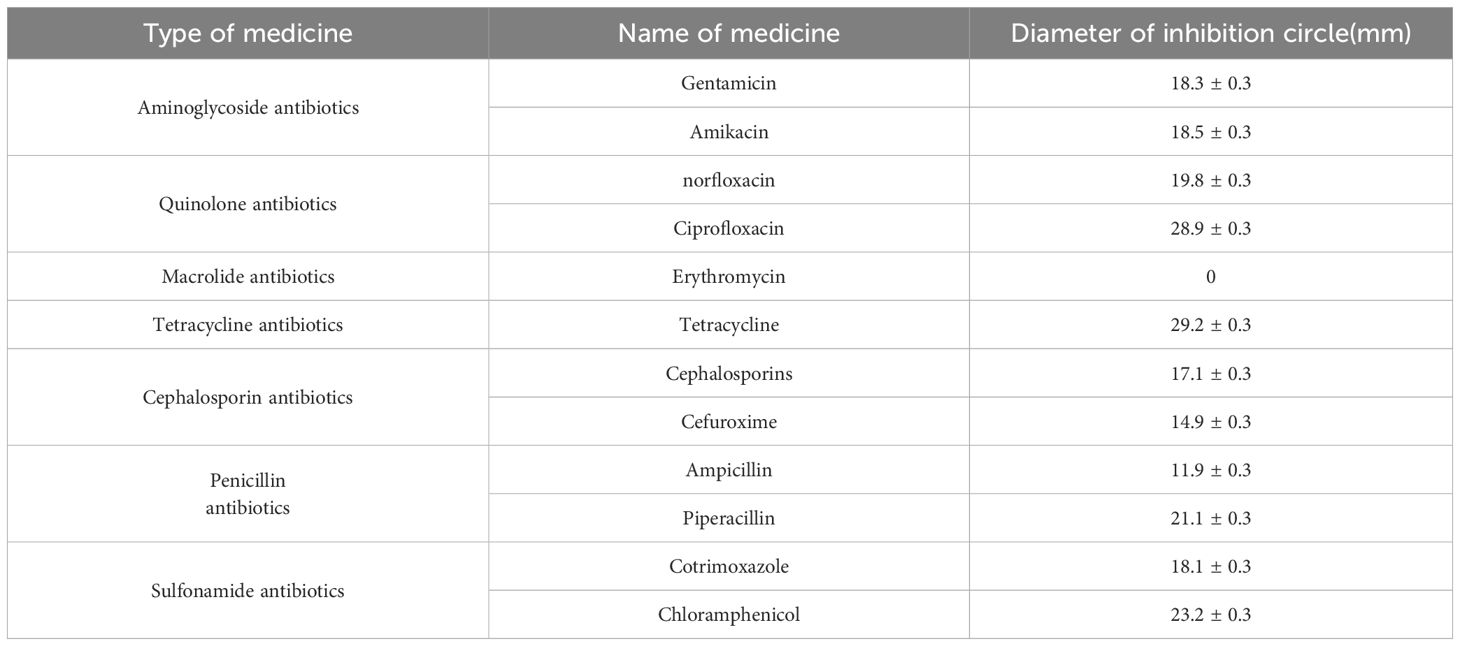
Table 2. Drug sensitivity test results for V. parahaemolyticus.
3.2 Determination of LD50 and histopathological changes of hepatopancreasTo analyze the pathogenicity of V. parahaemolyticus, we established an animal model to study the infection in Chinese mitten crabs. Subsequently, we assessed the median lethal dose (LD50) within a 24-hour period. The specific results at each time point are presented in Supplementary Table S1. The LD50 of this pathogenic strain was calculated to be 1.78×10⁶ CFU/mL using a formula calculation method (Saganuwan, 2016). An animal infection model was established using the LD50 concentration. The changes in the hepatopancreas tissue of clinical animals were analyzed at various time points during the early, middle, and late stages of infection. The control group exhibited good condition and vigor, with crabs displaying active behavior, strong grip in their claw feet, and intact hepatopancreas with clear folds upon dissection. The gills appeared light cyan with neat filaments (Figures 2A, 3A). After 6 hours of infection with V. parahaemolyticus, diseased crabs demonstrated significant abnormalities, weakened vitality, and reduced crawling ability. Dissection revealed a dark yellow appearance of the hepatopancreas, cloudy and blackened gills, and dilated stellate structures with contracted folds in the hepatopancreatic tissue (Figures 2B, 3B). At 24 hours post-infection, crabs exhibited low vitality, moderate crawling ability, and a tendency to escape when disturbed. The hepatopancreas appeared significantly orange-yellow with slight erosion, and the gills turned black. Hepatopancreatic tissue displayed enlarged vacuoles, ruptured stellate structures, and continued expansion (Figures 2C, 3C). By 72 hours after infection, the survival rate of diseased crabs was very low. They showed minimal activity, with no tendency to break free when handled. Dissection revealed necrosis in the hepatopancreas, eroded liver tissue with whitish coloration, and completely dark brown gills. The hepatopancreatic ductal structure exhibited increased folding contraction and extensive loss of nuclei (Figures 2D, 3D).
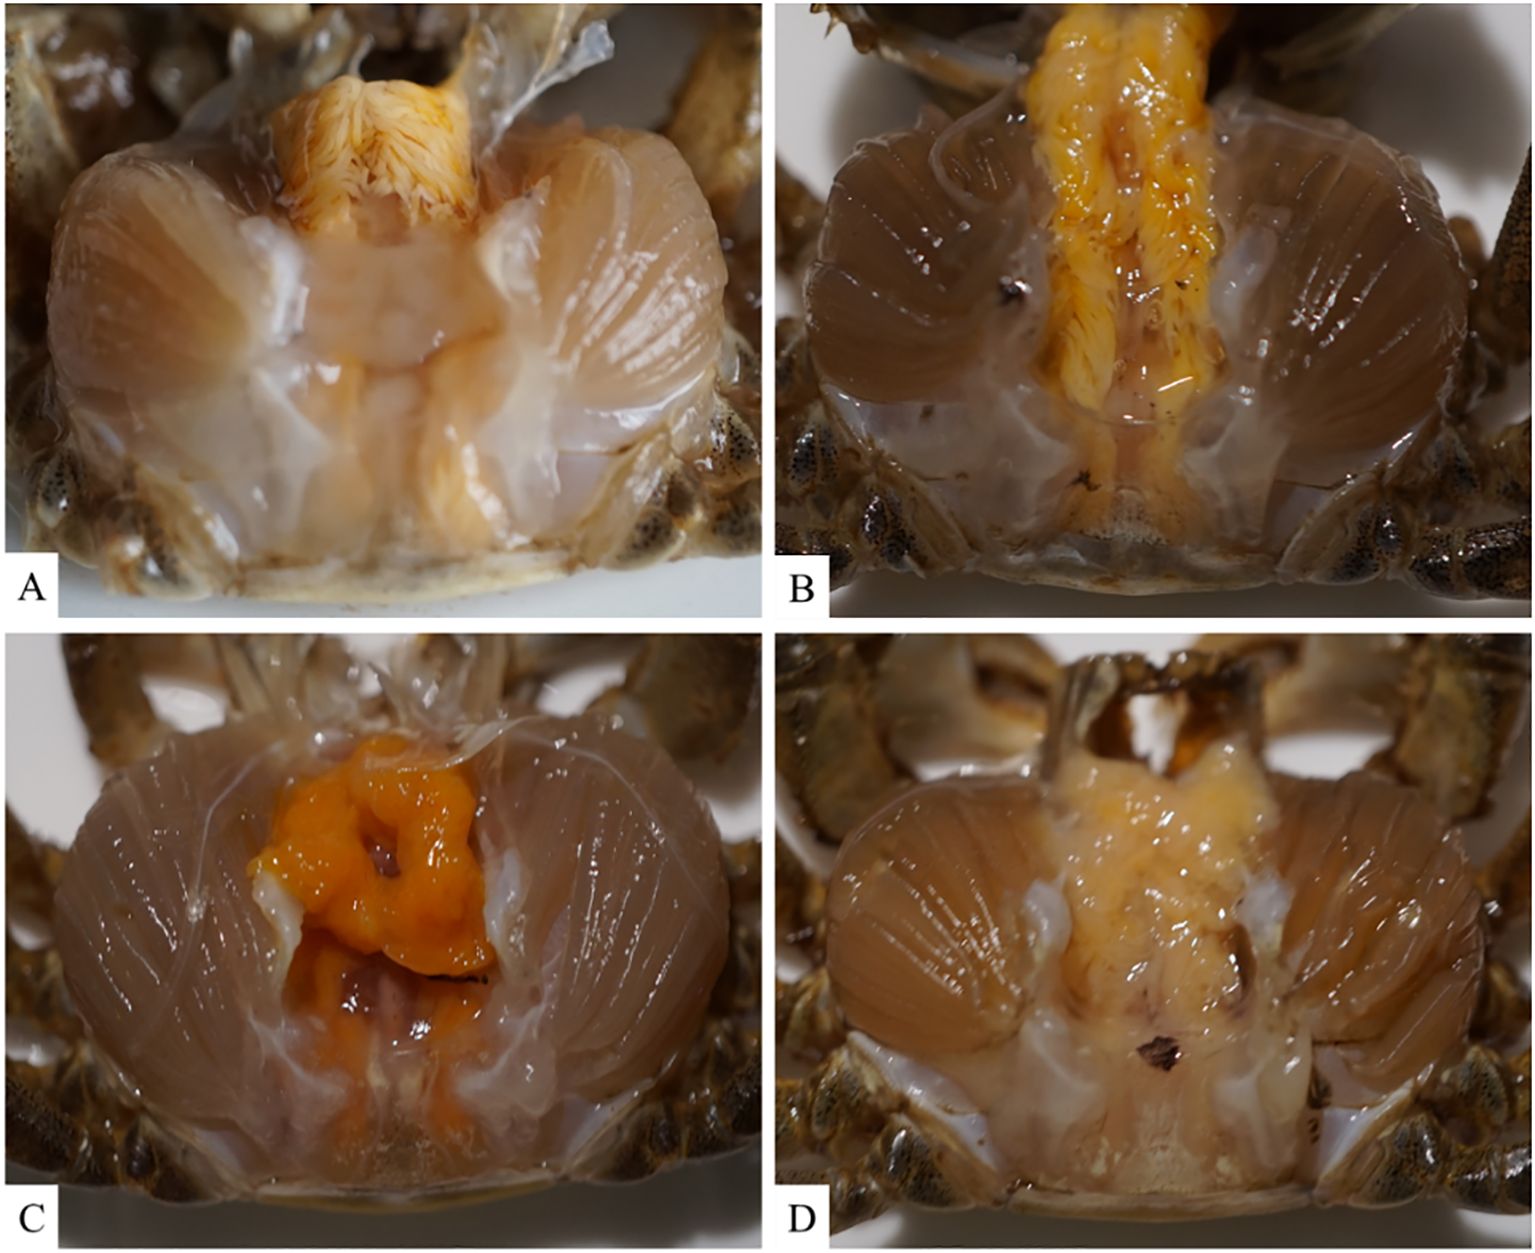
Figure 2. Illustrates the clinical histological changes in the hepatopancreas of Eriocheir sinensis resulting from Vibrio parahaemolyticus infection at various time points. (A) depicts the anatomy of a healthy crab from the control group, while (B–D) present the anatomy of the hepatopancreas in diseased crabs at 6, 24, and 72 hours post-infection, respectively.
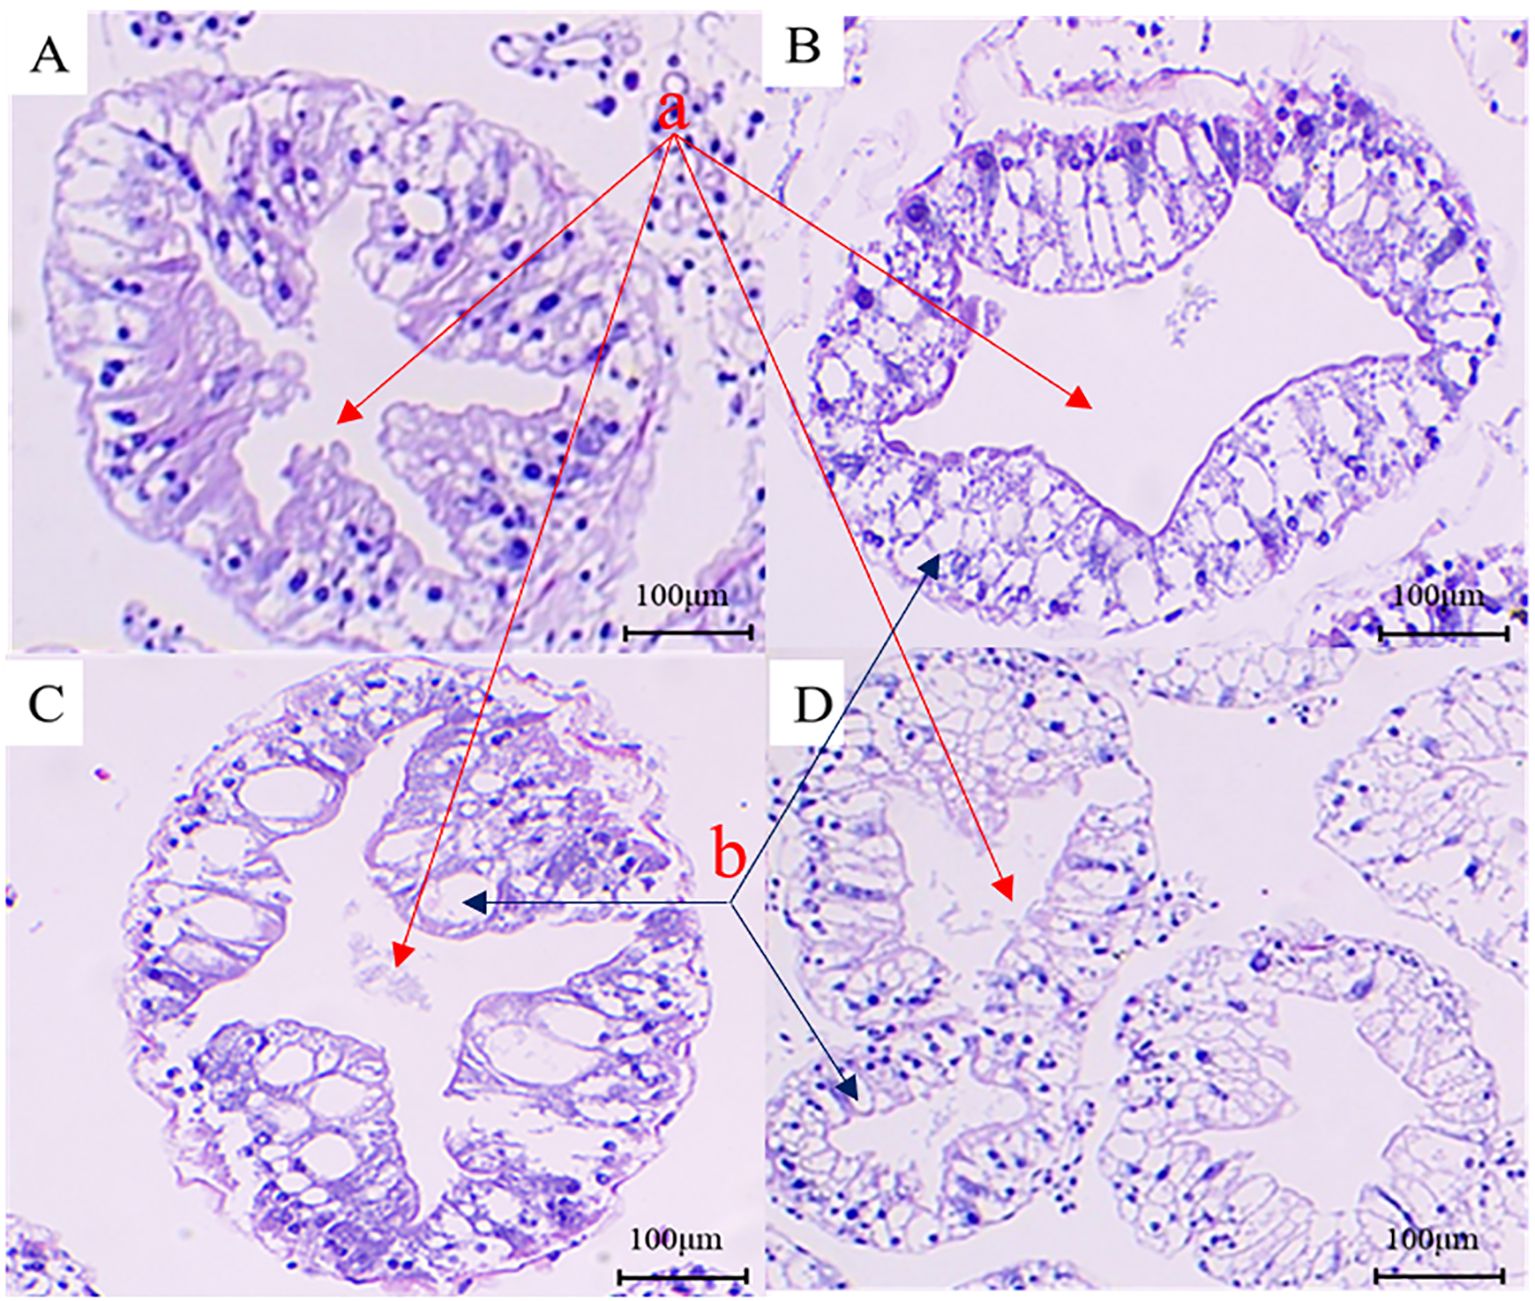
Figure 3. Analysis of histopathological changes in the hepatopancreas tissue of the Eriocheir sinensis when challenged with Vibrio parahaemolyticus as observed through H&E staining. (A) presents the H&E image of the hepatopancreas section from a healthy crab in the control group. (B–D) display H&E images of hepatopancreas sections from diseased crabs at 6, 24, and 72 hours post-infection, respectively (a, star-like structure; b, vacuole-like structure).
3.3 Tissue enzyme viability testTissue enzyme activity serves as a critical indicator of the innate immunity in experimental animals. In this study, we utilized an animal infection model to collect hepatopancreas tissue from E. sinensis and measured various enzyme activity indicators, including ALT, AST, ACP, LZM, SOD, T-AOC, AKP, and PO. The results are presented as follows: changes in enzyme activities at various time points during infection were observed through the hepatopancreatic immune factor assay (Figure 4). Compared to the control group, the levels of ACP and T-AOC were significantly lower (P < 0.05). However, there was a significant increase in the activity of SOD and lysozyme (LZM) within the initial 12 hours following infection (P < 0.05). Subsequently, LZM activity decreased and was significantly lower than that of the control group (P < 0.05). The results from the body fluid enzyme activity factor assay demonstrated significant activation of specific oxidative enzymes and lysozyme during the early phases of infection. Conversely, ALT and AST consistently exhibited significant activation throughout the entire infection cycle (P < 0.05).
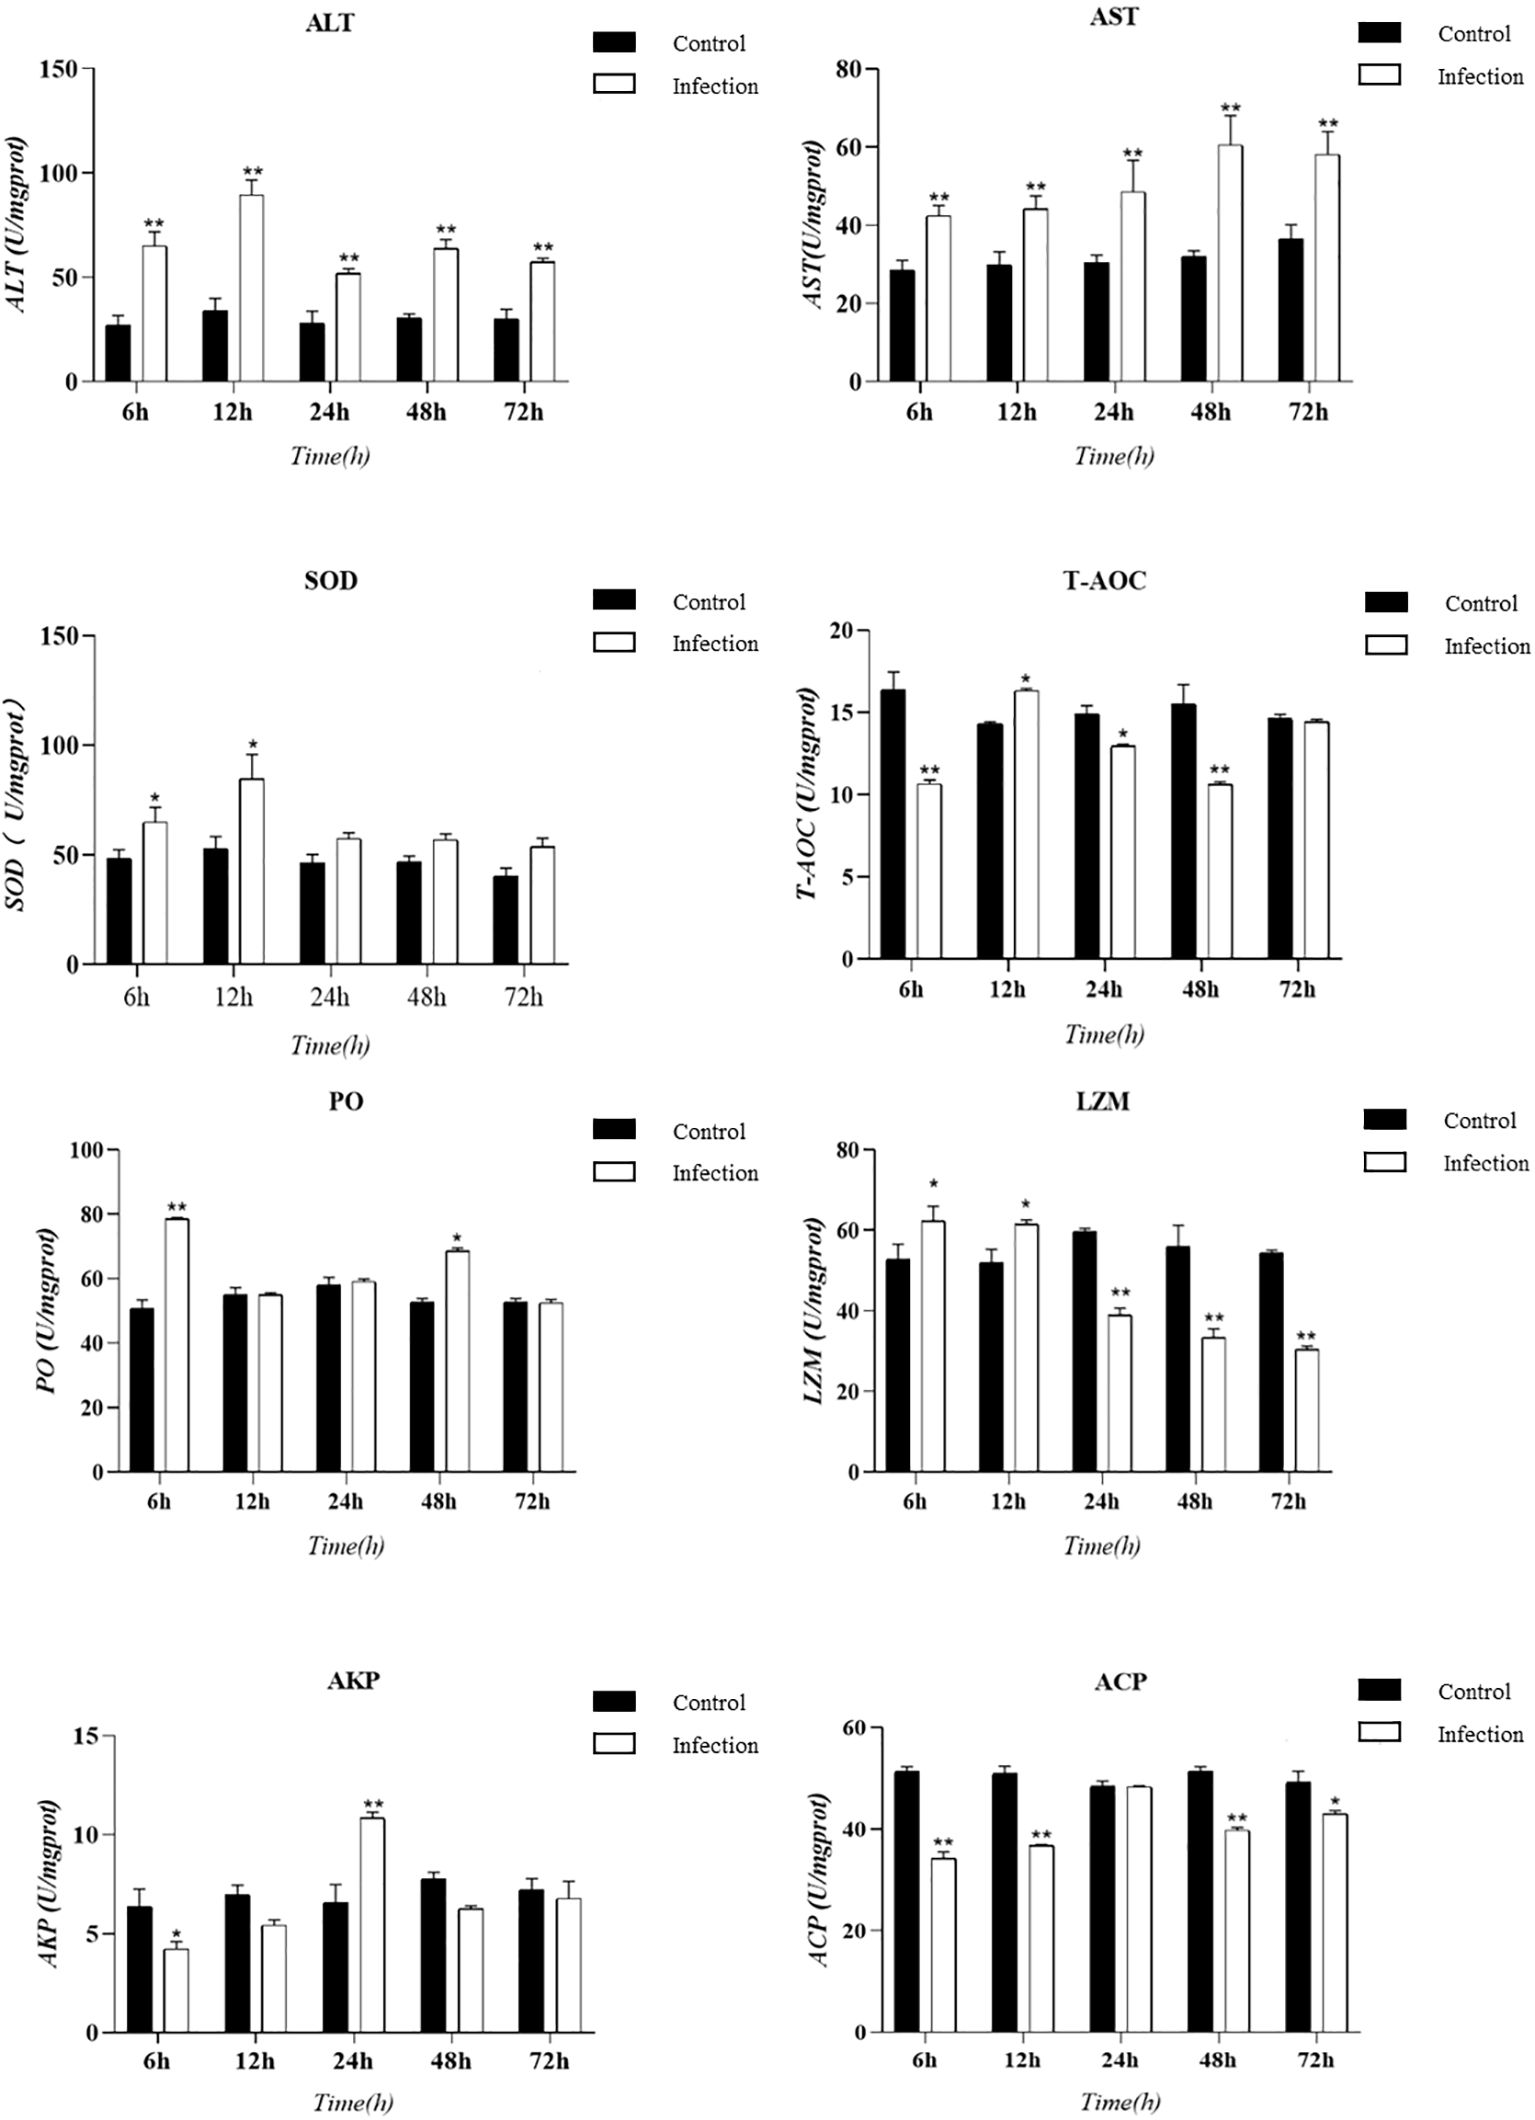
Figure 4. Presents a histogram illustrating the enzyme activity in the hepatopancreas tissue of Eriocheir sinensis at various time points following a challenge with Vibrio parahaemolyticus. The bar graph displays the mean ± standard error (SE) based on six experimental animals (n = 6). Asterisks denote significant differences between the samples (*P < 0.05; **P < 0.01).
3.4 Gene prediction and annotationDuring the process of E. sinensis resisting infection by Vibrio parahaemolyticus, the organism’s genes undergo differential transcription. Utilizing an animal infection model, we collected the hepatopancreas from experimental animals exhibiting various clinical symptoms during the infection. We analyzed the differential changes in its transcriptome through RNA-seq sequencing technology. The resulting data is presented as follows: A total of 205,181,269 raw data reads were obtained from the nine samples (Table 3). Specifically, 69,600,138 raw reads were from the control group (Es_CG), 68,521,173 from the susceptible group (Es_SC), and 67,059,958 from the disease-resistant group (Es_AI). After screening, 20,215,931 high-quality Clean Reads were obtained, accounting for 98.53% of the total data. For transcript splicing, 68,583,106, 67,510,983, and 66,060,842 Clean Reads were obtained from the control, susceptible, and resistant groups, respectively. The raw data exhibited Q20 > 96.51%, Q30 > 91.56%, and GC content > 50.13%. Using de novo assembly with Trinity, a total of 232,924 genes were predicted. The shortest unigene was 301 bp, the longest 30,836 bp, with an average length of 991 bp. The N50 and N90 values were 1464 and 412, respectively (Table 4). All sequencing raw data from this study have been deposited in the National Center for Biotechnology Information database under the accession number NCBI: PRJNA1130557.
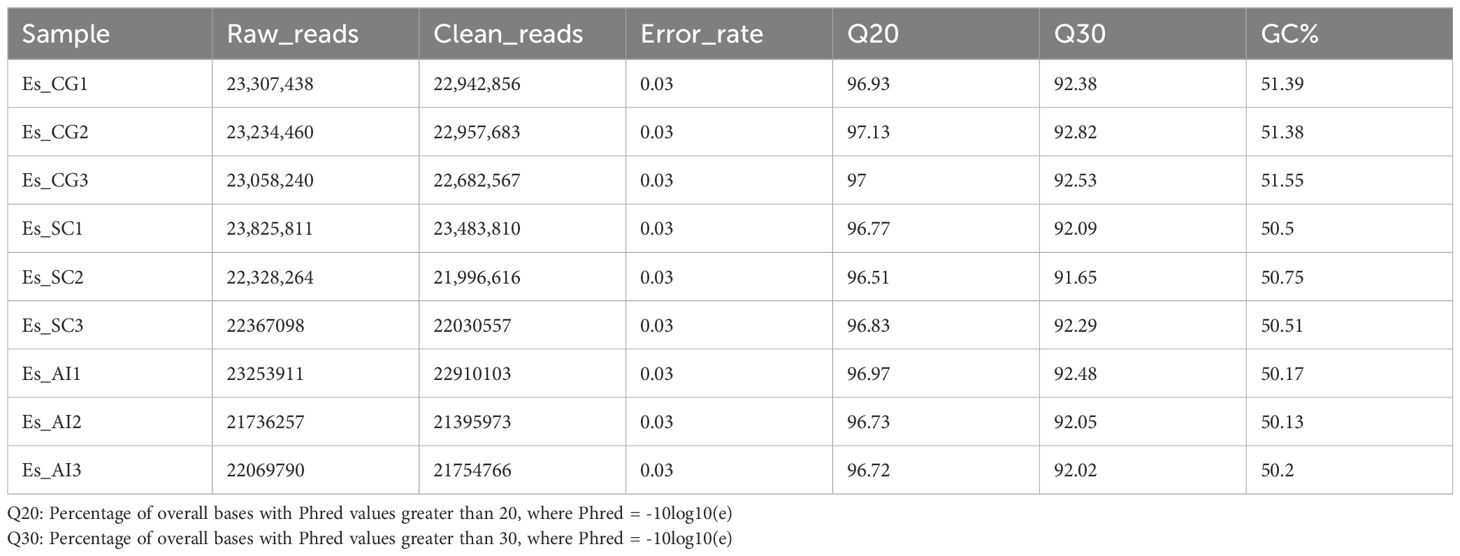
Table 3. Summary of sample sequencing data quality.

Table 4. Splice length distribution list.
3.5 Statistical analysis of differentially expressed genesWe utilized data analysis software based on the R programming language to conduct a statistical analysis of differentially transcribed genes across the three groups. For the differential expression of genes in E. sinensis infected with V. parahaemolyticus, we performed a statistical analysis. Initially, we calculated Pearson’s correlation coefficients using the FPKM values of all genes across the samples. The results, depicted in Figure 5, demonstrated strong correlations between the samples (R^2 close to 0.9), indicating the data’s suitability for further analysis. Comparing ES_SC and ESCG, we identified 11,662 genes with differential expression, out of which 6,266 genes were up-regulated and 5,396 genes were down-regulated (Figure 6A). Comparing ES_SC and ES_AI, A total of 13,515 genes exhibited differential expression, with 7,694 genes up-regulated and 5,821 genes down-regulated (Figure 6B). Likewise, comparing ES_AI and ES-CG, we found 7,631 genes with differential expression, including 3,111 genes that were up-regulated and 4,520 genes that were down-regulated (Figure 6C). To visualize the expression patterns of the differentially expressed genes, we generated a heatmap (Figure 6D). This heatmap clusters genes with similar expression patterns together. Each square’s color indicates the expression level of the corresponding gene: redder colors denote higher expression levels, while greener colors denote lower expression levels. These analyses provide insights into the transcriptional responses of E. sinensis to V. parahaemolyticus infection, highlighting significant gene expression changes associated with susceptibility and resistance.
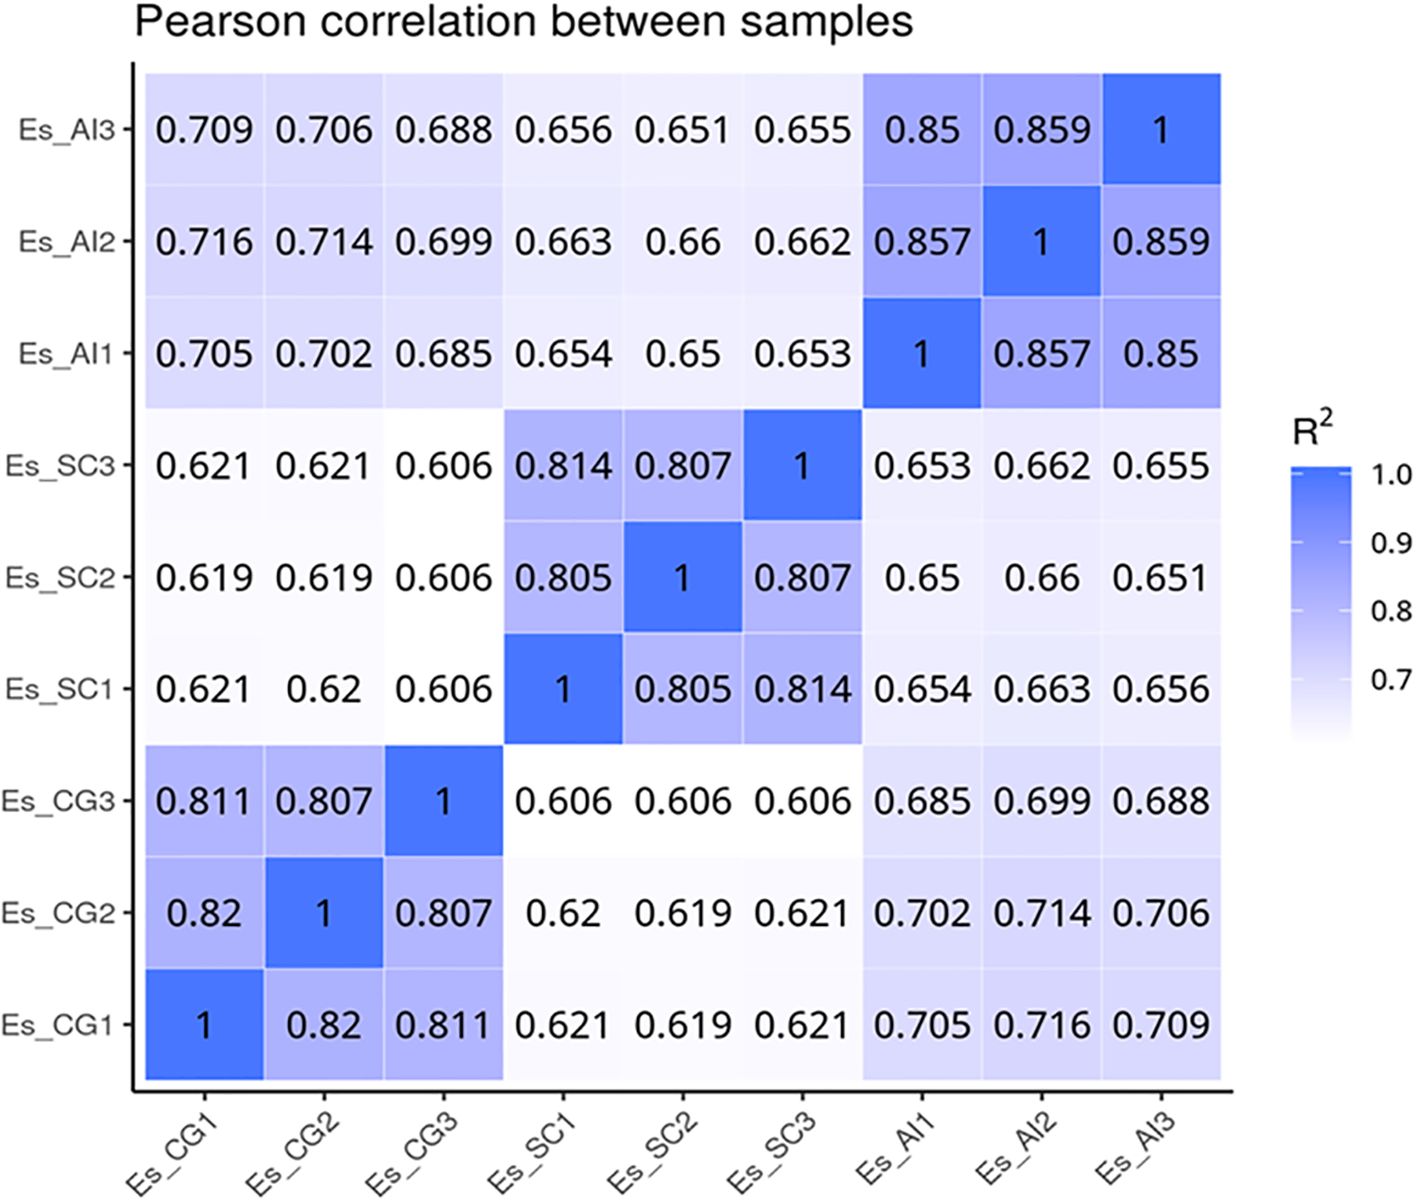
Figure 5. Heat map of correlation coefficients between samples. The x-axis represents the log10 (FPKM+1) of sample 1, while the y-axis represents the log10 (FPKM+1) of sample 2. R2 denotes the square of the Pearson correlation coefficient. The correlation of gene expression levels between samples serves as a crucial indicator for assessing the reliability of the experiment and the appropriateness of sample selection. A correlation coefficient closer to 1 signifies a higher similarity in expression patterns between samples. To evaluate this, calculate the intra-group and inter-group correlation coefficients based on the FPKM values of all genes within the samples. Subsequently, represent these correlations in a heat map, which visually illustrates the differences between groups and the replication of samples within each group.
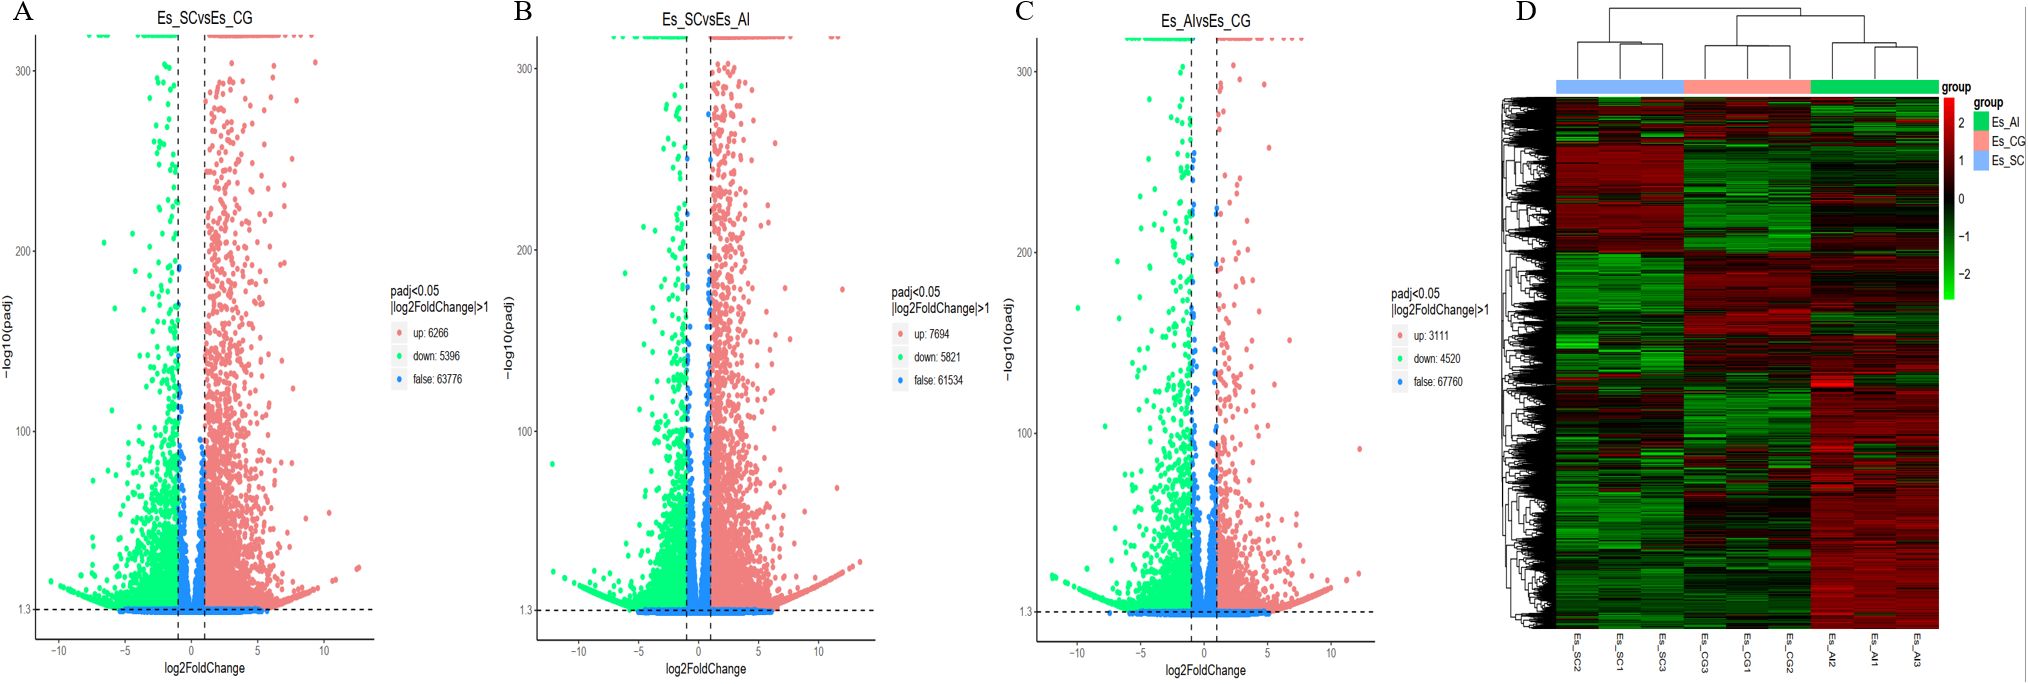
Figure 6. A volcano plot and heat map illustrating the differential gene enrichment of hepatopancreas tissue genes from experimental animals across various groups. (A) Comparison of differential gene volcano maps between Es_SC and ES_CG; (B) Comparison of differential gene volcano maps between Es_SC and ES_AL; (C) Comparison of differential gene volcano maps between Es_AL and ES_CG; (D) Heatmap displaying differential gene enrichment for all samples. The volcano plot visually represents the overall distribution of genes exhibiting significant expression differences. The abscissa denotes the fold change in gene expression across different samples (log2FoldChange), while the ordinate indicates the significance level of these expression differences (-log10padj). Up-regulated genes are depicted as red dots, whereas down-regulated genes are represented by green dots. Cluster analysis was conducted on differential gene sets to group genes exhibiting similar expression patterns. We employed hierarchical clustering, a widely used method, to analyze the FPKM values of the genes, normalizing the rows using Z-scores. In the resulting heat map, genes or samples with analogous expression patterns are clustered together. It is important to note that the color in each square does not represent the actual gene expression value; rather, it reflects the normalized values of the expression data, which typically range between -2 and 2.
3.6 Enrichment of differentially expressed genesThe differential transcription of genes significantly influences the life and metabolic processes of experimental animals. In this study, we enrich and analyze the differentially expressed genes sequenced by RNA-seq using Gene Ontology (GO) enrichment and the KEGG database to elucidate how various hosts resist the invasion of pathogenic microorganisms through their own biological processes. The GO enrichment analysis revealed significant findings in the comparison between ES_AI and ES-CG groups. In terms of biological processes, genes demonstrated enrichment primarily in metabolic processes (149 genes, with 63 up-regulated and 86 down-regulated) and transmembrane transport (305 genes, comprising 152 up-regulated and 153 down-regulated). Cellular component analysis highlighted enrichment in the extracellular matrix (19 genes, with 13 up-regulated and 6 down-regulated). Molecular function analysis indicated significant enrichment in oxidoreductase activity (257 genes, 122 up-regulated and 135 down-regulated). In KEGG pathway analysis, up-regulated genes were notably enriched in pathways such as ribosome (54 genes) and protein processing in the endoplasmic reticulum (38 genes), while down-regulated genes were primarily associated with starch and sucrose metabolism (27 and 24 genes, respectively). These results provide valuable insights into the functional roles of differentially expressed genes in E. sinensis during infection with V. parahaemolyticus, highlighting key processes and pathways affected by the bacterial infection.
The comparison between ES_SC and ES_AI demonstrated that the differential genes expressed in biological processes primarily exhibited enrichment in the metabolic process of cellular nitrogen compounds and the biosynthetic process as shown in Figures 7D–F. ES_SC had 972 down-regulated genes, while ES_AI had 794 down-regulated genes. Conversely, ES_SC showed 581 up-regulated genes compared to ES_AI’s 689 up-regulated genes. Furthermore, an enrichment of up-regulated genes was observed in the immune system process (20 genes), while 33 genes were down-regulated. Regarding cellular composition, genes showed significant enrichment in intracellular compartments and organelles. Specifically, ES_SC had 795 up-regulated genes compared to 619 in ES_AI. Conversely, ES_SC had 964 down-regulated genes, while ES_AI had 772 down-regulated genes. In terms of molecular functions, genes exhibited prominent enrichment in DNA binding and ion binding. The up-regulated genes were 311 in ES_SC and 433 in ES_AI, while the down-regulated genes were 456 in ES_SC and 433 in ES_AI. Additionally, the KEGG enrichment analysis revealed similar results, indicating that up-regulated genes mainly enriched the phagosome, pathways in cancer, and proteoglycans in cancer pathways, with 33, 37, and 33 enriched genes, respectively. On the other hand, down-regulated genes primarily enriched the cell cycle pathway and the ribosome pathway, with 44 and 64 enriched genes, respectively.
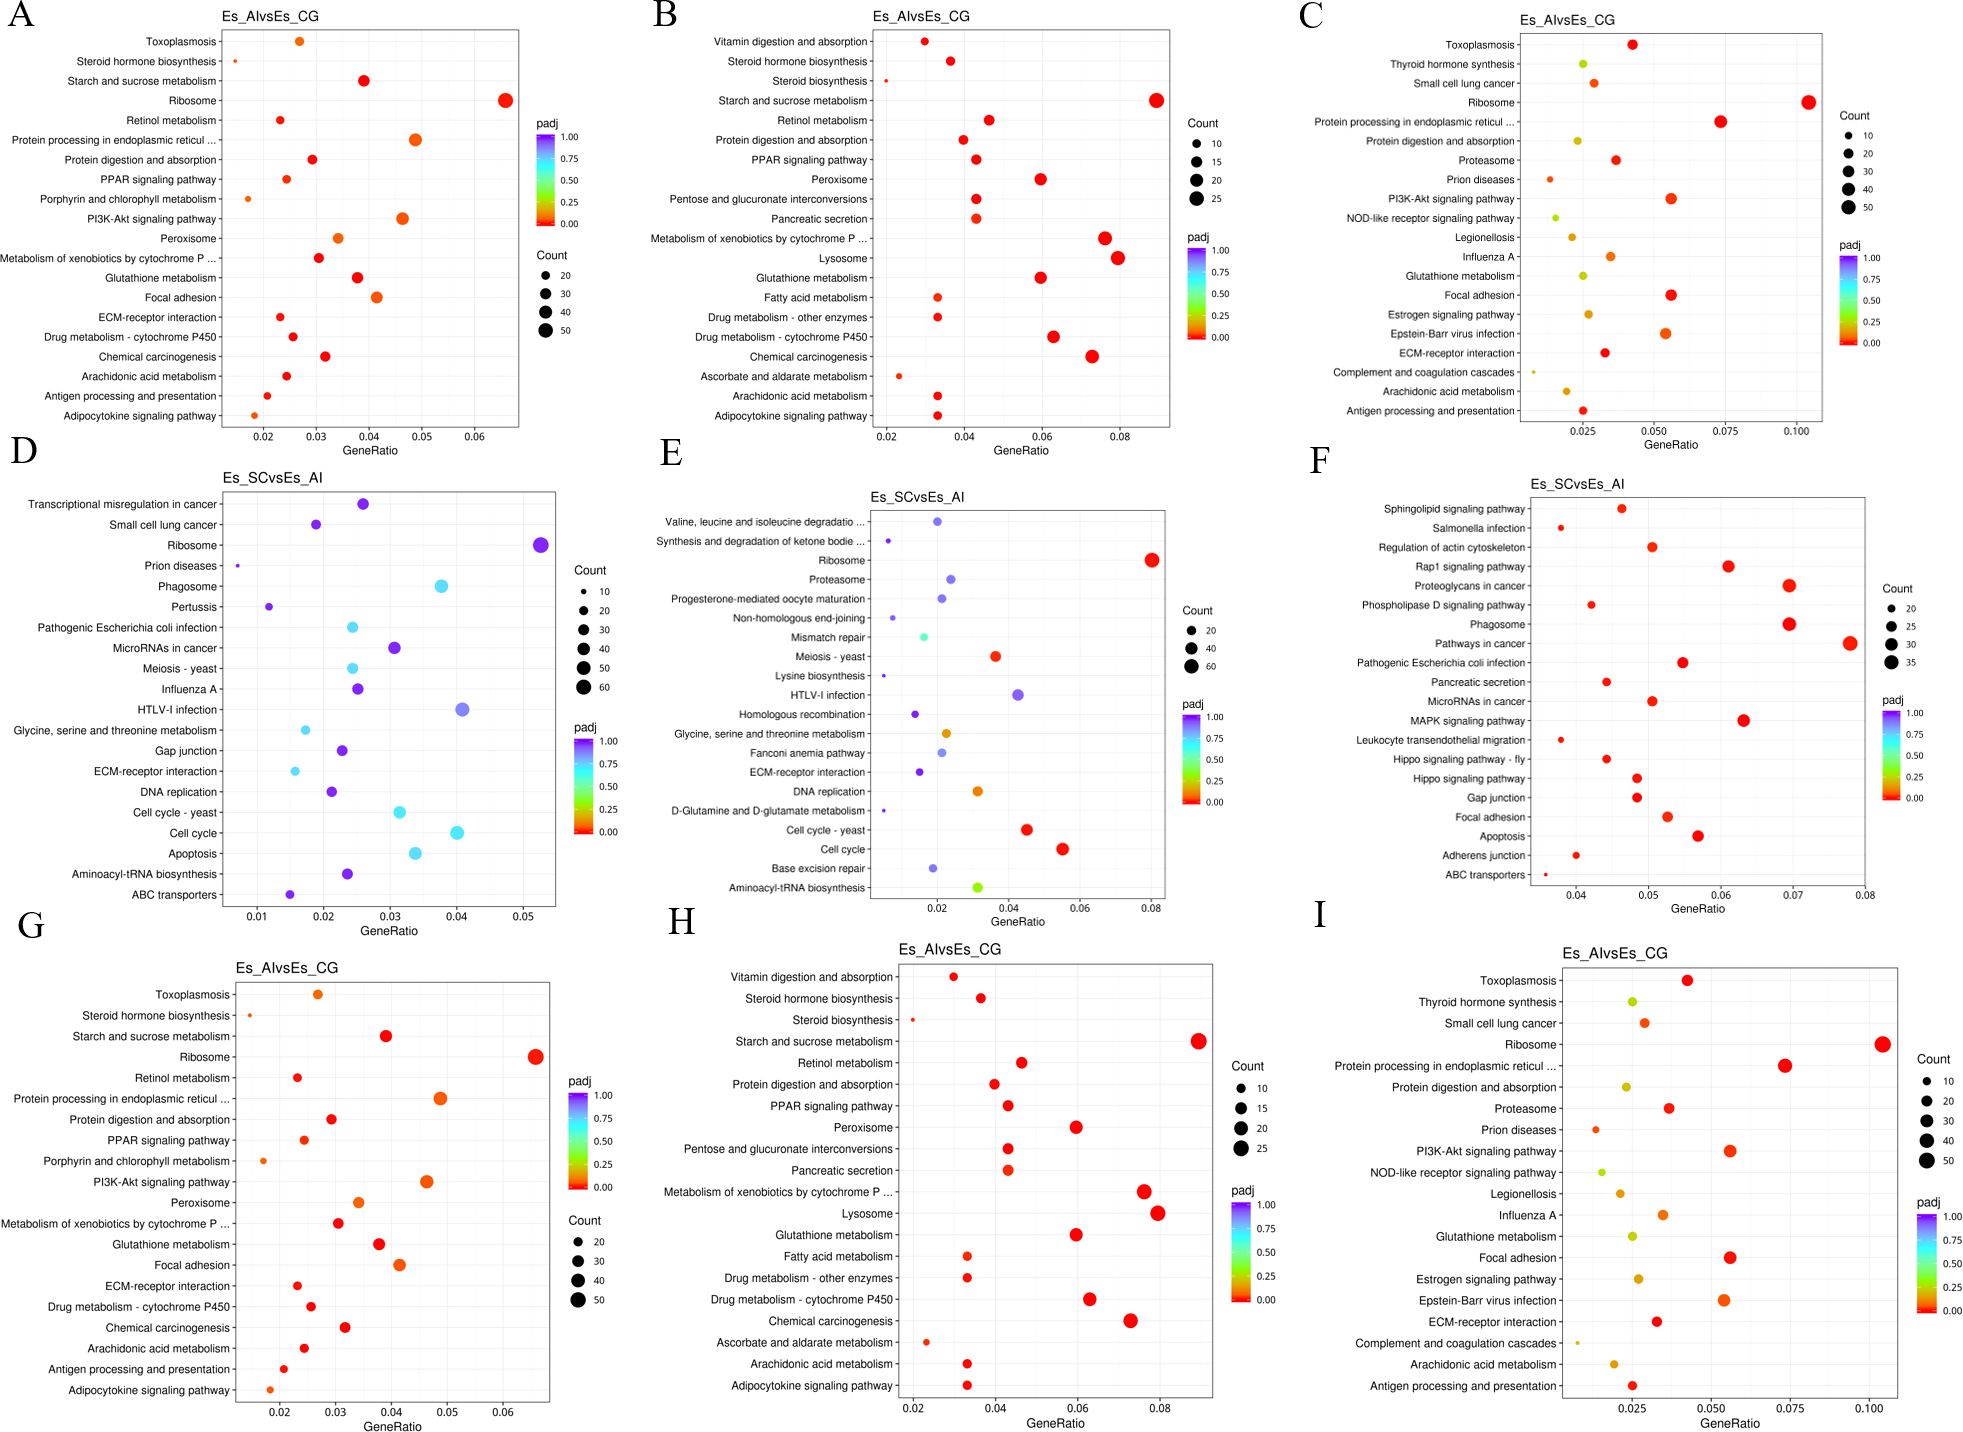
Figure 7. Scatterplot of KEGG pathway enrichment for different comparison combinations. Panels (A, D, G) present scatter plots illustrating all differential genes in the comparison of the two groups. Panels (B, E, H) display scatter plots for significantly down-regulated genes within the same comparison. Meanwhile, Panels (C, F, I) depict scatter plots for significantly up-regulated gene signaling pathways in the two groups. In the KEGG pathway enrichment scatter plot, the vertical axis lists the names of the pathways, while the horizontal axis represents the Rich factor associated with each pathway. The color of each point reflects the magnitude of the q-value, with smaller q-values indicated by colors closer to red. Furthermore, the size of the dots corresponds to the number of genes associated with each pathway.
When comparing ES_SC and ES-CG, the differential genes involved in biological processes are primarily enriched in the metabolic process of cellular nitrogen compounds and biosynthesis. There are 732 up-regulated genes and 611 down-regulated genes, along with 662 up-regulated genes and 556 down-regulated genes, respectively. Additionally, there are 22 up-regulated genes and 25 down-regulated genes enriched in the immune system process. In terms of cellular composition, genes are predominantly enriched in intracellular locations and organelles. Specifically, there are 838 up-regulated genes and 655 down-regulated genes enriched, while 648 up-regulated genes and 514 down-regulated genes are observed. Moving on to molecular functions, genes exhibit significant enrichment in DNA binding and ion binding. This enrichment involves 321 up-regulated genes and 507 down-regulated genes for DNA binding, and 302 up-regulated genes and 507 down-regulated genes for ion binding (as shown in Figures 7G–I). Regarding the KEGG enrichment analysis, up-regulated genes are primarily enriched in pathways related to cancer, including pathways in cancer itself and Proteoglycans in cancer. The number of enriched genes is 46 and 49, respectively. On the other hand, down-regulated genes show enrichment in pathways related to starch and sucrose metabolism, as well as the lysosome pathway, with 31 and 40 enriched genes, respectively.
The present investigation involved the screening of 691 genes from the immune-related functional classification provided by the KEGG database (Supplementary Figure S1). In relation to immunity, a total of 342 differentially expressed genes were discovered. These selected genes exhibited enrichment in diverse KEGG pathways, with a particular emphasis on 22 signaling pathways associated with immune response (Supplementary Figure S1). Amongst these pathways, notable considerations included platelet activation (37 genes), leukocyte transendothelial migration (29 genes), Fc gamma R-mediated phagocytosis (26 genes), chemokine signaling pathway (31 genes), toll-like receptor signaling pathway (20 genes), antigen processing and presentation (18 genes), T cell receptor signaling pathway (19 genes), NOD-like receptor signaling pathway (16 genes), B cell receptor signaling pathway (14 genes), Rap1 signaling pathway (38 genes), Fc epsilon RI signaling pathway (14 genes), TNF signaling pathway (16 genes), natural killer cell mediated cytotoxicity (12 genes), RIG-I-like receptor signaling pathway (11 genes), ErbB signaling pathway (15 genes), NF-kappa B signaling pathway (11 genes), Ras signaling pathway (28 genes), inflammatory mediator regulation of TRP channels (14 genes), GnRH signaling pathway (16 genes), cAMP signaling pathway (28 genes), PI3K-Akt signaling pathway (31 genes), and MAPK signaling pathway (27 genes). Several immune-related signaling pathways are graphically displayed in this study. The figure illustrates that infection with V. parahaemolyticus triggers the activation of specific genes within the KEGG signaling pathway in the samples analyzed. It is hypothesized that the activation of these genes plays a crucial role in initiating the respective KEGG signaling pathway (Figure 8).
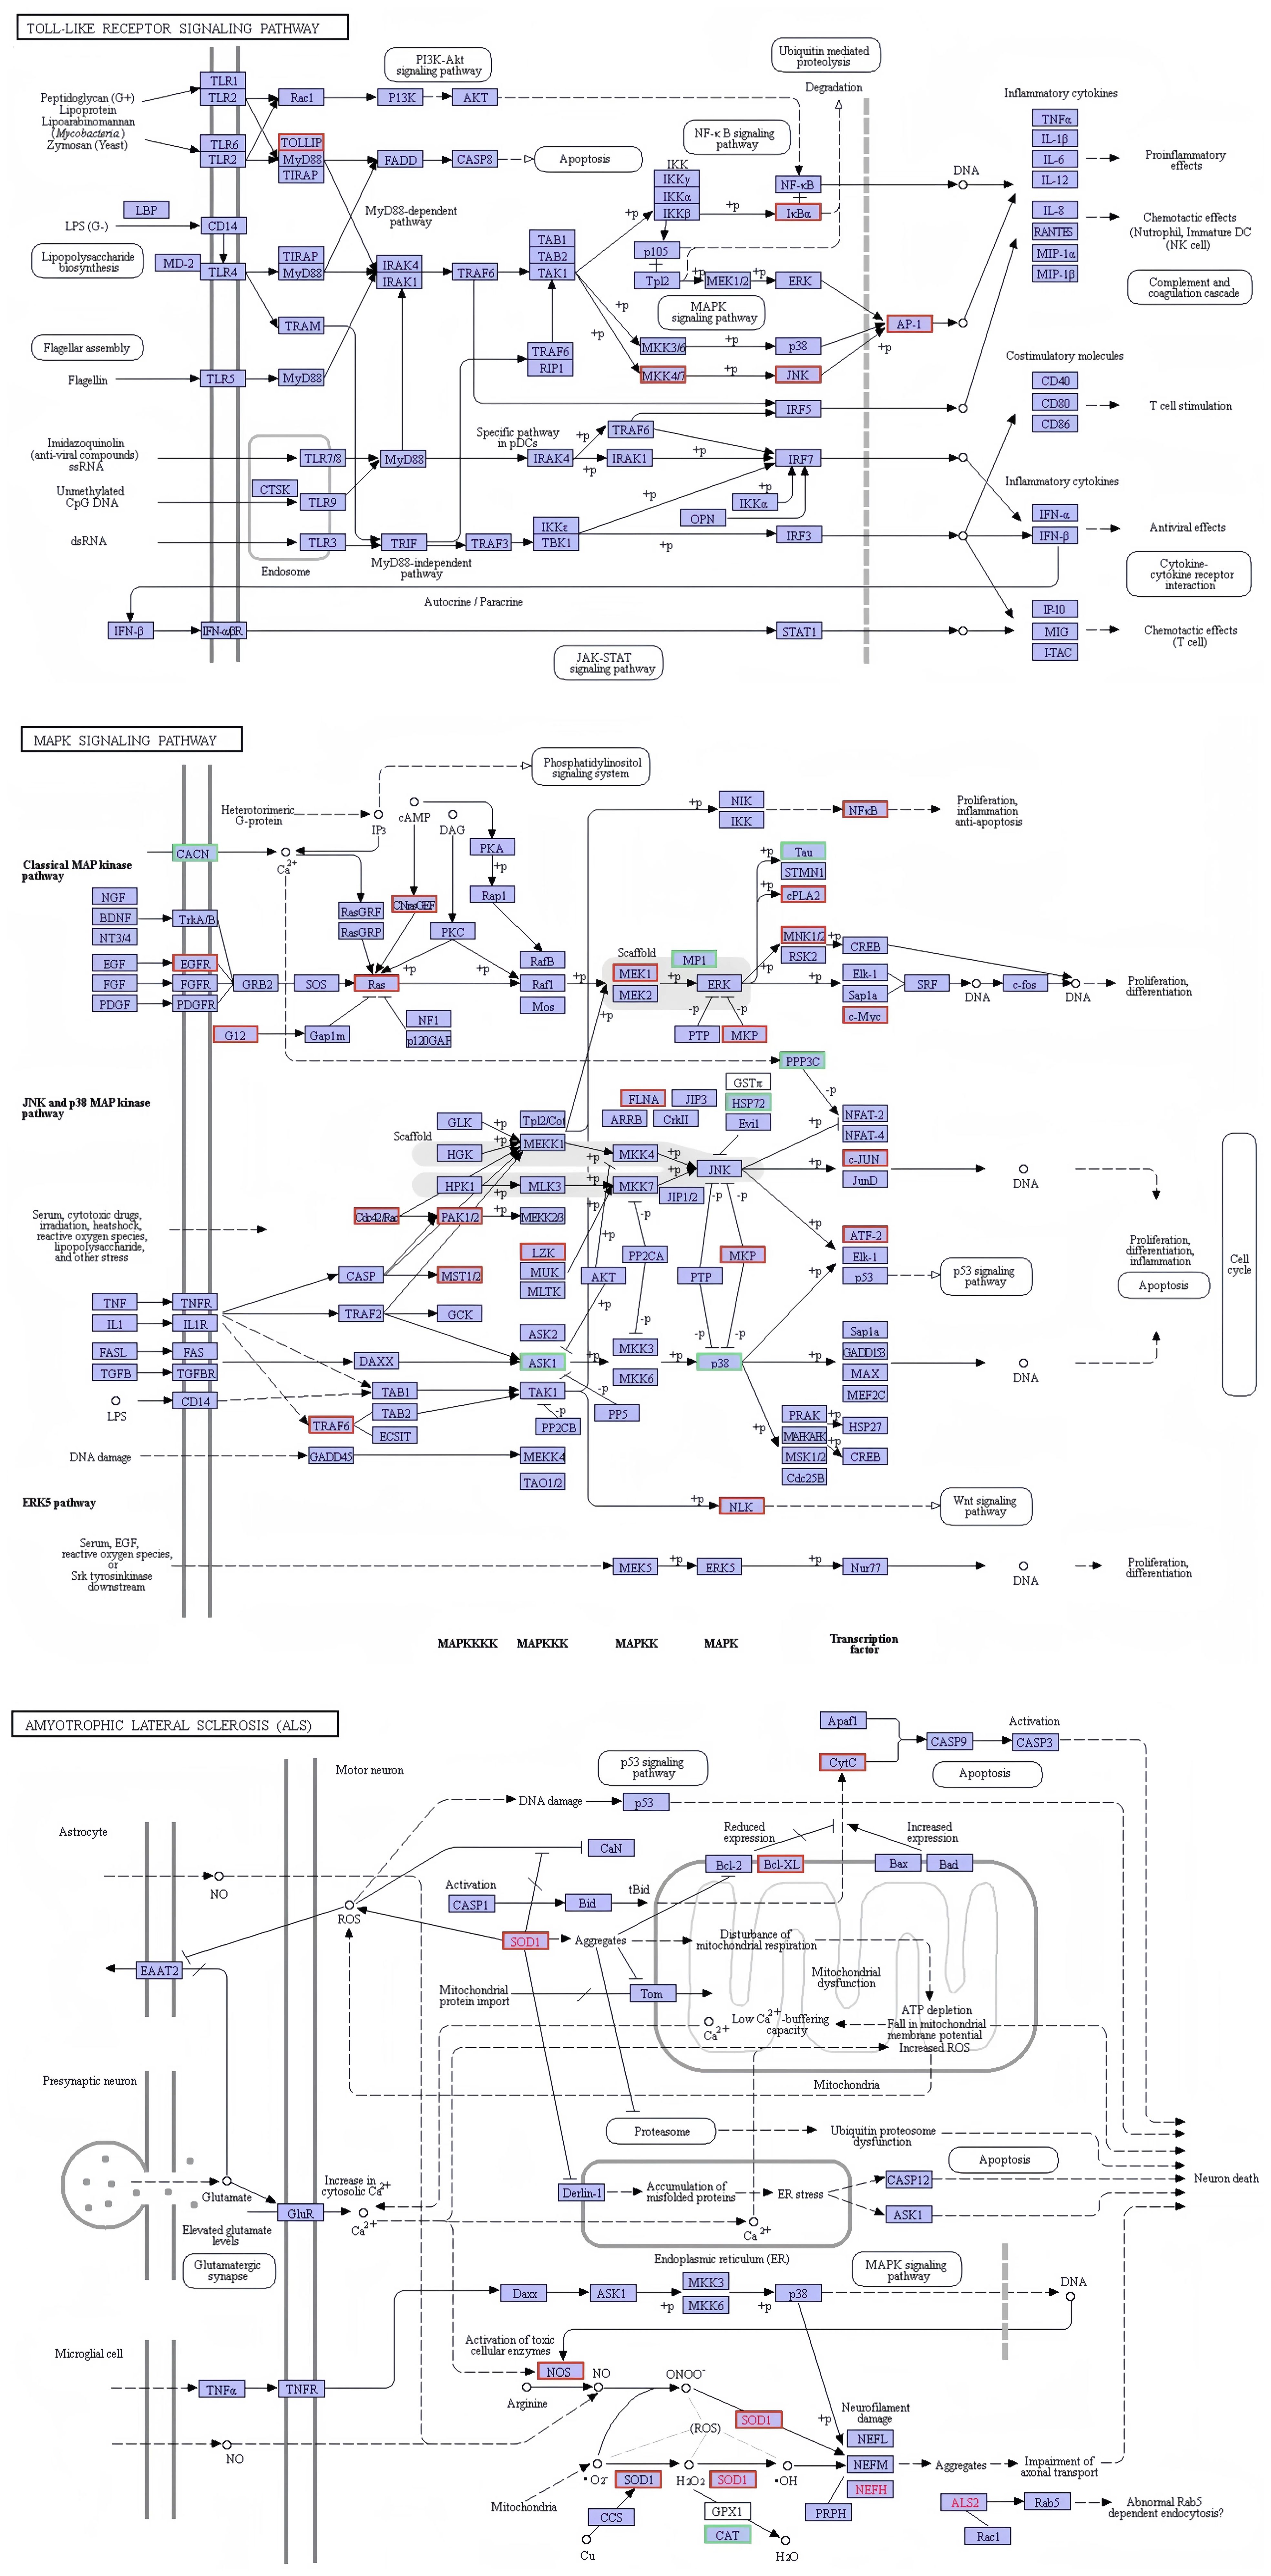
Figure 8. Network diagram of differential gene enrichment signaling pathways. The KEGG database was employed to analyze the localization of signaling pathways enriched in differentially expressed genes and to investigate potential regulatory mechanisms. The red color highlights significantly differentially expressed genes and their respective locations.
3.7 Transcriptome differential gene expression validationThe validation results depicted in Supplementary Figure S2 demonstrate concordance between RNA sequences and qRT-PCR findings, supporting the accuracy and precision of RNA-Seq in this investigation. Temporal changes in the expression levels of 5 genes were analyzed at different time points (6, 12, 24, 48, and 72 hours) post-infection using qRT-PCR (Figure 9). The results revealed a significant increase in the expression of lysozyme-related genes at 6 hours after acute V. parahaemolyticus infection. Moreover, the redox-related SOD showed a consistent augmentation throughout the course of the infection, with the highest level of transcription attained at the 12-hour time point. Furthermore, the infection by V. parahaemolyticus led to an up-regulation of the integrin gene in the hepatopancreas tissue. The expression level of the integrin gene experienced a considerably significant rise at 6 hours post-infection (P < 0.01), followed by a subsequent decline. However, at the 12-hour mark following infection, the integrin gene’s expression remained significantly up-regulated (P < 0.01). Between the 24 and 72-hour periods after infection, there was a significant up-regulation of the integrin gene in crab hepatopancreas tissue (P < 0.05), persisting at a sustained level below the normal range. Concurrently, the expression level of the hemocyanin HC gene in the hepatopancreas exhibited a notable rise (P < 0.01), followed by a subsequent increase. The expression of HC peaked at 12 hours post-infection (P < 0.01), after which it began to decline. Between 48 and 72 hours after infection, the HC gene expression returned to levels close to the baseline.

Figure 9. Graph illustrating gene expression trends derived from validated RNA sequencing (RNA-seq) analyses utilizing fluorescence quantification methods. The bar graph displays the mean ± standard error (SE) based on six experimental animals (n = 6). Asterisks denote significant differences between the samples (*P < 0.05; **P < 0.01).
4 DiscussionV. parahaemolyticus is a highly pathogenic bacterium known for causing significant mortality and economic losses in cultured E. sinensis (Liu et al., 2020; Powers et al., 2021). This study focused on V. parahaemolyticus-infected E. sinensis and involved constructing a transcriptome sequencing library from immune-related tissues in the hepatopancreas. This approach enabled the acquisition of gene sequences and functional information, substantially enriching the transcriptional expression and genetic information database of the crab. The expanded database will facilitate more comprehensive and systematic analyses of various aspects of crab biology, thereby aiding in management and disease control efforts. Additionally, we confirmed that the strains used in our study carry virulence genes such as Gyr, Tna, Pyr, Rec, Lux, and priA/B. Furthermore, these strains showed sensitivity to antibiotics including propoxur, norfloxacin, tetracycline, and piperacillin. Infection of laboratory animals with V. parahaemolyticus induced disturbances in genetic material and energy metabolism in the hepatopancreas of the Chinese mitten crab.
The results of our study indicate that this particular strain of V. parahaemolyticus causes acute hepatopancreatic necrosis symptoms in E. sinensis. These symptoms resemble those observed in Chinese mitten crabs suffering from acute hepatopancreatic necrosis syndrome (AHPNS), a chronic disease affecting the hepatopancreas and energy consumption (Huang et al., 2021). Based on this similarity, we hypothesized that V. parahaemolyticus infection in Chinese mitten crabs could lead to increased depletion of hepatopancreatic energy, ultimately resulting in hepatopancreatic failure and necrosis as a pathological symptom. With prolonged infection duration, we observed significant changes in the color of the hepatopancreas in affected crabs, progressing from dark yellow to white. Additionally, the tissue structure exhibited severe necrosis. Pathological tests revealed deformations in the stellate lumen structure of hepatic tubules in the hepatopancreas of infected crabs, alongside the appearance of vacuoles in hepatocytes, followed by gradual lysis. The hepatopancreas serves as a multifunctional organ integrating metabolic and immune functions, making it the primary target tissue for V. parahaemolyticus AHPND infection in crustaceans (Zhang et al., 2023; Miao et al., 2024). V. parahaemolyticus infection directly caused acute hepatopancreatic injury, suggesting it could contribute to acute hepatopancreatic necrosis in Chinese mitten crabs.
As typical hydrolases in the innate immune system of crustaceans, alkaline phosphatase (ACP), acid phosphatase (AKP), and lysozyme (LZM) primarily function to directly eliminate extracellular invaders. Therefore, they are considered sensitive biomarkers in the context of environmental stress and microbial infections (Hong et al., 2020). Our study observed an increase in the activity of these enzymes during the early stage of infection, followed by inhibition in the late stage. Based on the analysis of enzyme activity measurement results and pathological sections, we speculate that damage to the hepatopancreas tissue may be one of the reasons for the contribute to the observed decrease in enzyme activity. Further experimentation involving pollutant exposure demonstrated a correlation between decreased enzyme activity in fish and reduced
留言 (0)