The human voltage-gated proton channel (HV1) is built up by four transmembrane helical segments that act as a voltage-sensor domain and a physiologically outwardly directed proton-conductive pathway in the cell membrane. HV1 is regulated by the membrane potential and pH, activating at depolarizing voltages and during cytosolic acidification (1, 2). While other voltage-gated channels are composed of four voltage-sensor domains controlling one central permeation pore domain, HV1 has a unique dimer structure lacking a conventional pore with each subunit having its own proton permeation pathway localized in the voltage-sensor domain and one gate controlled by one voltage sensor (3). HV1 is expressed in a wide variety of human cell types in which the channel is mainly involved in two major cellular functions. First, a HV1-mediated proton extrusion from the cytoplasm provides a charge compensation for the transmembrane electron transfer occurring due to the activity of the NADPH oxidase and is thus required for a sustained production of reactive oxygen species (ROS). This counterbalancing activity has been linked to the respiratory burst and bacterial clearance of neutrophil granulocytes (4–6), antibody production of B lymphocytes (7), transport-mediated CO2 disposal in the heart (8), immunosuppressive activity of myeloid-derived suppressor cells (9) and various effector functions of T lymphocytes (10). While such regulation is essential for these physiological functions, a HV1-enabled ROS overproduction can also contribute to activation and proinflammatory cytokine production of microglia in neuroinflammation (11). Second, the proton efflux mediated by HV1 efficiently modulates intracellular pH for appropriate sperm activation, motility and capacitation (6, 12, 13) or migration and mineral matrix production of chorion-derived mesenchymal stem cells (14). However, HV1 can also relieve extensive metabolic acidosis that frequently arises during the rapid proliferation of tumor cells and, therefore, its overexpression frequently observed in malignant neoplasms facilitates tumor growth (9).
Although various peptide and small-molecule compounds have been described thus far to inhibit the conductive function of HV1 (6, 15–19), guanidine-containing compounds, particularly 5-chloro-2-guanidinobenzimidazole (ClGBI), are still the most widely applied for this purpose (8, 9, 13, 14, 20–25). Due to the mitigation of ROS overproduction, an inhibition of HV1 was proposed to show great promise in acute lung injury (26), ischemic stroke (27, 28), multiple sclerosis (29, 30), brain and spinal cord injury (31–33), and peripheral neuropathic and inflammatory pain (18, 34). Furthermore, by eliminating the protection from proliferation-associated metabolic acidosis, a HV1 block was proposed to favorably reduce the growth rate of various malignant tumors such as breast cancer (25, 35, 36), colorectal carcinoma (37), glioblastoma multiforme (38) or leukemia (15, 39). The pH dysregulation associated with blocking HV1 conductivity can lead to cell death by triggering apoptotic processes, which may thus contribute to both the intended and adverse effects of the compounds. Consistently, a pharmacological HV1 inhibition was previously shown to compromise the viability of various cell types including Jurkat T lymphocytes (20), chorion-derived mesenchymal stem cells (14), activated mouse microglia (23), myeloid-derived suppressor cells (9), breast cancer (25) and glioblastoma multiforme cell lines (38).
Macrophages, essential cellular components of the innate immune system, are plastic and heterogeneous cells whose differentiation and activation are distinctively elicited by a large variety of stimuli. In general, macrophages are classified into M1, or classically activated, and M2, or alternatively activated subsets. M1 macrophages activated by Th1 cytokines, such as interferon-γ, and Toll-like receptor ligands, e.g., bacterial lipopolysaccharide (LPS), produce proinflammatory cytokines and mediators, and participate in defense mechanisms against pathogens and tumors, while M2 macrophages induced by Th2 or anti-inflammatory cytokines, such as interleukin-4 (IL-4), interleukin-13 (IL-13) or interleukin-10 (IL-10), are rather involved in the resolution of inflammation, scavenging apoptotic cells and debris, tissue remodeling and immune regulation (40, 41). Although this dichotomous classification is convenient, it is largely oversimplified since M2 macrophages can be further divided into distinct functional subpopulations. Therefore, M1 and M2 phenotypes rather represent extremes of a continuum of functional states, and these phenotypes are dynamically interconvertible through reprogramming depending on microenvironmental signals (42–44). Nevertheless, the M1-M2 classification is still an operationally useful framework for didactic reasons and because dysregulated macrophage polarization is often associated with the occurrence and progression of various diseases. An imbalance in macrophage polarization with proinflammatory M1 dominance was linked to a consequently enhanced inflammation in atherosclerosis, obesity and metabolic disorder, and autoimmune diseases such as Crohn’s disease, rheumatoid arthritis, multiple sclerosis or autoimmune hepatitis. On the contrary, an M2 preponderance can contribute to allergic airway inflammation and asthma, and a shift from tumor-infiltrating M1 macrophages to a predominantly M2-like tumor-associated macrophage phenotype is associated with immune evasion of malignant tumors. Hence, altering the balance of macrophage polarization is considered as a potential therapeutic target in these disorders and, therefore, understanding the factors regulating polarization and the role of certain proteins in differentially activated macrophages carries substantial biomedical relevance (43, 45). HV1 expression was previously described in murine and human, including THP-1-derived macrophages as well (46, 47). In these cells, the proton efflux mediated by HV1 was subsequently shown to play important roles in the sustained ROS production (48), proper phagosomal acidification and pH oscillations (49, 50), and protection from intracellular fungal pathogens (51). However, the potential effects of blocking the HV1 channel on the viability of polarized macrophages have not been thoroughly tested yet in spite of the fact that a reduced viability and plausible changes in homeostatic M1-M2 balance could largely alter both macrophage-related physiological and pathophysiological processes.
As mentioned above, intracellular pH dysregulation caused by HV1 inhibition is often associated with triggering cell death processes (9, 20, 23, 25, 38). However, the molecular details of this connection have not been elucidated yet. Membrane ceramides comprise a special class of sphingolipids, which are characterized by unique membrane biophysical properties due to their extreme hydrophobicity and compactness resulting from a very small hydrophilic headgroup (52–54). While ceramides are generally present normally at minuscule levels in the cell membrane, various stress stimuli including tumor necrosis factor α (TNFα), ionizing radiation and chemotherapeutic drugs result in their accumulation, which in turn activates different forms of cell death such as necrosis or apoptosis. Accordingly, the level of membrane ceramides is strictly regulated by a highly complex interconnected network of enzymes involved in their production and degradation. Ceramides typically accumulate through de novo synthesis, which mainly depends on the activity of the rate-limiting enzyme, serine palmitoyltransferase, or degradation of the ubiquitous sphingomyelin by neutral or acidic sphingomyelinase (55–57). Given that activities of these enzymes strongly depend on pH (58–60), it is tempting to speculate that complex pH alterations associated with HV1 inhibition may lead to cell death through ceramide overproduction.
In this study, we show that ClGBI, the most widely applied inhibitor of HV1, dose-dependently reduces the viability of human THP-1-derived polarized macrophages at biologically relevant doses and the sensitivity of the distinctly polarized macrophages differ with M1 cells being the most prone, and M2 macrophages the least sensitive to the compound. Through obtaining similar results with Zn2+, another HV1 blocker, and demonstrating the lack of notable effects of blockers of other ion channels that are relevant in macrophages and possible subjects of off-target ClGBI inhibition, we also provide experimental evidence for this ClGBI-induced effect indeed being mediated predominantly through HV1 inhibition. In addition, we show that the compromised viability occurs due to a complex pH dysregulation involving both the cytoplasmic and lysosomal compartments, and it is accompanied by elevations in membrane ceramide levels. Furthermore, supporting the intrinsic role of ceramide in the HV1 block-induced compromised viability of macrophages, we demonstrate that the effects of ClGBI can be alleviated by ARC39, a compound that selectively inhibits acid sphingomyelinase-mediated ceramide production.
2 Materials and methods2.1 Cell culture, differentiation and polarization of macrophagesThe human acute monocytic leukemia-derived cell line THP-1 was obtained from the American Type Culture Collection (Manassas, VA) and cultivated according to its specifications. THP-1 cells were differentiated into macrophages for 24 h by phorbol 12-myristate 13-acetate (PMA; Sigma-Aldrich, St. Louis, MO) at a final concentration of 10 ng/ml to achieve sufficient differentiation and minimize unspecific gene expression changes (61, 62), which was followed by a resting period of 24 h in the absence of PMA to ensure the M0 phenotype of the produced macrophages (61, 63). The differentiated M0 macrophages were subsequently polarized for 24-48 h into classical M1 macrophages with 100 ng/ml lipopolysaccharide (LPS; E. coli O111:B4 ultrapure, Sigma-Aldrich) plus 20 ng/ml interferon-γ (IFN-γ; Thermo Fisher Scientific, Waltham, MA), or M2 macrophages using 20 ng/ml interleukin-4 (IL-4; Thermo Fisher Scientific) plus 20 ng/ml interleukin-13 (IL-13; Thermo Fisher Scientific), according to a widely applied protocol (64–67). All treatments were carried out at 37°C.
2.2 Analysis of plasma membrane expression of CD markers in polarized macrophagesDifferentiated and polarized THP-1-derived macrophages grown in 6-well plates were washed and treated with accutase (Sigma-Aldrich) at room temperature for 5 min to gently detach adherent cells without compromising cell viability (68). After stopping the reaction with cell culture medium and washing, Fc receptors of cells were blocked for 20 min with human FcR blocking reagent (Miltenyi Biotec, Bergisch Gladbach, Germany) applied at 10 µg/ml. Subsequently, cells were labeled with one of the following antibodies: FITC-conjugated anti-CD64 (at a concentration of 4 µg/ml), Alexa Fluor 647-conjugated anti-CD71 (4 µg/ml), FITC-conjugated anti-CD80 (4 µg/ml), PE-Cy5-conjugated CD86 (1 µg/ml), PE-conjugated CD206 (0.5 µg/ml). All antibodies were obtained from Thermo Fisher and applied for 20 min at room temperature. After washing, the fluorescence intensity of individual cells was measured using a NovoCyte 3000RYB flow cytometer (ACEA Biosciences, San Diego, CA) with the following excitation wavelengths and emission filters, respectively: FITC – 488 nm and 530/30 nm; Alexa Fluor 647 – 640 nm and 660/20 nm; PE-Cy5 – 561 nm and 660/20 nm; PE – 561 nm and 586/20 nm. During data analysis carried out in FCS Express (De Novo Software, Los Angeles, CA), the average fluorescence intensity of at least 10,000 cells of normal morphology on FSC-SSC dot plots was calculated for each sample. The low extent of nonspecific binding of antibodies was supported by data obtained with isotope control antibodies FITC-conjugated Mouse IgG1 kappa Isotype Control, PE-Cy5-conjugated Mouse IgG1 kappa Isotype Control, PE-conjugated Mouse IgG1 kappa Isotype Control and Alexa Fluor 647-conjugated Mouse IgG2b kappa Isotype Control (all from Thermo Fisher) applied at identical experimental conditions (Supplementary Figure 1).
2.3 Examination of effects of ion channel inhibitors on the viability of polarized macrophagesTHP-1 cells seeded into 24-well plates were differentiated into macrophages and polarized as above, and treated subsequently for 24 h with ion channel inhibitors supplemented into the culture media of cells. In the case of ClGBI (5-chloro-2-guanidinobenzimidazole; Sigma-Aldrich), a dilution series with concentrations ranging between 16 and 256 µM was used, while in other experiments cells were treated with 20 pM Vm24 scorpion toxin (Alomone Labs, Jerusalem, Israel), 20 nM TTX (tetrodotoxin; Alomone Labs), 1 mM TEA+ (tetraethylammonium; Sigma-Aldrich), or 1 mM (nominal) ZnCl2 (Sigma-Aldrich). For the investigation of potential protective effects of pretreatments with ceramide production inhibitors against ClGBI-induced toxicity, 1 µM myriocin (Sigma-Aldrich), 2 µM GW4869 (Sigma-Aldrich) or 5 µM ARC39 (Cayman Chemical, Ann Arbor, MI) was given to polarized M0, M1 and M2 macrophages 30 min before the application of ClGBI. For the determination of the fraction of viable cells calculated as viable fraction = number of double negative cells/number of all cells, as described previously (53, 69, 70), we collected the supernatant containing cells detached from the surface of the well, and pooled them with the adherent cells, which were detached by accutase. This cell suspension was labeled with Sytox Green Dead Cell Stain (Thermo Fisher Scientific) and Alexa Fluor 647-conjugated annexin V (Thermo Fisher Scientific) at dilutions of 1:1000 and 1:20, respectively, in annexin binding buffer for 15 minutes at room temperature. Fluorescence intensities of at least 10,000 individual cells per sample were subsequently measured using a NovoCyte 3000RYB flow cytometer. Sytox Green and Alexa Fluor 647 fluorophores were excited at 488 and 640 nm, respectively, and emitted intensities were measured using 530/30 and 660/20 emission filters, respectively. During data analysis, the fraction of Sytox Green and annexin V negative viable cells was calculated for each sample using FCS Express.
2.4 Determination of HV1 expression in polarized macrophagesDifferentiated and polarized THP-1-derived macrophages grown in 12-well plates were washed and detached with accutase, which was followed by fixation in ice-cold methanol (Sigma-Aldrich) for 20 minutes. After permeabilization in 0.1% Triton X-100 (Sigma-Aldrich), cells were blocked with human FcR blocking reagent and 5% BSA for 30 minutes at room temperature. Subsequently, cells were labeled with anti-HV1 antibodies (PA5-24964, Thermo Fisher Scientific) for 60 minutes at room temperature at 5 µg/ml and, after washing, with Alexa Fluor 647-conjugated goat anti-rabbit IgG antibodies (Thermo Fisher Scientific) for 30 minutes at room temperature at a dilution of 1:500 (25). All steps were carried out in a solution containing 1% BSA and 0.1% Triton X-100. The fluorescence intensity of individual cells was measured with NovoCyte 3000RYB using excitation at 640 nm and a 660/20 emission band pass filter and average fluorescence intensities of at least 10,000 cells with a normal morphology gated on FSC-SSC plots were calculated in each sample in FCS Express. The low extent of nonspecific binding of the primary antibody was supported by data obtained with the isotope control antibody Rabbit IgG Isotype Control (Thermo Fisher) applied at identical experimental conditions (Supplementary Figure 2).
2.5 Investigation of time-dependent effects of ClGBI on the cytoplasmic pH of polarized macrophagesTHP-1 cells seeded into 24-well plates were differentiated into macrophages and polarized as above, and treated subsequently for 1, 4 or 18 h with 50 or 100 µM ClGBI supplemented into the culture media of cells. In the last 30 min of incubation at 37°C, 5 µM pHrodo Red AM Intracellular pH Indicator (Thermo Fisher) was further added to cells (71). After washing and detachment of cells with accutase, the fluorescence intensity of individual cells was measured with NovoCyte 3000RYB using excitation at 561 nm and a 586/20 emission band pass filter and average fluorescence intensities of at least 10,000 cells with a normal morphology gated on FSC-SSC plots were calculated in each sample in FCS Express. For calibration samples, cells were further incubated for 5 min at 37°C in the presence of 10 µM valinomycin and 10 µM nigericin dissolved into cellular calibration pH buffers according to the instruction of the manufacturer, which was followed by measurement as above. Corresponding pH values were interpolated from the calibration curve.
2.6 Examination of time-dependent effects of ClGBI on the lysosomal pH of polarized macrophagesTHP-1 cells seeded into 8-well chambered coverglass were differentiated into macrophages and polarized as above, and treated subsequently for 1, 4 or 18 h with 50 or 100 µM ClGBI supplemented into the culture media of cells. 3 hours before the measurement time, 70,000 MW, anionic dextrane conjugated to pH-sensitive fluorescein and pH-insensitive tetramethylrhodamine (TAMRA) (Thermo Fisher) was added to cells for 1 h at 37°C, which was followed by washing and a chase of 2 h at 37°C to ensure the exclusive lysosomal accumulation of the indicator (72). Live cell imaging was carried out in medium buffered with 20 mM HEPES, pH 7.4, and images were taken at the midplane of cells using an LSM880 confocal laser-scanning microscope (Carl Zeiss AG, Jena, Germany). Fluorescein and TAMRA were excited at 488 nm and 543 nm, respectively, and their emission was detected in the wavelength ranges of 493-559 nm and 559-685 nm, respectively. During image analysis in Matlab (Mathworks, Natick, MA), after manual selection of pixels corresponding to an individual cell based on the transmission image, a threshold value of the TAMRA fluorescence intensity was determined and pixels having larger TAMRA intensity than the threshold were identified as lysosomal pixels. Subsequently, the average fluorescein/TAMRA fluorescence intensity ratio positively correlating with the value of lysosomal pH was calculated for each cell using data of lysosomal pixels exclusively. For calibration samples, cells were incubated for 15 min at 37°C in the presence of 10 µM valinomycin, 10 µM nigericin and 0.1 µM bafilomycin dissolved into cellular calibration pH buffers according to the instruction of the manufacturer, which was followed by measurement as above. Corresponding pH values for each ratio were interpolated from the calibration curve.
2.7 Analysis of time-dependent effects of ClGBI on the plasma membrane ceramide levels of polarized macrophagesTHP-1 cells seeded into 24-well plates were differentiated into macrophages and polarized as above, and treated subsequently for 1, 4 or 18 h with 50 or 100 µM ClGBI supplemented into the culture media of cells. After washing, detachment with accutase and FcR blocking as above, treated and control M0, M1 and M2 cells were labeled with anti-ceramide antibodies clone 15B4 (Sigma-Aldrich) at 4 µg/ml for 60 min at room temperature, which was followed by washing and a 20-min staining with Alexa Fluor 647-conjugated goat anti-mouse IgM antibody (Thermo Fisher Scientific) at 4 µg/ml at room temperature. The fluorescence intensity of individual cells was measured with NovoCyte 3000RYB using excitation at 640 nm and a 660/20 emission band pass filter and average fluorescence intensities of at least 10,000 cells with a normal morphology gated on FSC-SSC plots were calculated in each sample in FCS Express. The low extent of nonspecific binding of the primary antibody was supported by data obtained with the isotope control antibody Mouse IgM Isotype Control (Thermo Fisher) applied at identical experimental conditions (Supplementary Figure 5).
2.8 Statistical analysisMeasured data are represented as mean ± SEM obtained from n biological replicates for flow cytometry or n individual cells from five independent experiments for confocal microscopy, as indicated in figure legends. In measurements carried out with a flow cytometer, at least 10,000 cells per sample were analyzed in each independent experiment. The p values were calculated by Tukey’s HSD test carried out after significant differences were obtained for between-group effects in ANOVA. Differences were considered significant when p < 0.05 (*p < 0.05, **p < 0.01, ***p < 0.001, ****p < 0.0001).
3 Results3.1 Establishment and validation of a THP-1-derived polarized macrophage modelIn order to generate a simple, efficient and reproducible experimental model of human polarized macrophages, we differentiated acute monocytic leukemia-derived THP-1 cells into macrophages using a low, 10 ng/ml concentration of PMA for 24 h, which, similar to what we observed in our previous studies (73, 74), resulted in attachment of the cells to the bottom of the culture dish, and substantial changes in cellular morphology typical for macrophages with reduced nucleocytoplasmic ratio. After resting PMA-differentiated macrophages for additional 24 h in medium lacking PMA or other activators to ensure M0 phenotype, the cells were polarized according to the classical M1 activation route via LPS and IFN-γ, or on the alternative M2 pathway using IL-4 and IL-13 (64–67). To validate our experimental model, the success of polarization was subsequently tested after 24 and 48 h of polarization by examining the cell surface expression pattern of CD markers characteristic for the different macrophages using flow cytometry. In agreement with literature data, THP-1-derived macrophages treated with LPS and IFN-γ for 24 or 48 h showed distinctive properties of M1 activation manifested in significantly elevated levels of CD64, CD80 and CD86, which were accompanied by no changes in CD206 expression and reduced CD71 levels (Figure 1; Supplementary Figure 1). In contrast, cells treated with IL-4 and IL-13 for 24 or 48 h displayed an M2-like CD marker expression profile with significantly increased amounts of cell surface CD71 and CD86 in the absence of changes in CD64 or CD80 expression. In addition, significantly higher expression of the M2-specific CD206 was found in IL-4 and IL-13-treated cells, however, that appeared only after 48 h. Furthermore, CD expression patterns were strongly similar after 24-h and 48-h polarization, which altogether imply that our generated M1 and M2 cells exhibit cell surface CD expression profiles characteristic for classically and alternatively activated macrophages (75, 76), respectively, already after 24 h polarization, which are retained at least for 48 h. Therefore, experiments described in the next sections and performed between 24 and 48 h of polarization were carried out in stably polarized macrophages.
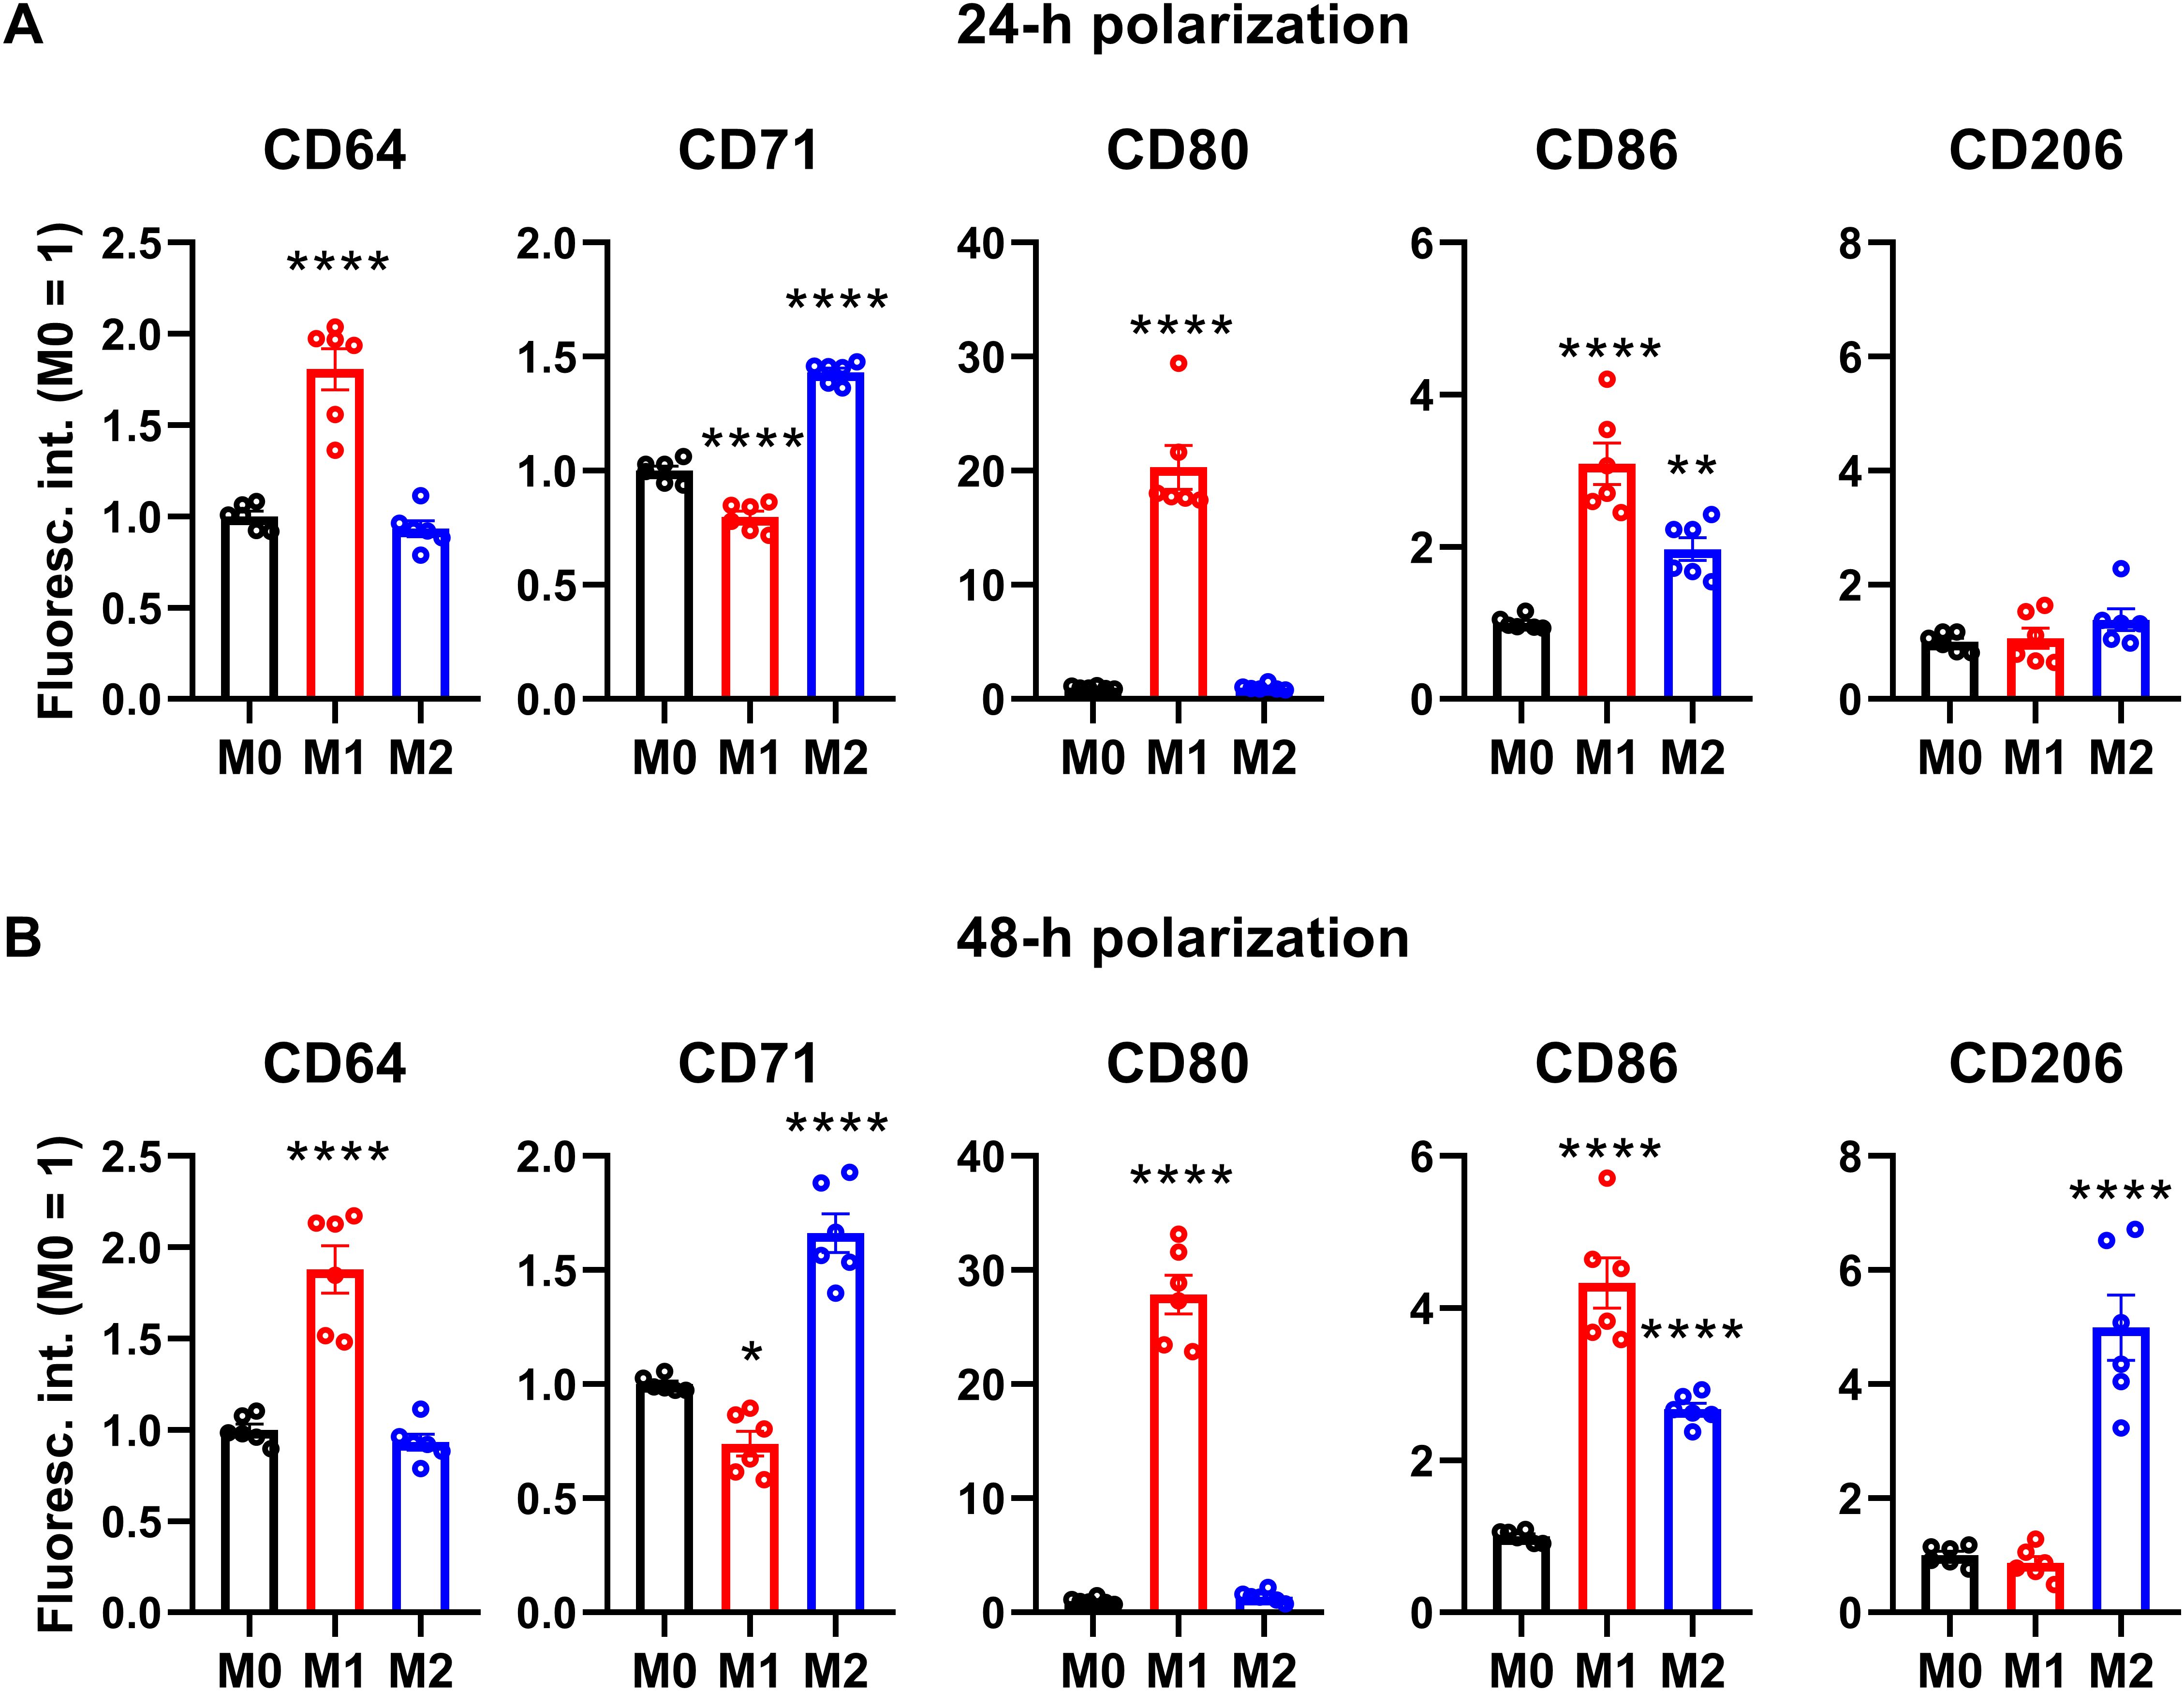
Figure 1. Cell surface CD marker expression profiles of M0, M1 and M2 THP-1-derived macrophages. THP-1 cells were differentiated into macrophages for 24 h by 10 ng/ml PMA, which was followed by a 24-h resting period in the absence of PMA. The differentiated M0 macrophages were subsequently polarized for 24 h (A) or 48 h (B) into classical M1 macrophages with 100 ng/ml LPS plus 20 ng/ml IFN-γ, or M2 macrophages using 20 ng/ml IL-4 plus 20 ng/ml IL-13. After accutase-mediated detachment and Fc receptor blocking, the cell surface expression of CD markers of differentiated and polarized macrophages was quantified using fluorophore-conjugated antibodies and flow cytometry. The average fluorescence intensity of at least 10,000 individual cells of normal morphology per sample was determined and subsequently normalized to the mean value of M0 samples. The normalized fluorescence intensity values obtained in n = 6 biological replicates, and their average values (± SEM) are plotted in both panels. Asterisks indicate significant differences compared to M0 samples (*p < 0.05, **p < 0.01, ****p < 0.0001, ANOVA followed by Tukey’s HSD test).
3.2 The HV1 inhibitor ClGBI dose- and polarization-dependently reduces the viability of polarized macrophagesTo test whether HV1 inhibition compromises the viability of polarized macrophages similarly to that described in various cell types (9, 14, 20, 23, 25, 38), we treated THP-1-derived macrophages polarized as above with a concentration series of ClGBI, a widely applied inhibitor of the channel (8, 9, 13, 14, 20–25). For this, ClGBI-treated and control cells were gently detached with accutase, which was previously shown not to affect cell viability (68), and subsequently labeled with Sytox Green and Alexa Fluor 647-conjugated annexin V to identify necrotic and apoptotic cells, respectively, and determine the fraction of double negative viable cells using flow cytometry (53, 69, 70). In all three examined THP-1-derived macrophage populations, ClGBI significantly and dose-dependently reduced the fraction of living cells (Figure 2). Notably, ClGBI resulted in dramatically lower cell viability at 128 and 256 µM, i.e. concentrations widely applied in cellular studies examining the functions of HV1 (8, 13, 14, 21, 22). Furthermore, the sensitivity of cells varied among the different macrophages as, at most examined concentrations, the effect induced in M1 cells was significantly higher, while that of M2 macrophages significantly lower than in the case of resting M0 macrophages.
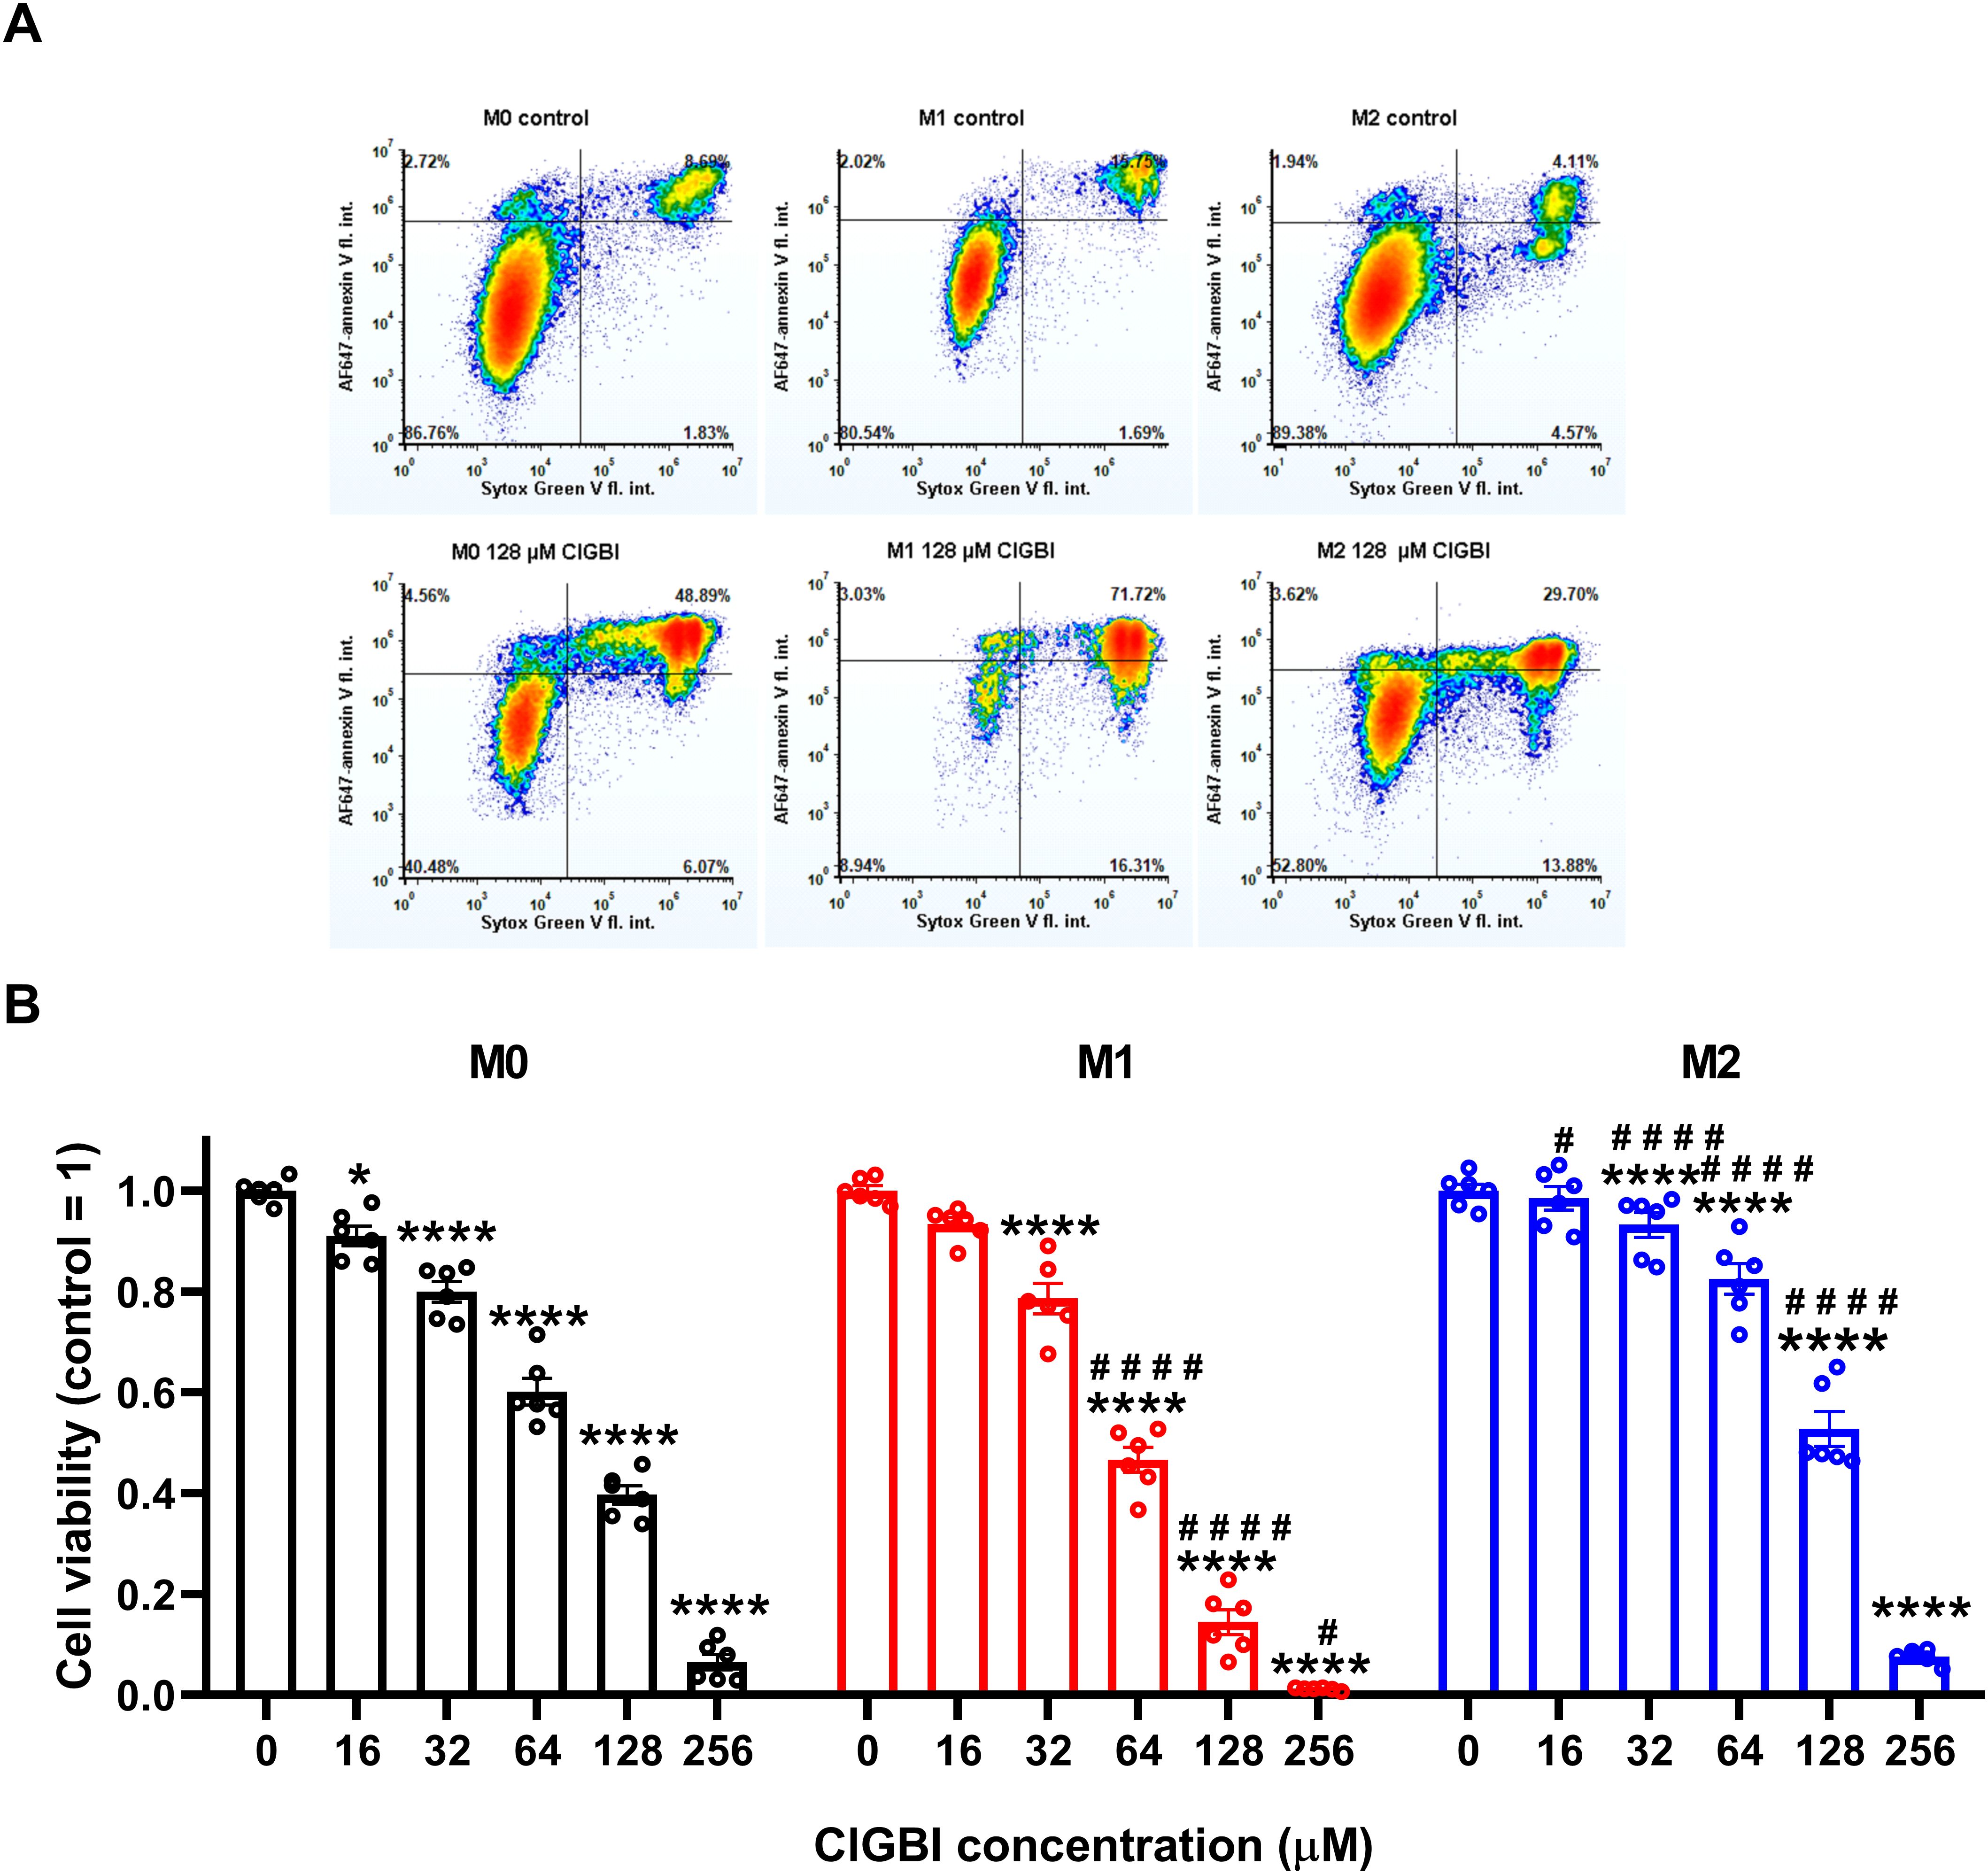
Figure 2. The HV1 inhibitor ClGBI dose-dependently compromises the viability of polarized macrophages most effectively in M1 cells. THP-1 cells were differentiated into macrophages for 24 h by 10 ng/ml PMA, which was followed by a 24-h resting period in the absence of PMA. The differentiated M0 macrophages were subsequently polarized for 24 h into classical M1 macrophages with 100 ng/ml LPS plus 20 ng/ml IFN-γ, or M2 macrophages using 20 ng/ml IL-4 plus 20 ng/ml IL-13. Cells were subsequently treated for 24 h with ClGBI at concentrations ranging between 16 and 256 µM. After collecting cells in suspension and those detached by accutase, the macrophages were labeled with Sytox Green and Alexa Fluor 647-conjugated annexin V to identify necrotic and apoptotic cells, respectively. Fluorescence intensities of individual cells were measured using flow cytometry and the relative fraction of double negative viable cells was determined in each sample containing at least 10,000 cells, and normalized to the mean value determined in control untreated samples. (A) Representative density plots demonstrate the effect of 128 µM ClGBI on the viability of M0, M1 and M2 macrophages. (B) The normalized viable ratios obtained in n = 6 biological replicates, and their average values (± SEM) are plotted in the figure. Asterisks indicate significant differences compared to control samples (*p < 0.05, ****p < 0.0001), while hashes show that compared to M0 at the given applied ClGBI concentration (#p < 0.05, ####p < 0.0001), which were determined by Tukey’s HSD test carried out after significant differences were obtained for between-group effects in ANOVA.
3.3 The ClGBI-induced decrease in viability of polarized macrophages is mediated through HV1 inhibitionTo corroborate that ClGBI-induced reductions in cell viability are induced by HV1 inhibition and not the off-target effects of the compound on other macrophage-resident ion channels (77), we examined the impact of other relevant ion channel blockers on the viability of M0, M1 and M2 THP-1-derived macrophages by applying Vm24 scorpion toxin, a specific blocker of KV1.3 (78), tetrodotoxin, a specific inhibitor of voltage-gated sodium channels (79), TEA+, a wide-spectrum potassium channel blocker (80), and Zn2+, a well-known non-specific inhibitor of HV1 (1). Vm24, tetrodotoxin, TEA+ and Zn2+ were applied at concentrations most commonly utilized in in vitro functional assays and cellular studies. In these experiments, TTX failed to affect cell viability, and the potassium channel inhibitors Vm24 or TEA+ resulted in only mild effects mainly in M1 cells. On the contrary, the HV1 inhibitor Zn2+ remarkably reduced the viability of macrophages, particularly in M1 cells in accordance with ClGBI effects (Figure 3). While the effect induced by Zn2+ on M1 macrophages was significantly larger than that on M0 cells, the difference between M1 and M2 was on the verge of statistical significance (p=0.0678). Although the significant difference between the effect of ClGBI on the viability of M1 and M2 macrophages would suggest a similar correlation for the effect of Zn2+, the lack of a smaller effect of Zn2+ on the viability of M2 macrophages can potentially be attributed to the importance of Zn-sensitive proteins in the function of M2 macrophages and consequent potential off-target effects or the lower potency of Zn2+ compared to ClGBI (81).
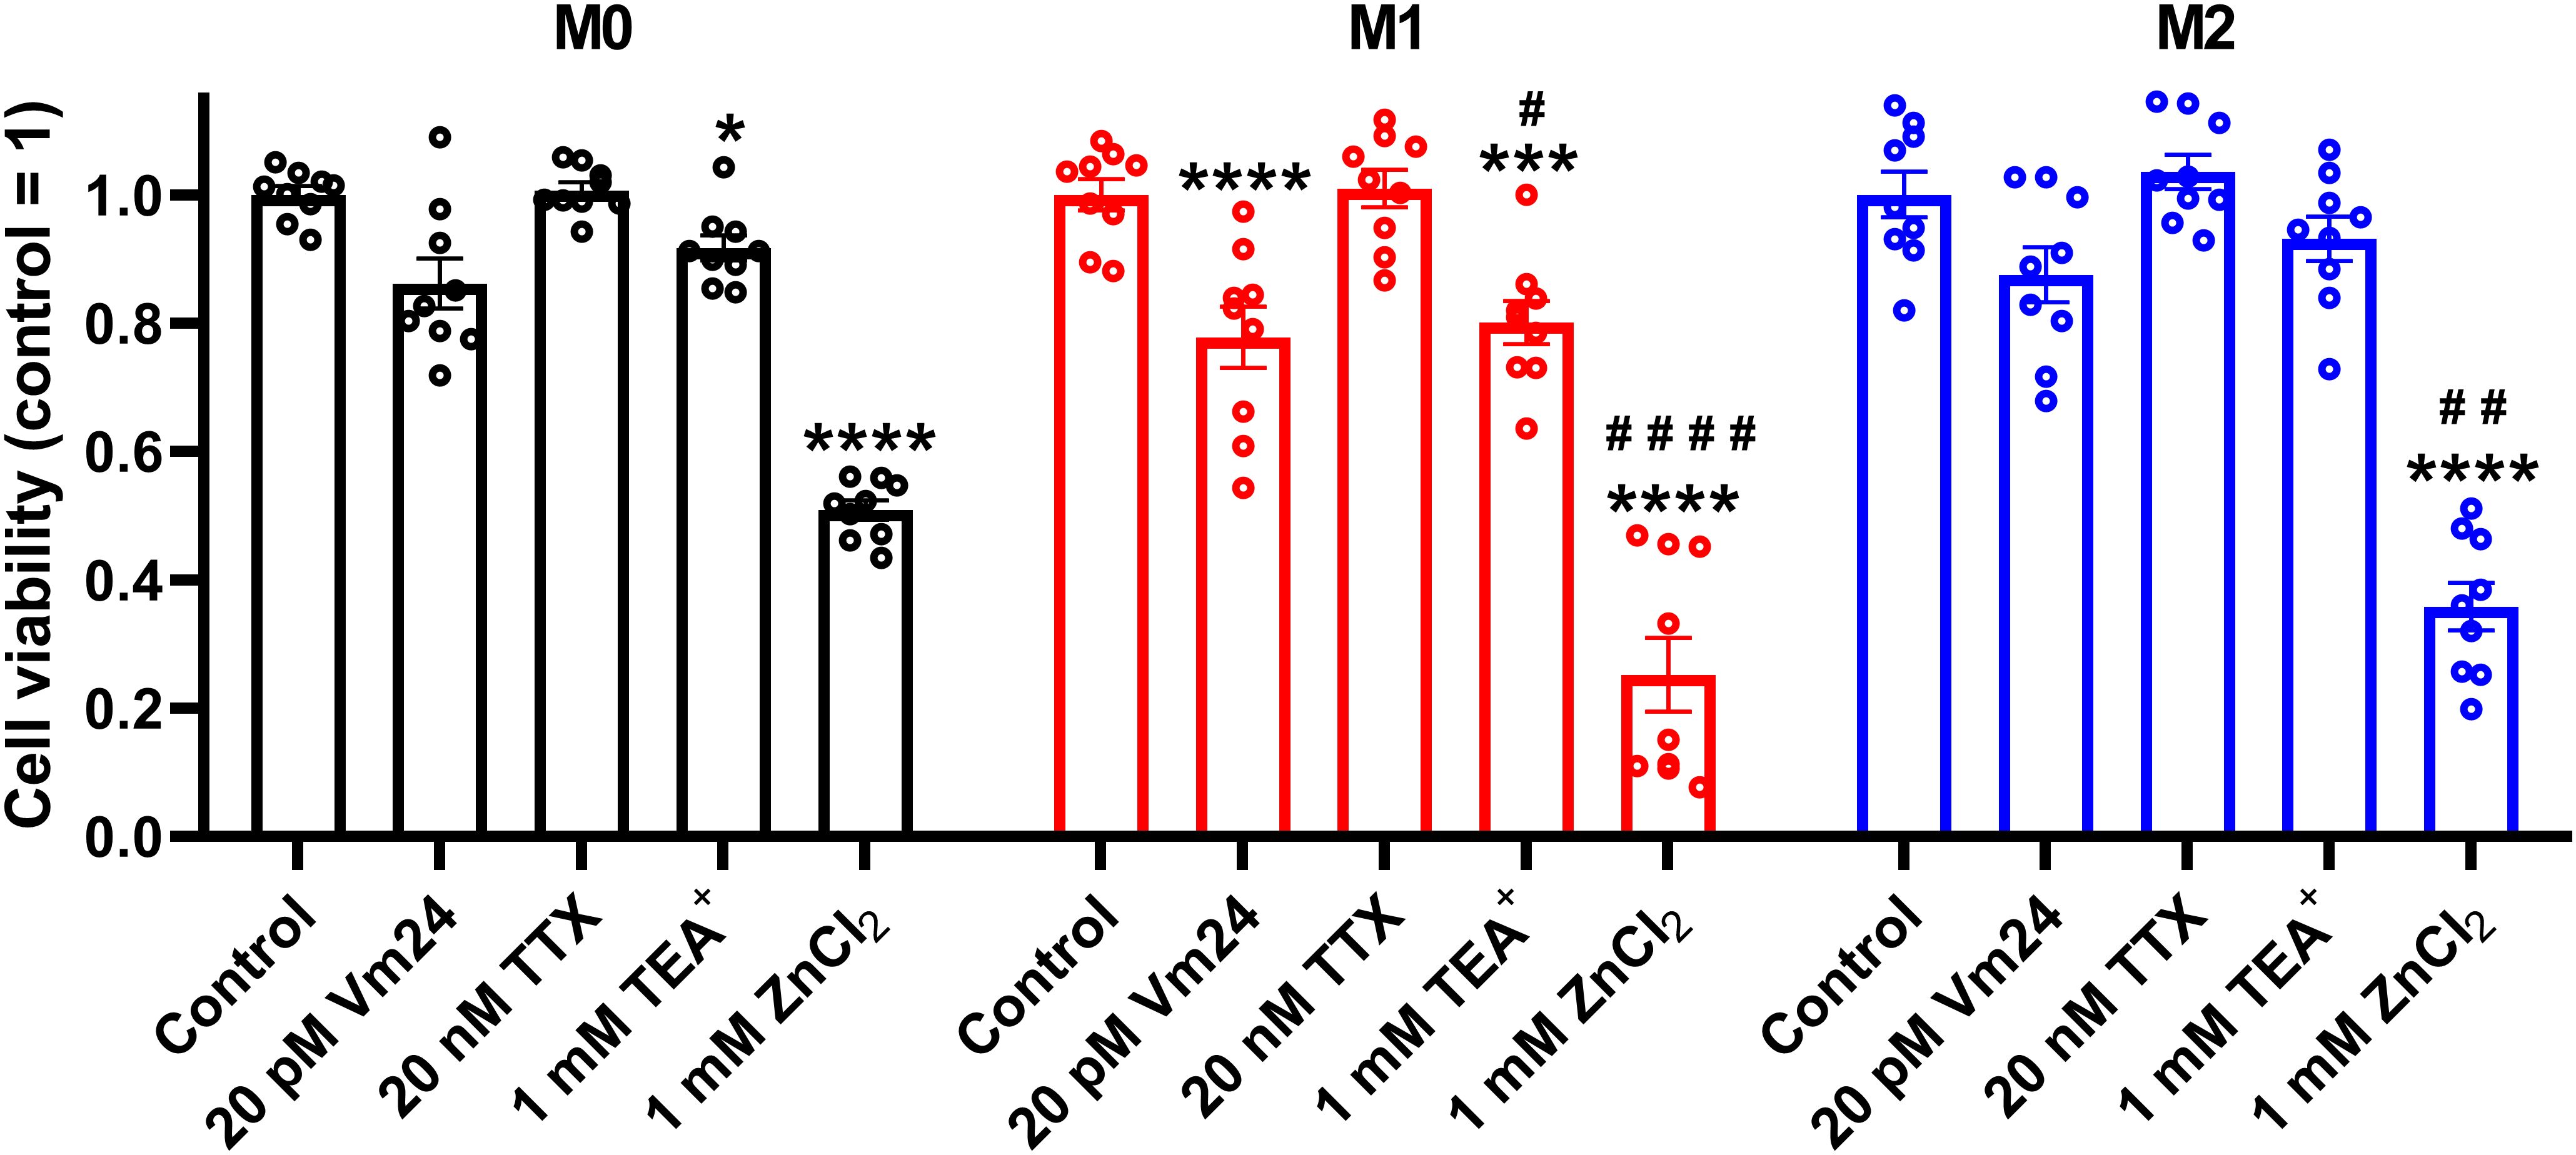
Figure 3. Effects of ion channel blockers on the viability of polarized macrophages. THP-1 cells were differentiated into macrophages for 24 h by 10 ng/ml PMA, which was followed by a 24-h resting period in the absence of PMA. The differentiated M0 macrophages were subsequently polarized for 24 h into classical M1 macrophages with 100 ng/ml LPS plus 20 ng/ml IFN-γ, or M2 macrophages using 20 ng/ml IL-4 plus 20 ng/ml IL-13. Cells were subsequently treated for 24 h with 20 pM Vm24 scorpion toxin, 20 nM TTX, 1 mM TEA+ or 1 mM (nominal) ZnCl2. After collecting cells in suspension and those detached by accutase, the macrophages were labeled with Sytox Green and Alexa Fluor 647-conjugated annexin V to identify necrotic and apoptotic cells, respectively. Fluorescence intensities of individual cells were measured using flow cytometry and the relative fraction of double negative viable cells was determined in each sample containing at least 10,000 cells, and normalized to the mean value determined in control untreated samples. The normalized viable ratios obtained in n = 9 biological replicates, and their average values (± SEM) are plotted in the figure. Asterisks indicate significant differences compared to control samples (*p < 0.05, ***p < 0.001, ****p < 0.0001), while hashes show that compared to M0 at the given applied inhibitor concentration (#p < 0.05, ##p < 0.01, ####p < 0.0001), which were determined by Tukey’s HSD test carried out after significant differences were obtained for between-group effects in ANOVA.
Since both of the examined HV1 blockers, ClGBI and Zn2+, compromised the viability of M1 macrophages to a larger extent than in M0 or M2 cells (Figures 2, 3), we next investigated the HV1 expression in these cells using flow cytometry. Consistent with the larger effects of HV1 blockers, M1 cells exhibited significantly higher HV1 expression than M0 cells, while the abundance of HV1 was the lowest in M2 cells (Figure 4A; Supplementary Figure 2). Furthermore, an excellent correlation was found between the extents of reductions in the viability of M0, M1 and M2 macrophages and the levels of HV1 expression (Figure 4B). Altogether, the results obtained with other relevant ion channel inhibitors and the correlation between HV1 expression and the extent of HV1 inhibition-induced reductions in cell viability convincingly support that the effects elicited by ClGBI may in fact be caused by its inhibitory actions on HV1.
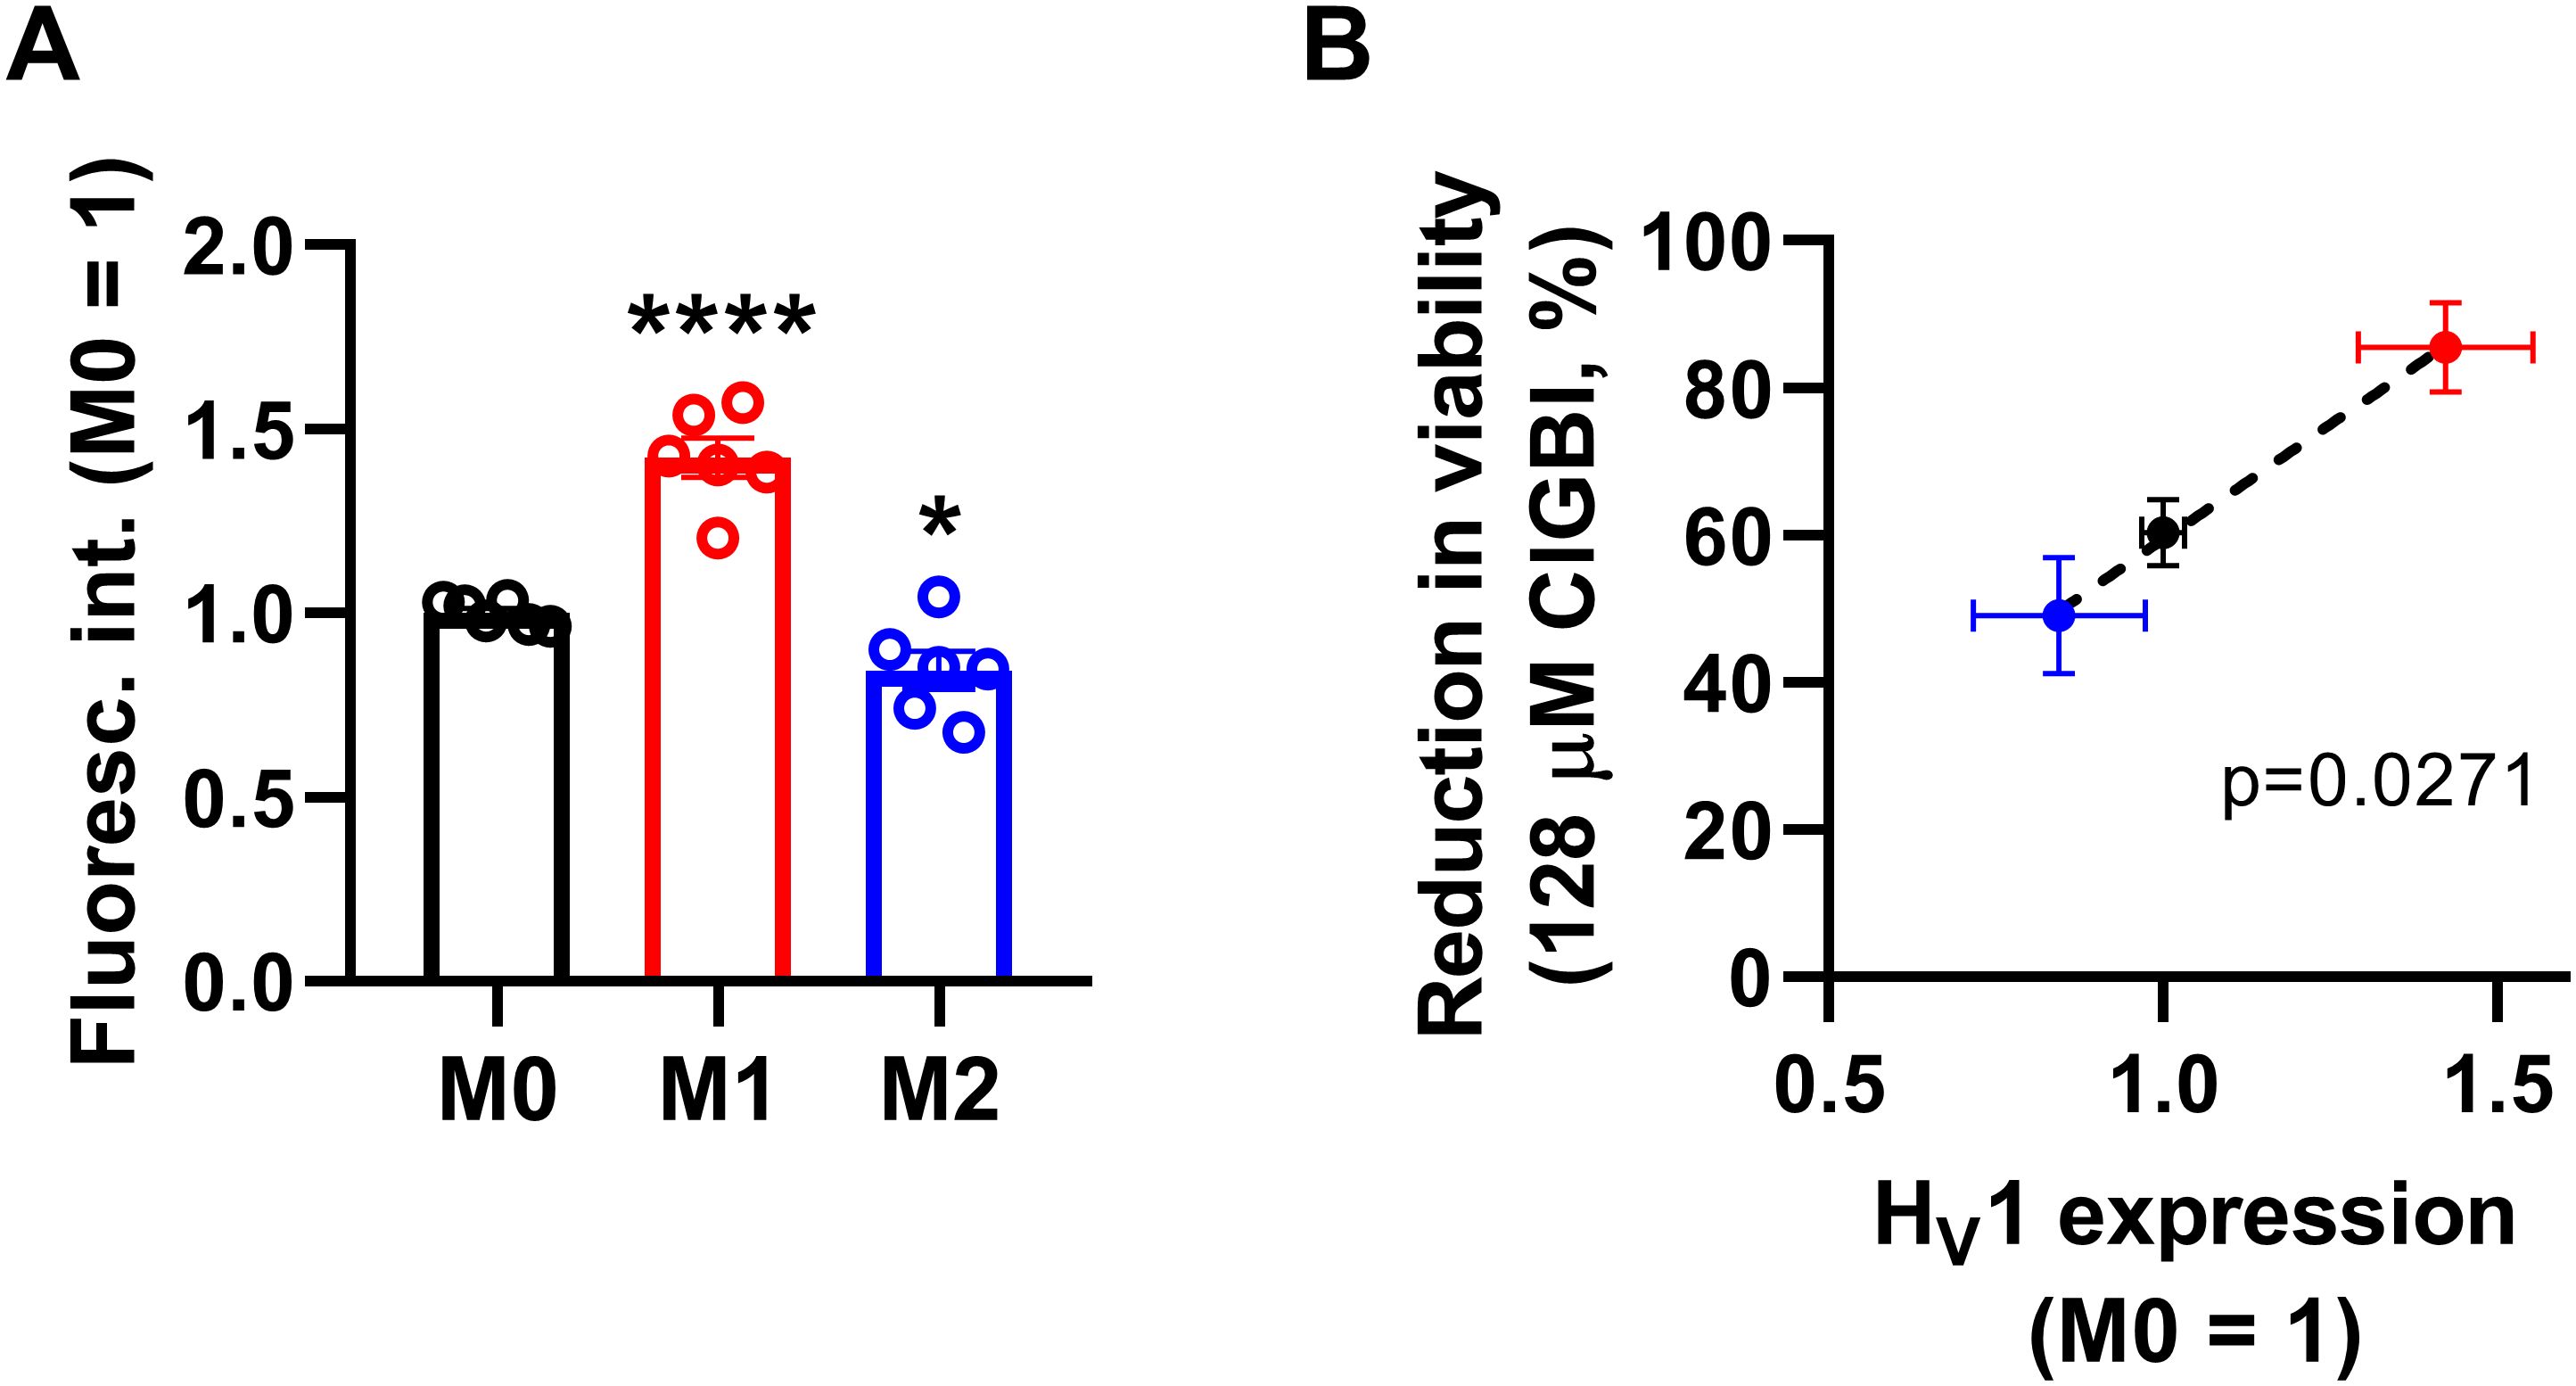
Figure 4. The HV1 expression of polarized macrophages correlates with the ClGBI-induced reduction in cell viability. (A) THP-1 cells were differentiated into macrophages for 24 h by 10 ng/ml PMA, which was followed by a 24-h resting period in the absence of PMA. The differentiated M0 macrophages were subsequently polarized for 24 h into classical M1 macrophages with 100 ng/ml LPS plus 20 ng/ml IFN-γ, or M2 macrophages using 20 ng/ml IL-4 plus 20 ng/ml IL-13. After accutase-mediated detachment, fixation, permeabilization and Fc receptor blocking, the HV1 expression of differentiated and polarized macrophages was quantified using indirect immunofluorescence labeling and flow cytometry. The average fluorescence intensity of at least 10,000 individual cells of normal morphology per sample was determined and subsequently normalized to the mean value of M0 samples. The normalized fluorescence intensity values obtained in n = 6 biological replicates, and their average values (± SEM) are plotted in the figure. Asterisks indicate significant differences compared to M0 samples (*p < 0.05, ****p < 0.0001, ANOVA followed by Tukey’s HSD test). (B) Average values (± SEM) of reduction in the viability of M0, M1 and M2 macrophages induced by 128 µM ClGBI as a function of HV1 expression normalized to M0 cells. The p value determined with Deming regression analysis is shown in the panel, which revealed significant correlation between the extent of compromised cell viability and HV1 expression.
3.4 ClGBI-induced alterations in cytoplasmic and lysosomal pH of polarized macrophagesSince an HV1 deficiency or inhibition was previously shown to affect pH regulation by inducing cytoplasmic acidification in different cell types (8, 10, 13, 18, 20, 23, 28, 36, 82), we next investigated changes in the pH of the cytoplasm of polarized macrophages by using flow cytometry and pHrodo Red AM, an intracellular pH-sensitive fluorescence indicator that traverses the cell membrane and remains within the intracellular space upon cleavage by nonspecific esterases (71). In these measurements, we applied ClGBI for various durations at concentrations roughly corresponding to the dose eliciting 50% decreases in cell viability, i.e. 100 µM for M0 and M2 cells and 50 µM for M1 cells. Furthermore, to ensure comparability of sensitivities, we carried out experiments by adding 100 µM to M1 cells as well. Given that cell death is generally associated with losing adherence, in these experiments and those described later when examining the mechanism of ClGBI action, we analyzed only the cells that remained adherent to the cell culture dish after the treatment to investigate molecular events leading to cell death and not solely appearing as a consequence of it. We observed time-dependent increases in the fluorescence intensity of the dye in all macrophage populations referring to a pH reduction. To quantify these alterations, we performed calibration with samples incubated in the presence of a combination of valinomycin and nigericin dissolved into cellular calibration buffers of known pH. When interpolating pH values of samples from the calibration curve, we found significant time-dependent pH decreases in all macrophage subtypes in response to ClGBI (Figure 5; Supplementary Figure 3). Notably, the magnitudes of changes were the largest in M1 cells, particularly at 100 µM concentration of the compound, in accordance with the higher HV1 expression of these cells.
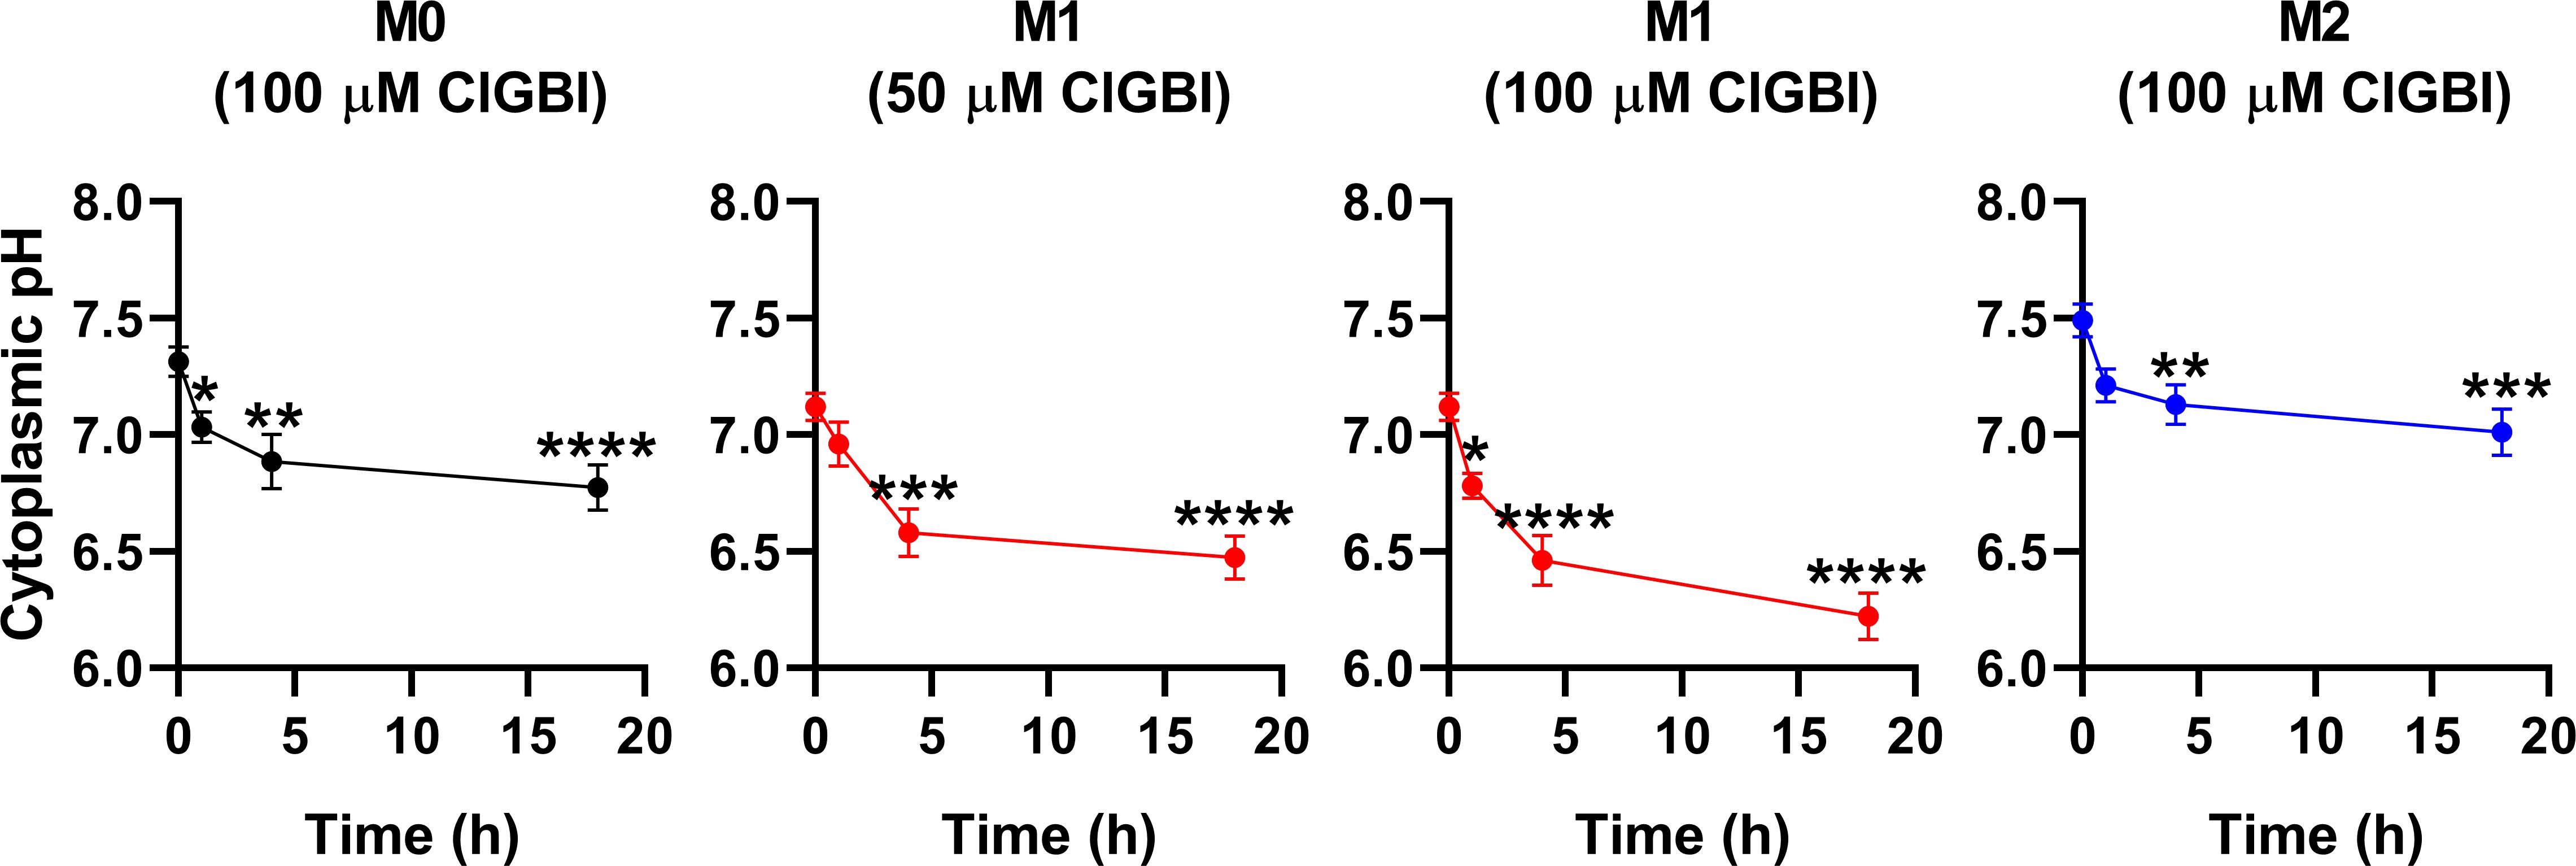
Figure 5. ClGBI time-dependently acidifies the cytoplasm of polarized macrophages most efficiently in M1 cells. THP-1 cells were differentiated into macrophages for 24 h by 10 ng/ml PMA, which was followed by a 24-h resting period in the absence of PMA. The differentiated M0 macrophages were subsequently polarized for 24 h into classical M1 macrophages with 100 ng/ml LPS plus 20 ng/ml IFN-γ, or M2 macrophages using 20 ng/ml IL-4 plus 20 ng/ml IL-13. Cells were subsequently treated for 1, 4 or 18 h with 50 or 100 µM ClGBI. In the last 30 min of incubation, the cytoplasmic pH indicator pHrodo Red AM was further added to cells. After accutase-mediated detachment, the fluorescence intensity of individual cells was measured using flow cytometry and the average fluorescence intensity of at least 10,000 cells of normal morphology per sample was determined. Corresponding pH values of individual cells were subsequently interpolated from the calibration curve determined based on calibration samples incubated with valinomycin and nigericin dissolved into cellular calibration pH buffers. The average pH values obtained from n = 12 biological replicates (± SEM) are plotted in the figure. Asterisks indicate significant differences compared to untreated control samples (*p < 0.05, **p < 0.01, ***p < 0.001, ****p < 0.0001, ANOVA followed by Tukey’s HSD test).
While lysosomal pH alterations in response to HV1 inhibition and their potential link to compromised viability have not been examined previously in any cell types, based on the facts that a deficiency or a block of the channel modifies phagosomal pH acidification (49, 50) and reduced lysosomal acidity is often associated with cell death (82, 83), it is reasonable to assume that such lysosomal pH changes may occur due to reduced HV1 conductance, which could contribute to cellular toxicity. To confirm this hypothesis, we evaluated ClGBI-induced effects on lysosomal pH. For this, polarized macrophages were treated with ClGBI as described above, and also incubated for 1 h in the presence of 70,000 MW, anionic dextrane conjugated to a pH-sensitive and a pH-insensitive fluorophore, fluorescein and tetramethylrhodamine, respectively, which was followed by a chase period in the absence of the dextrane for 2 h. This protocol ensured that the indicator is exclusively accumulated into the lysosomes (72). Hence, fluorescence microscopic determination of the Fluorescein/TAMRA ratio quantifies the lysosomal pH of cells. Fluorescein/TAMRA ratios can be directly translated into lysosomal pH values by applying calibration samples with valinomycin, nigericin and bafilomycin dissolved into cellular calibration buffers of known pH. By using this method, we observed significant time-dependent alkalinization of the lysosomes of M0, M1 and M2 macrophages as well in response to blocking HV1 channels with ClGBI (Figure 6; Supplementary Figure 4). Again, the largest effects were found in M1 macrophages at 100 µM ClGBI. Altogether, our results suggest a profound pH dysregulation throughout the cell in response to HV1 inhibition, which involves both the cytoplasmic and lysosomal compartments.
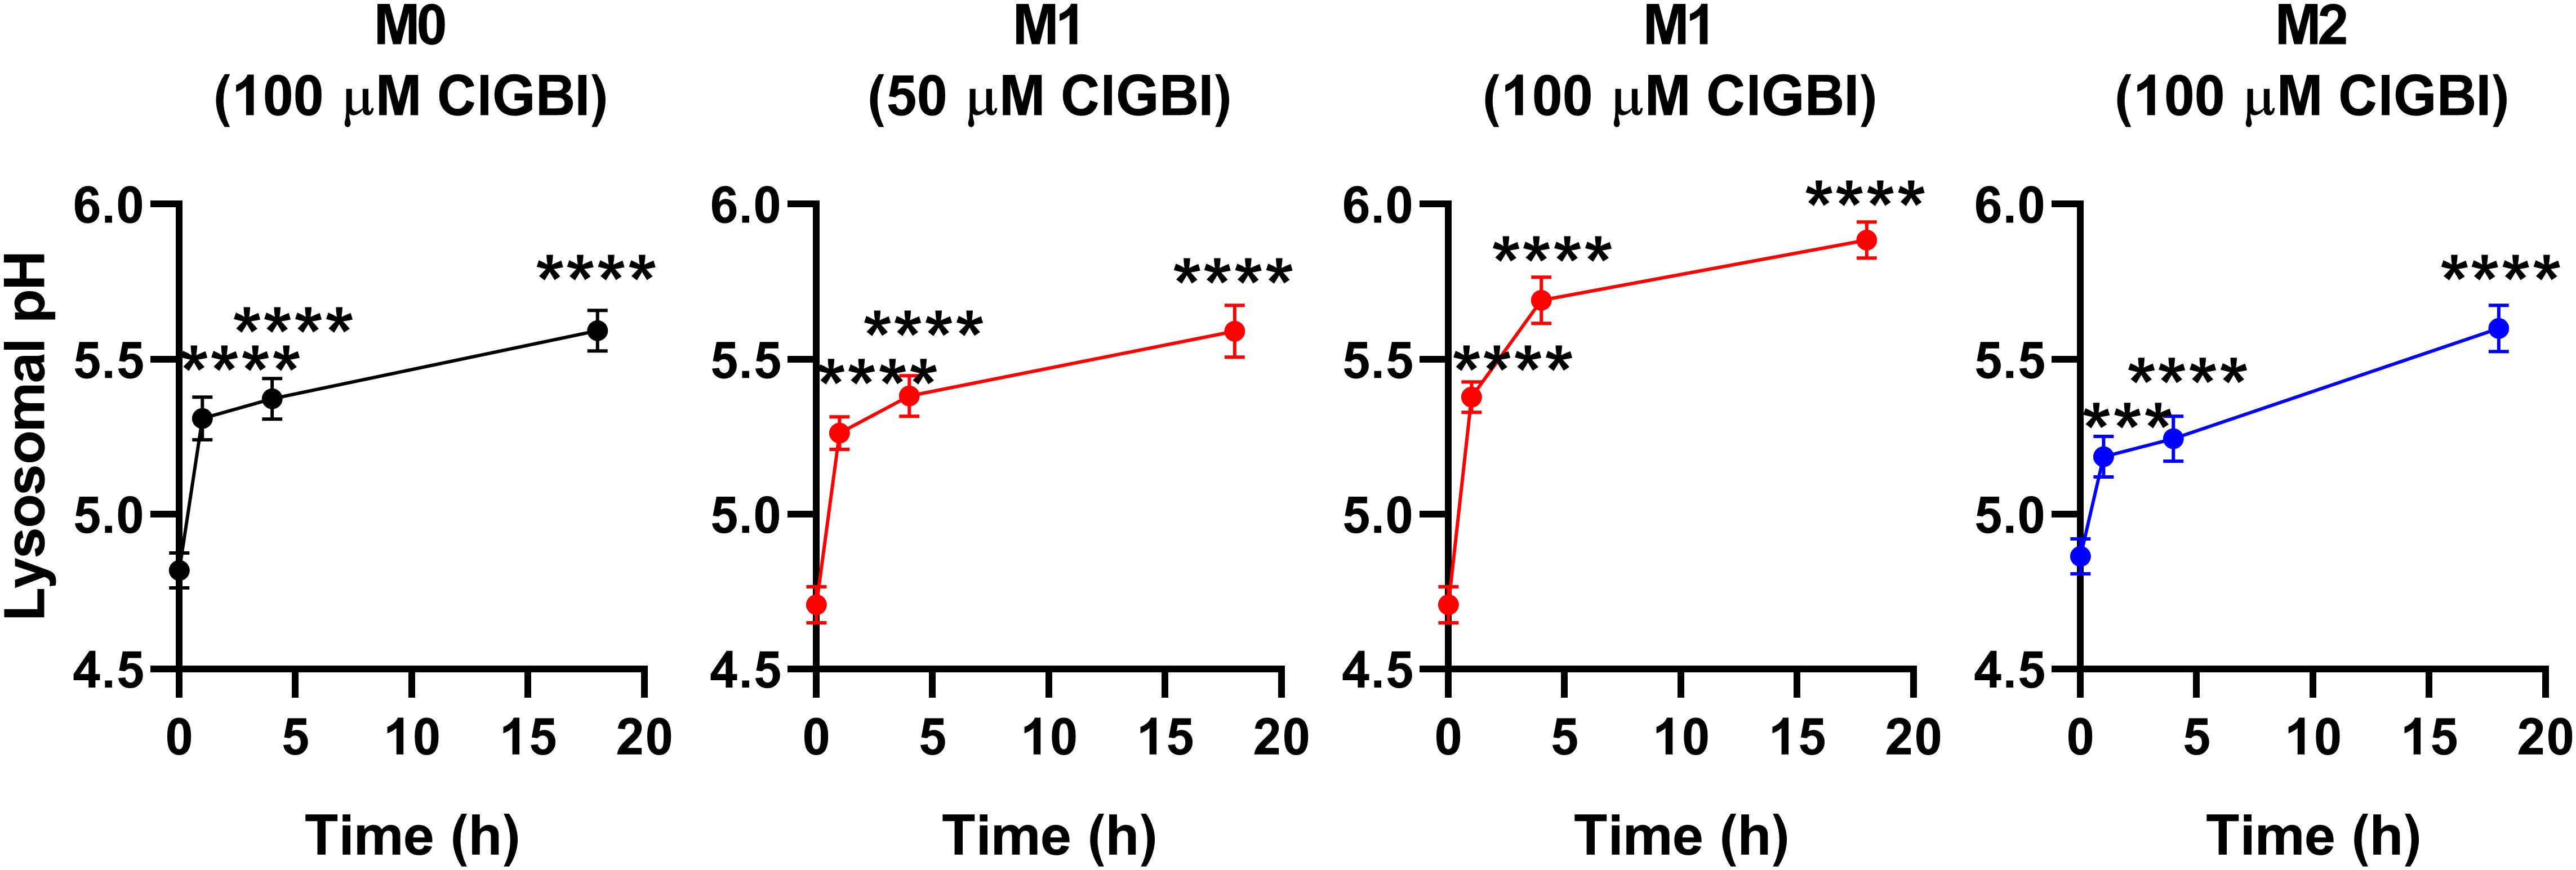
Figure 6. ClGBI time-dependently alkalizes the lyosomes of polarized macrophages most efficiently in M1 cells. THP-1 cells were differentiated into macrophages for 24 h by 10 ng/ml PMA, which was followed by a 24-h resting period in the absence of PMA. The differentiated M0 macrophages were subsequently polarized for 24 h into classical M1 macrophages with 100 ng/ml LPS plus 20 ng/ml IFN-γ, or M2 macrophages using 20 ng/ml IL-4 plus 20 ng/ml IL-13. Cells were subsequently treated for 1, 4 or 18 h with 50 or 100 µM ClGBI. 3 hours before the measurement time, 70,000 MW, anionic dextrane conjugated to pH-sensitive fluorescein and pH-insensitive tetramethylrhodamine (TAMRA) was added to cells for 1 h, which was followed by a chase of 2 h. Then, images were taken at the midplane of cells using a confocal microscope and the average fluorescein/TAMRA fluorescence intensity ratio positively correlating with the value of lysosomal pH was calculated for each individual cell using data of pixels corresponding to lysosomes. pH values were subsequently interpolated from the calibration curve determined based on calibration samples incubated with valinomycin, nigericin and bafilomycin dissolved into cellular calibration pH buffers. The average pH values obtained from n = 60-80 individual cells obtained from five independent experiments (± SEM) are plotted in the figure. Asterisks indicate significant differences compared to untreated control samples (***p < 0.001, ****p < 0.0001, ANOVA followed by Tukey’s HSD test).
3.5 ClGBI-induced reductions in cell viability are associated with parallel time-dependent elevations of plasma membrane ceramide levelsWhile experiments outlined in the previous section demonstrated pH alterations, they did not provide information about the possible molecular mechanisms connecting the reduced HV1 conductance, complex pH dysregulation and cell death. Considering the substantial link between increased ceramide levels and various forms of cell death (55, 57) and the fact that ceramide is synthetized by pH-sensitive enzymes (58–60), we hypothesized that an elevation in membrane ceramide levels contributes to the effects of HV1 inhibitors on cell viability. To confirm this assumption, first we quantified time-dependent changes in the membrane abundance of ceramide using flow cytometry and anti-ceramide antibodies as previously (53). First, we compared membrane ceramide levels of untreated samples and found that the membrane abundance of ceramide was significantly higher in M1 cells than in M0 or M2 macrophages (Figure 7A; Supplementary Figure 5). Furthermore, in these measurements, ClGBI resulted in significant time-dependent increases in membrane ceramide levels in M0, M1 and M2 macrophages as well, and the largest elevation was seen in M1 cells in response to 100 µM ClGBI (Figure 7B; Supplementary Figure 5). These experiments convincingly showed that a HV1 inhibition was accompanied by increased ceramide levels, however, they did not provide any details about the exact molecules involved in the plausible causative relationship between the two.
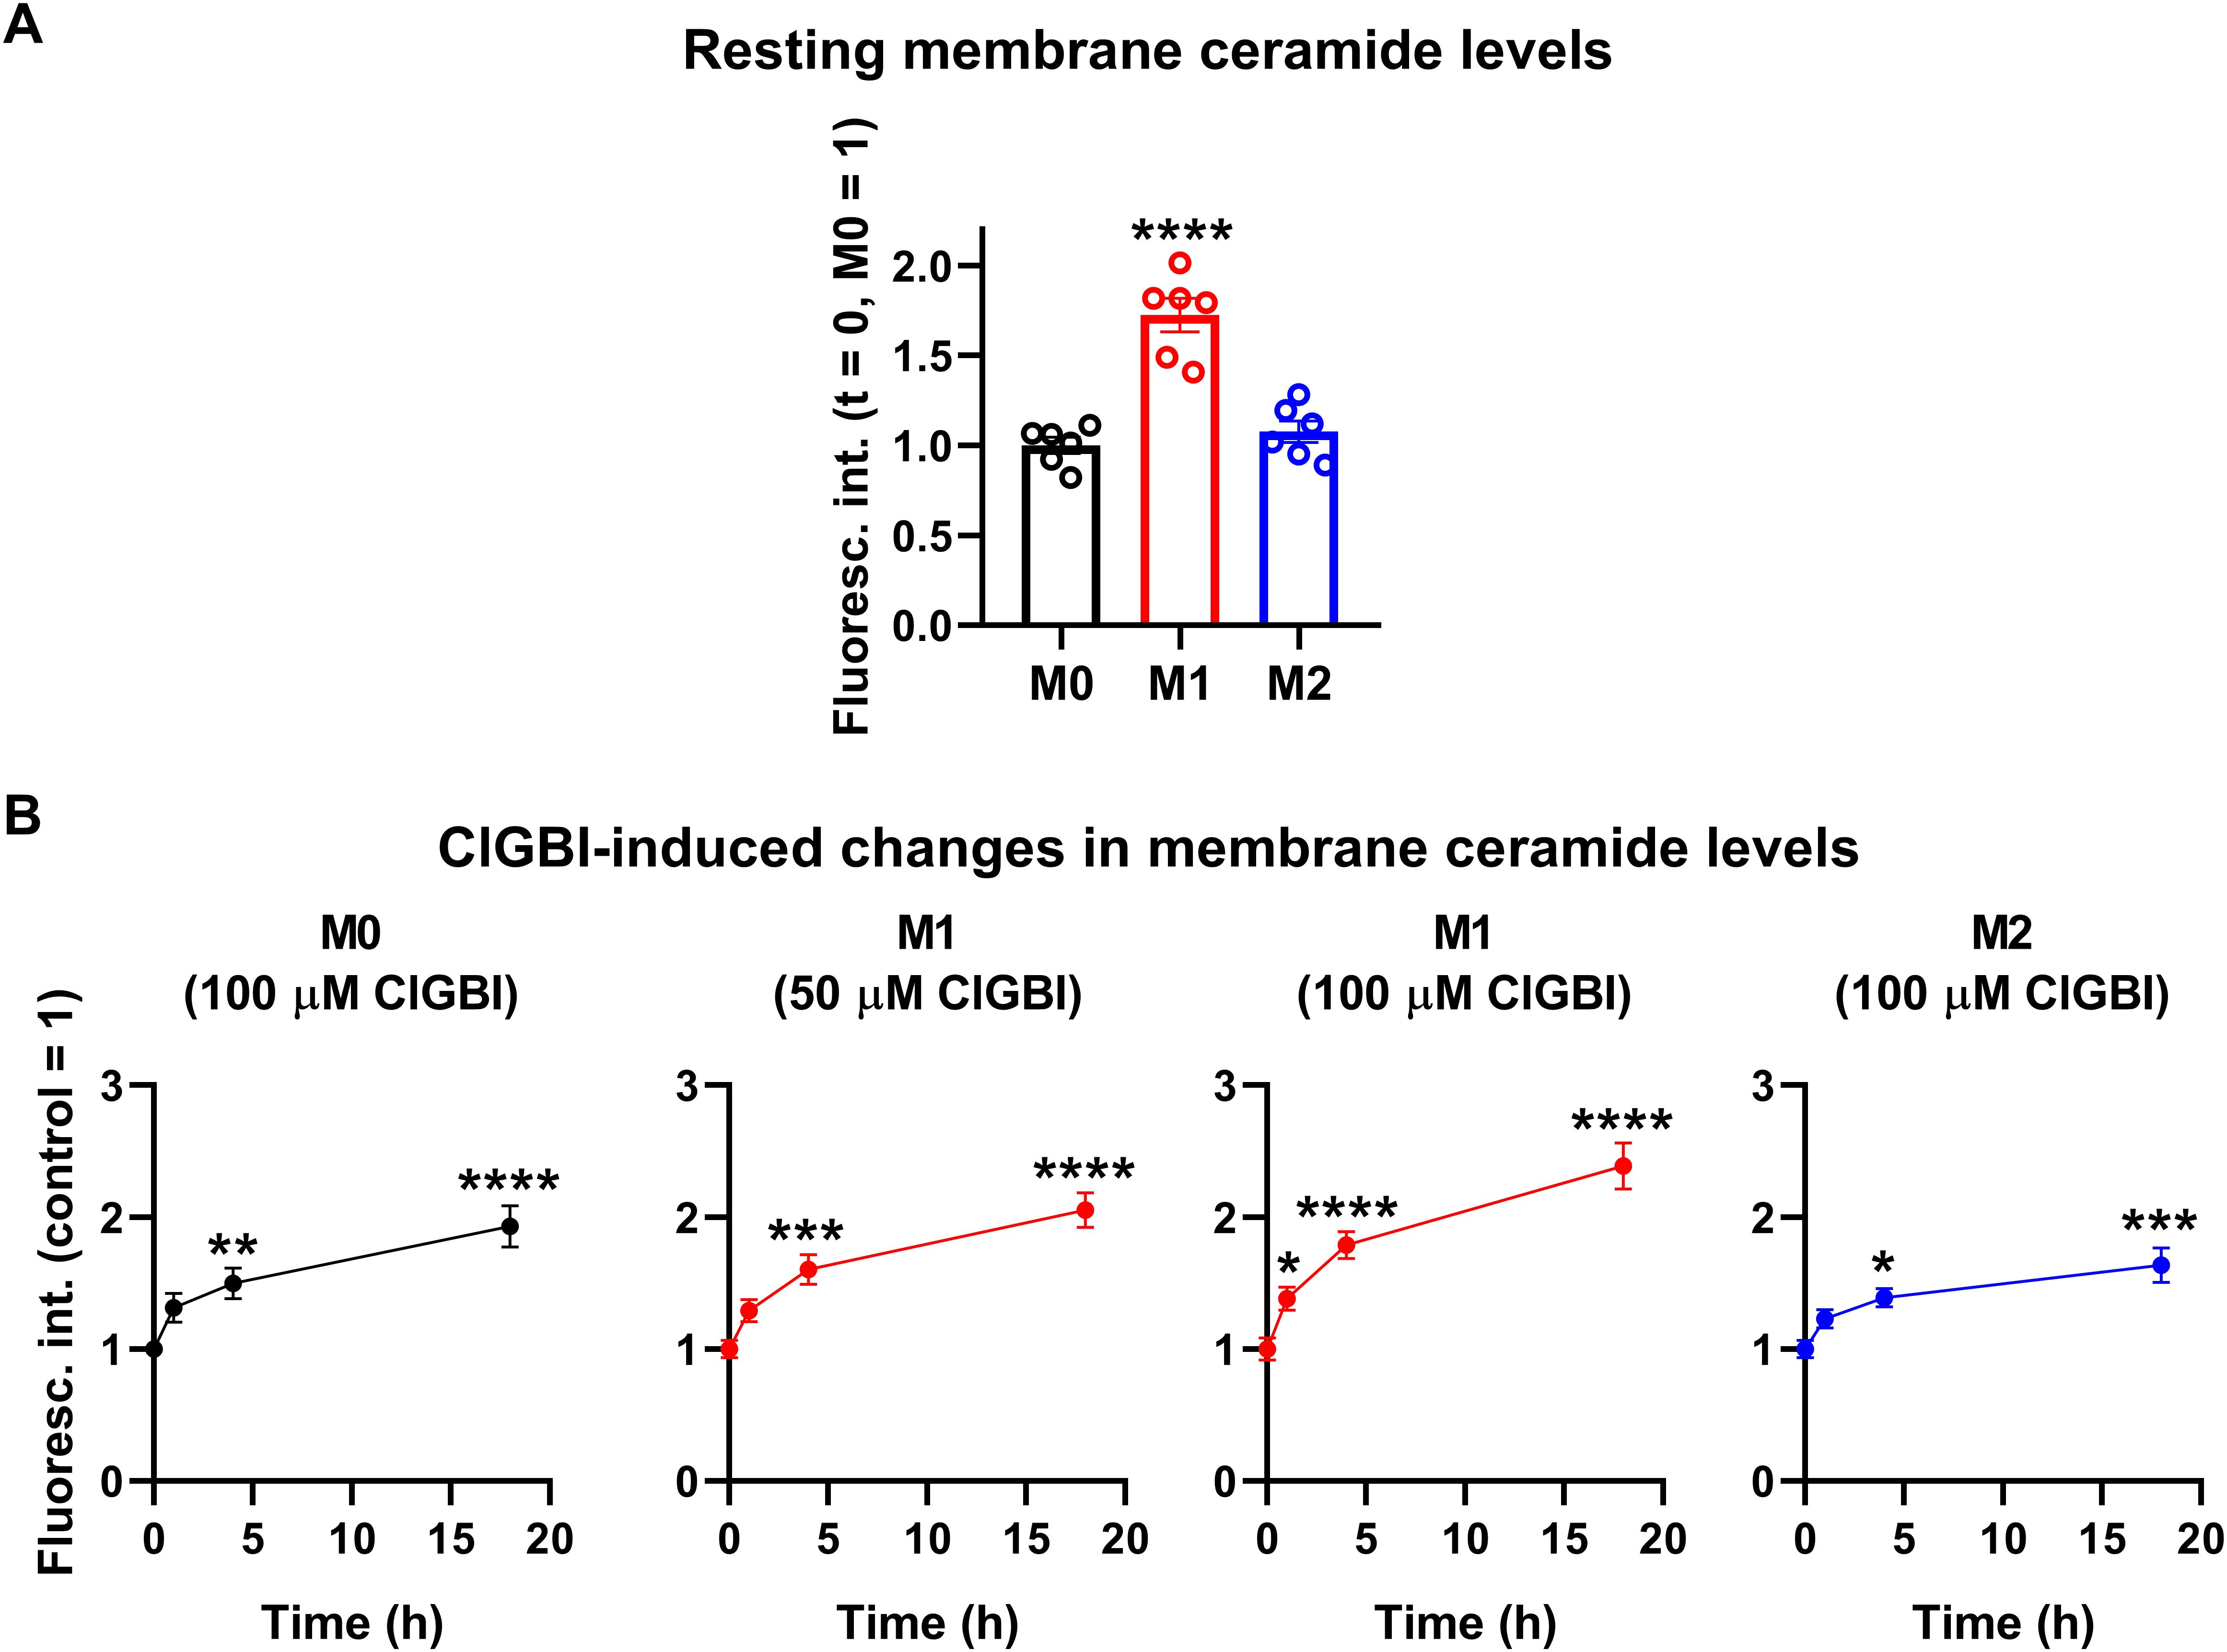
Figure 7. ClGBI induces a time-dependent elevation in membrane ceramide levels of polarized macrophages most effectively in M1 cells. THP-1 cells were differentiated into macrophages for 24 h by 10 ng/ml PMA, which was followed by a 24-h resting period in the absence of PMA. The differentiated M0 macrophages were subsequently polarized for 24 h into classical M1 macrophages with 100 ng/ml LPS plus 20 ng/ml IFN-γ, or M2 macrophages using 20 ng/ml IL-4 plus 20 ng/ml IL-13. Cells were subsequently treated for 1, 4 or 18 h with 50 or 100 µM ClGBI. After accutase-mediated detachment and Fc receptor blocking, cells were labeled with anti-ceramide antibodies followed by AlexaFluor647-conjugated goat anti-mouse IgM antibodies. Fluorescence intensities of individual cells were subsequently measured using flow cytometry and the average fluorescence intensity of at least 10,000 cells of normal morphology per sample was determined. (A) Average fluorescence intensities of each untreated sample were subsequently normalized to the mean value determined in the untreated M0 macrophages and the normalized fluorescence intensity values obtained in n = 6 biological replicates, and their average values (± SEM) are plotted in the panel. Asterisks indicate significant differences compared to M0 samples (****p < 0.0001, ANOVA followed by Tukey’s HSD test). (B) Alternatively, for each cell type, average fluorescence intensities of each sample were normalized to the mean value determined in the untreated, control sample. The average values (± SEM) of normalized fluorescence intensities obtained from n = 6 biological replicates are plotted in the figure. Asterisks indicate significant differences compared to untreated control samples (*p < 0.05, **p < 0.01, ***p < 0.001, ****p < 0.0001, ANOVA followed by Tukey’s HSD test).
3.6 ClGBI-induced reductions in cell viability are alleviated by an inhibitor of acid sphingomyelinaseIf elevated membrane ceramide levels indeed contributed to the compromised cell viability induced by an HV1 block, such an effect should be alleviated by an inhibition of ceramide synthesis. Since ceramide production mainly occurs through de novo synthesis, or activation of neutral and acid sphingomyelinases (55–57), we examined the potential protective effects of inhibitors of these pathways. Namely, we inhibited serine palmitoyltransferase with myriocin (84), neutral sphingomyelinase with GW4869 (85), and acid sphingomyelinase with ARC39 (86). In these experiments THP-1-derived macrophages were pre-treated with these inhibitors, which was followed by an incubation in the presence of ClGBI, 100 µM in the case of M0 and M2 cells while 50 µM in M1 macrophages, and determination of the fraction of viable cells as above (Figure 2). In accordance with our previous experiments, ClGBI largely reduced viability in M0, M1 and M2 cells as well (Figure 8A). However, inhibitors of ceramide production provided partial protection against ClGBI. While such effects induced by the serine palmitoyltransferase inhibitor myriocin and the neutral sphingomyelinase blocker GW4869 were rather negligible, ARC39, that specifically inhibits acid sphingomyelinase, largely alleviated ClGBI-induced compromised viabilities in all cell types, but particularly in M1 macrophages. Furthermore, ClGBI-elicited increases in plasma membrane ceramide levels were attenuated by ARC39 in all macrophage subtypes (Figure 8B). Altogether, these results confirmed that blocking HV1 results in cellular toxicity, which is mediated by an overproduction of ceramide, mainly through acid sphingomyelinase activity.
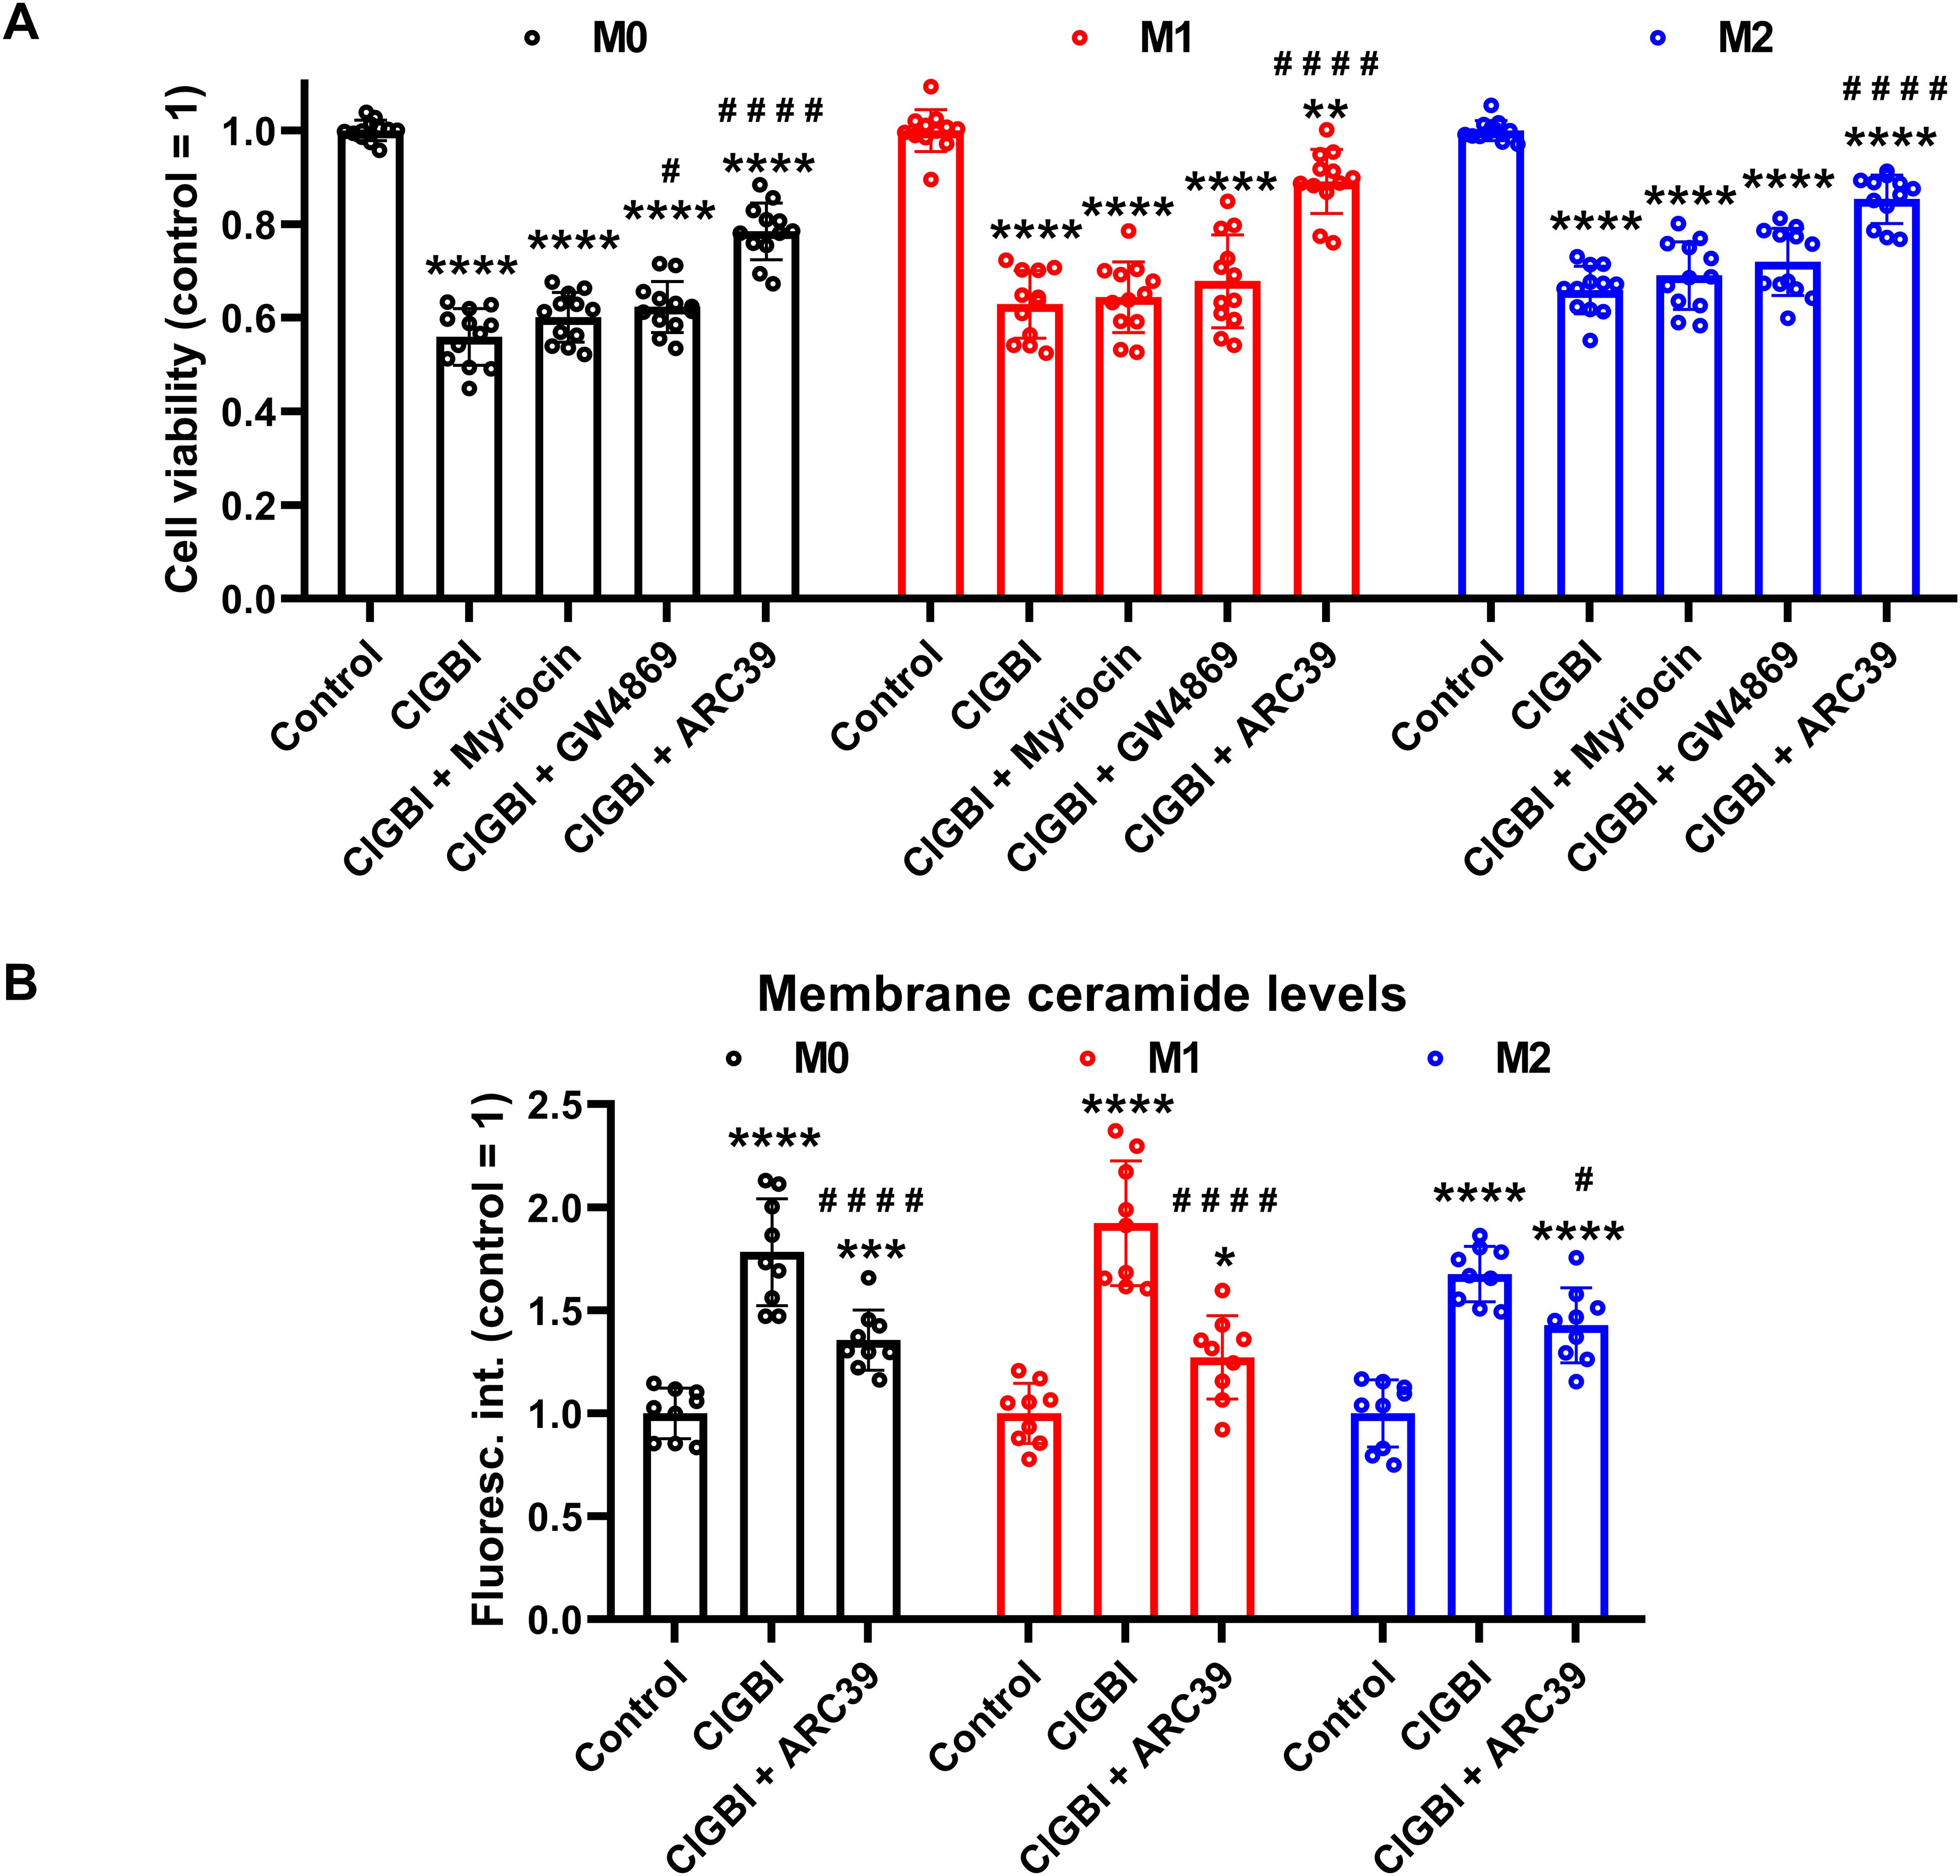
Figure 8. Protective effects of ceramide production inhibitors against the ClGBI-induced toxicity in polarized macrophages. (A) THP-1 cells were differentiated into macrophages for 24 h by 10 ng/ml PMA, which was followed by a 24-h resting period in the absence of PMA. The differentiated M0 macrophages were subsequently polarized for 24 h into classical M1 macrophages with 100 ng/ml LPS plus 20 ng/ml IFN-γ, or M2 macrophages using 20 ng/ml IL-4 plus 20 ng/ml IL-13. Cells were then pre-treated with 1 µM of the serine palmitoyltransferase inhibitor myriocin, 2 µM of the neutral sphingomyelinase blocker GW4869 or 5 µM of the acidic sphingomyelinase inhibitor ARC39 for 30 min, which was followed by a 24-h application of 100 µM ClGBI in M0 and M2 cells, or 50 µM ClGBI in M1 macrophages. After collecting cells in suspension and those detached by accutase, the macrophages were labeled with Sytox Green and Alexa Fluor 647-conjugated annexin V to identify necrotic and apoptotic cells, respectively. Fluorescence intensities of individual cells were measured using flow cytometry and the relative fraction of double negative viable cells was determined in each sample containing at least 10,000 cells, and normalized to the mean value determined in control untreated samples. The normalized live fractions obtained in n = 12 biological replicates, and their average values (± SEM) are plotted in the figure. Asterisks indicate significant differences compared to untreated, control samples (**p < 0.01, ****p < 0.0001), while hashes show that compared to cells treated only with ClGBI (#p < 0.05, ####p < 0.0001), which were determined by Tukey’s HSD test carried out after significant differences were obtained for between-group effects in ANOVA. (B) THP-1 cells differentiated, rested and polarized as above were pre-treated with 5 µM ARC39 for 30 min, which was followed by a 24-h application of 100 µM ClGBI in M0 and M2 cells, or 50 µM ClGBI in M1 macrophages. After accutase-mediated detachment and Fc receptor blocking, cells were labeled with anti-ceramide antibodies followed by AlexaFluor647-conjugated goat anti-mouse IgM antibodies. Fluorescence intensities of individual cells were subsequently measured using flow cytometry and the average fluorescence intensity of at least 10,000 cells of normal morphology per sample was determined. For each cell type, average fluorescence intensities of each sample were normalized to the mean value determined in the untreated, control sample. The normalized fluorescence intensity values obtained in n = 9 biological replicates, and their average values (± SEM) are plotted in the panel. Asterisks indicate significant differences compared to untreated, control samples (*p < 0.05, ***p < 0.001, ****p < 0.0001), while hashes show that compared to cells treated only with ClGBI (#p < 0.05, ####p < 0.0001), which were determined by Tukey’s HSD test carried out after significant differences were obtained for between-group effects in ANOVA.
4 DiscussionConsidering that HV1 inhibitors show great therapeutic promise in various human pathological conditions such as neuroinflammation and malignant diseases, understanding the effects of channel blockers exerted on the viability of macrophages with different polarization is of crucial importance regarding both the therapeutic effects and the potential side effects of these blockers. This study highlights that ClGBI, the most widely used inhibitor of HV1, compromises the viability of THP-1-derived polarized macrophages at concentrati
留言 (0)