
記住我

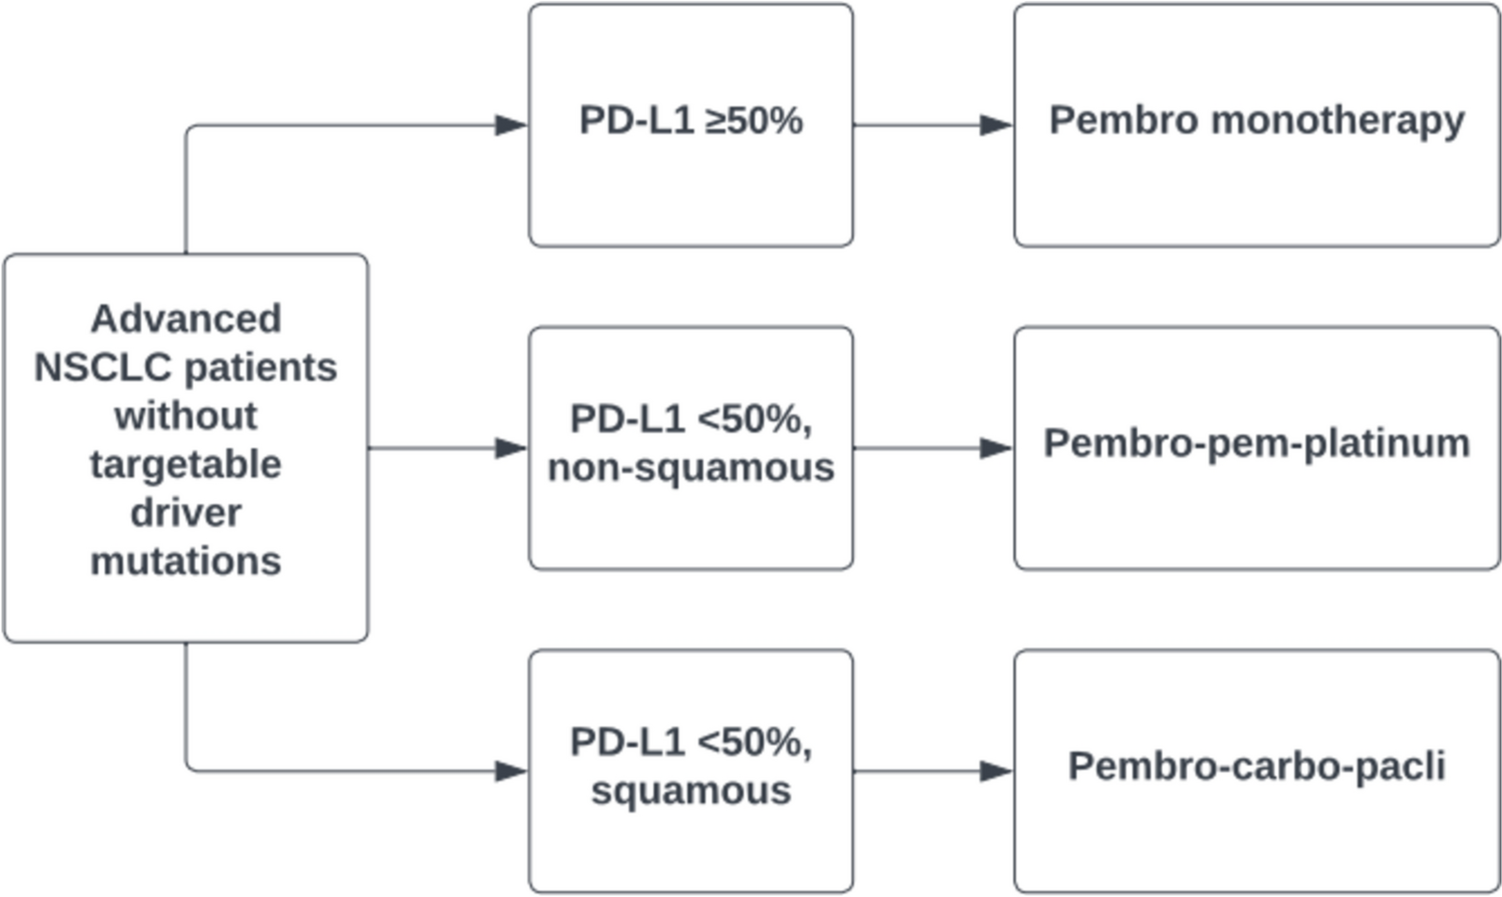


The population modelled in this study represents the CheckMate 227 (NCT02477826) Part 1 intention-to-treat (ITT) population in a US healthcare setting. This consisted of adults with stage IV or recurrent NSCLC who had received no previous systemic anticancer therapy for metastatic disease. Patients with squamous or non-squamous disease were eligible, but excluded if suitable for targeted therapy due to presence of sensitising EGFR mutations or ALK translocations. Patients were required to have an Eastern Cooperative Oncology (ECOG) performance status of 0 or 1, and were excluded in the presence of autoimmune disease, or untreated or symptomatic central nervous system metastases. The Part 1 population from the CheckMate 227 trial [14] modelled here comprised patients randomised to receive NIVO (3 mg/kg/2 weeks) + IPI (1 mg/kg/6 weeks) up to 2 years, or chemo (platinum doublet, every 3 weeks for 4 cycles). Patients were included regardless of tumour PD-L1 expression, as the benefits of NIVO+IPI were observed in both populations within CheckMate 227. Patient characteristics from CheckMate 227 were assumed to be representative of patients with previously untreated metastatic NSCLC eligible for systemic therapy in the US. This population allows results to be directly compared with that of Berling et al. [24].
2.2 Study DesignA mixture-cure economic model with health states defined by progression-free (LTR), progression-free (non-LTR), post-progression, and death was implemented in Microsoft Excel® (Office 365). At model initiation, all patients were in the progression-free states, with a fraction (\(\theta\)) in the LTR state and the complement in the non-LTR state. Patients in the LTR state transitioned to the death state at a pre-specified rate identical to the general population. Patients in the non-LTR state transitioned to the post-progression and death states at a rate compliant with the at-risk fraction of parametric mixture-cure models of PFS and OS. A schematic of the model structure is provided in Fig. 1.
Fig. 1
Model structure. The structure of the discrete-time Markov state transition model. Patients are initiated into the LTR or non-LTR progression-free states according to the LTR fraction \(\theta\). Patients in the LTR state progress to “Death” at an externally defined “baseline” rate of mortality. Patients in the non-LTR state progress to PD and Death at rates determined by the at-risk fraction of parametric mixture-cure models of overall survival and progression-free survival fitted to data from CheckMate 227. LTR long-term response, PD progressed disease
A 3-week cycle length was used, corresponding to the treatment cycle length for chemo. Half-cycle correction was employed for state-based cost and quality-adjusted life-year (QALY) aggregation, but was not used for first-line drug acquisition and administration costs, as these were incurred at the start of each model cycle. A lifetime time horizon (up to age 100 years) was applied. Adverse events related to first-line therapy, treatment-related adverse events (TRAEs), were assumed to occur over the first four model cycles. A summary of the core assumptions of the model is shown in Supplementary S1 (see the electronic supplementary material).
2.3 Mixture-Cure Survival AnalysisOS and PFS per Blinded Independent Central Review (BICR) data from the 5-year database lock of CheckMate 227 were used to fit parametric mixture-cure survival models. In these models, all patients were considered at a baseline hazard of general population mortality informed by contemporary general population life tables stratified by country of study centre and patient sex and age. In scenario analyses, hypothesised mortality ratios were applied to these hazards in order to represent a residual excess hazard of mortality amongst the LTR. In addition to this hazard, an unidentified at-risk (non-LTR) fraction was assumed to experience an additional parametrically defined hazard. Maximum likelihood parameters defining this non-LTR hazard function and the proportion within the LTR fraction were sought via optimisation within the flexsurvcure package [30] within the R statistical environment [31].
A non-mixture-cure survival analysis was considered, in which the cure fraction is approached according to an exponential asymptotic model scaling a standard cumulative distribution function [32]. However, this study derives extrapolative validity from the assumption of similarity of survival time distributions in the fraction without LTR with a standard parametric distribution. This contrasts with the assumption of continuity of a hazard function representing an improper statistical distribution, as used for extrapolation of non-mixture survival models, and represents a class of models more similar to those suggested as the defaults in model selection guidelines [33].
In all survival approaches, the parametric analysis was conducted in reference to Decision Support Unit (DSU) guidance, Technical Support Document 14 [33], and implementation of mixture-cure and relative survival modelling was considerate of the recommendations of Technical Support Document 21 [34]. As the objective of this study was to employ a mixture-cure modelling strategy to explain heterogeneity in survival times, it was known that the resultant models would not display marginal proportional hazards (PHs) or the accelerated failure time (AFT) property, as all models would asymptotically converge to the baseline (general population) hazard. However, it was considered that such scaling rules may be appropriate for the non-LTR fraction, and three model structures were explored:
In the fully independent structure, all parameters were free to vary dependent upon treatment arm.
In the shared non-LTR structure, the LTR fraction varied dependent upon treatment; the non-LTR fraction risks were independent of treatment arm.
In the scaled non-LTR structure, the LTR fraction was free to vary dependent upon treatment, and the non-LTR fraction was in a PH or AFT relationship dependent upon treatment arm.
Several models were considered for the representation of survival among the non-LTR fraction, i.e. the exponential, Weibull, Gamma, Gompertz, lognormal, log-logistic, and generalised Gamma models. Model fit was assessed for each model using plots of the predictions versus observations (hazard rates, cumulative hazard rates, survival rates), Akaike information criterion (AIC), and Bayesian information criterion (BIC) statistics. The face validity of survival predictions was determined by comparison of results to the existing cost-effectiveness model and a comparison of estimates to an existing conditional survival curve derived from published literature (supplemental materials of [24]).
Choice of the outcome (OS, PFS) defining the LTR fraction imposes a restriction on the LTR fraction of the other outcome, as the model structure precludes a long-term post-progression state. This decision was made in order to allow for subsequent modelling of indirect comparators for which patient-level data were unavailable. As such, to ensure good calibration to observed data, after selection of the LTR-determining outcome, the other outcome was fitted using the defining model LTR fraction. In the base case, OS was chosen as the LTR-determining outcome as fitting to PFS resulted in consistent under-prediction of OS on the NIVO+IPI arm from approximately 2 years.
As mixture-cure survival models trend asymptotically towards the baseline hazard, the absolute difference in hazards between NIVO+IPI and chemo was constrained to demonstrate a decreasing treatment effect in both PFS and OS. As this rate of loss of treatment effect was driven by trends in the CheckMate 227 data, and as previously used assumptions such as those in National Institute for Health and Care Excellence (NICE) technical assessment 724 [35] required an implausible loss of treatment effect within the observed period of CheckMate 227, this was considered the most plausible expression of a loss of treatment effect practicable within the model.
2.4 UtilitiesValues are detailed in Supplementary S2 (see the electronic supplementary material). The utility in the LTR state was assumed to be equivalent to the general population according to US population norms [36]. Utility values applied in the non-LTR states of the model were estimated using an analysis of EQ-5D-3L data from CheckMate 227, using US preference weights for the progression-free and progressed-disease states [24]. Mixed model regression methods were used to estimate both progression-based and time-to-death (TTD)-based utility values. These models were consistent with those used by Berling et al. [24] to isolate the impact of the survival modelling strategy on the cost-effectiveness results. A scenario analysis setting LTR utility equal to PFS utility was run; as general population utility was only 2% greater than PFS utility, this had a minor impact on the incremental cost-effectiveness ratio (ICER). Disutility due to TRAEs was applied uniformly over the first 12 weeks, i.e. assuming 25% of incidence during each 3-week cycle up to the expected end of chemo. An end-of-life disutility based upon observations from CheckMate 227 was applied.
2.5 CostsThis study adopted a US third-party payer perspective to align with other previously published non-mixture-cure survival analyses [24, 25]. The model considered direct healthcare costs including drug-acquisition and drug-acquisition-cost modifiers (Supplementary S3 and S4; see the electronic supplementary material), drug administration costs (Supplementary S5), drug monitoring costs (Supplementary S6), subsequent systemic therapy costs (Supplementary S7), drug cost of resolving TRAEs (Supplementary S8), and disease management costs (progression-free and progressive disease health states and end-of-life care; Supplementary S9 and S10). All unit costs were based on US-specific costs (2021 dollars, inflated where required using the US medical care consumer price index) [37]. Resource use estimates and costing year were matched with an existing cost-effectiveness analysis of NIVO+IPI based on CheckMate 227 to allow comparison of results [24]. Annual discount rates of 3.0% have been applied to all costs and health benefits, as recommended by the US Institute for Clinical and Economic Review [27]. Baseline hazards were calculated from US general population life tables [28]. A willingness-to-pay threshold of US$150,000/QALY was assumed [29].
Acquisition, administration, and monitoring costs of first-line treatment were estimated based upon duration of study treatment recorded in CheckMate 227. These costs have been aggregated in the progression-free non-LTR state. For NIVO+IPI, a per-cycle cost was calculated and was assumed to apply to all patients remaining on first-line treatment until a maximum of week 108, the maximum time on treatment observed in CheckMate 227.
For chemo, an initial per-cycle rate of cost aggregation was calculated, weighted based upon the treatment mix among the ITT population, and applied to all patients on first-line treatment for the first four model cycles (i.e. until week 12). After this point, all patients remaining on therapy for the duration of study records of CheckMate 227 were assumed to be receiving maintenance treatment in the form of the chemo agent pemetrexed. Costs were subsequently aggregated according to this schedule until the end of CheckMate 227 follow-up (i.e. until week 246). Wastage was assumed for each dose of each treatment based upon mean patient weight and body surface area in CheckMate 227; these values are consistent with other cost-effectiveness analyses using alternative survival modelling techniques, but it is noted that the mean patient weight may be lower than that expected in a US cohort, and usage of the method of moments would be expected to improve accuracy of wastage calculations [38].
In addition to first-line treatment-related costs, costs due to TRAEs were aggregated over the first 12 weeks of the model. State-specific disease management costs were accrued in the progression-free and progressed-disease states, and a terminal care cost applied upon transition from any state to the death state. Upon transition to the progressed-disease state, patients were assumed to have a chance of commencing a subsequent therapy line, informed by the distribution of subsequent systemic therapies used by patients in CheckMate 227, shown in Supplementary S7. The weighted mean cost of an average treatment course with these therapies, reduced to the proportion observed commencing any subsequent systemic therapy, was applied at the time of progression to all patients. A majority of chemo patients receiving subsequent therapy received nivolumab or pembrolizumab, whilst re-challenge with immunotherapy was less common for NIVO+IPI. As a result, chemo has a higher per-patient subsequent treatment cost, but the efficacy of subsequent-line immunotherapy is reflected in the OS outcomes of CheckMate 227.
Due to missed or reduced doses, there was a lower mean dose intensity for each component of treatment in CheckMate 227 than that predicted by the complete duration of study therapy. To compensate for this reduction in effective resource use, an overall mean relative dose intensity, the ratio of observed exposure to expected exposure for each treatment component in the clinical trial, was applied to the acquisition costs of each therapy (Supplementary S4). A no-wastage assumption was made on missed or reduced doses, and sensitivity to this was tested in a scenario analysis.
2.6 Treatment-Related Adverse EventsThe incidence rate of TRAEs was informed by safety analysis of the CheckMate 227 Part 1 safety population, with adverse events of neutropenia, anaemia, neutrophil count decrease, thrombocytopenia, and febrile neutropenia incurring costs and loss of health-related quality of life within the model. The majority of events occurred over the first 12 months of the trial, but within this economic evaluation were assumed to accrue uniformly over the first 12 weeks for both arms. The pre-maintenance treatment period for chemo and the assumed compression of TRAEs for NIVO+IPI were assumed in this 12-week window, and would provide no discounting benefit to the latter therapy. This was considered a conservative assumption.
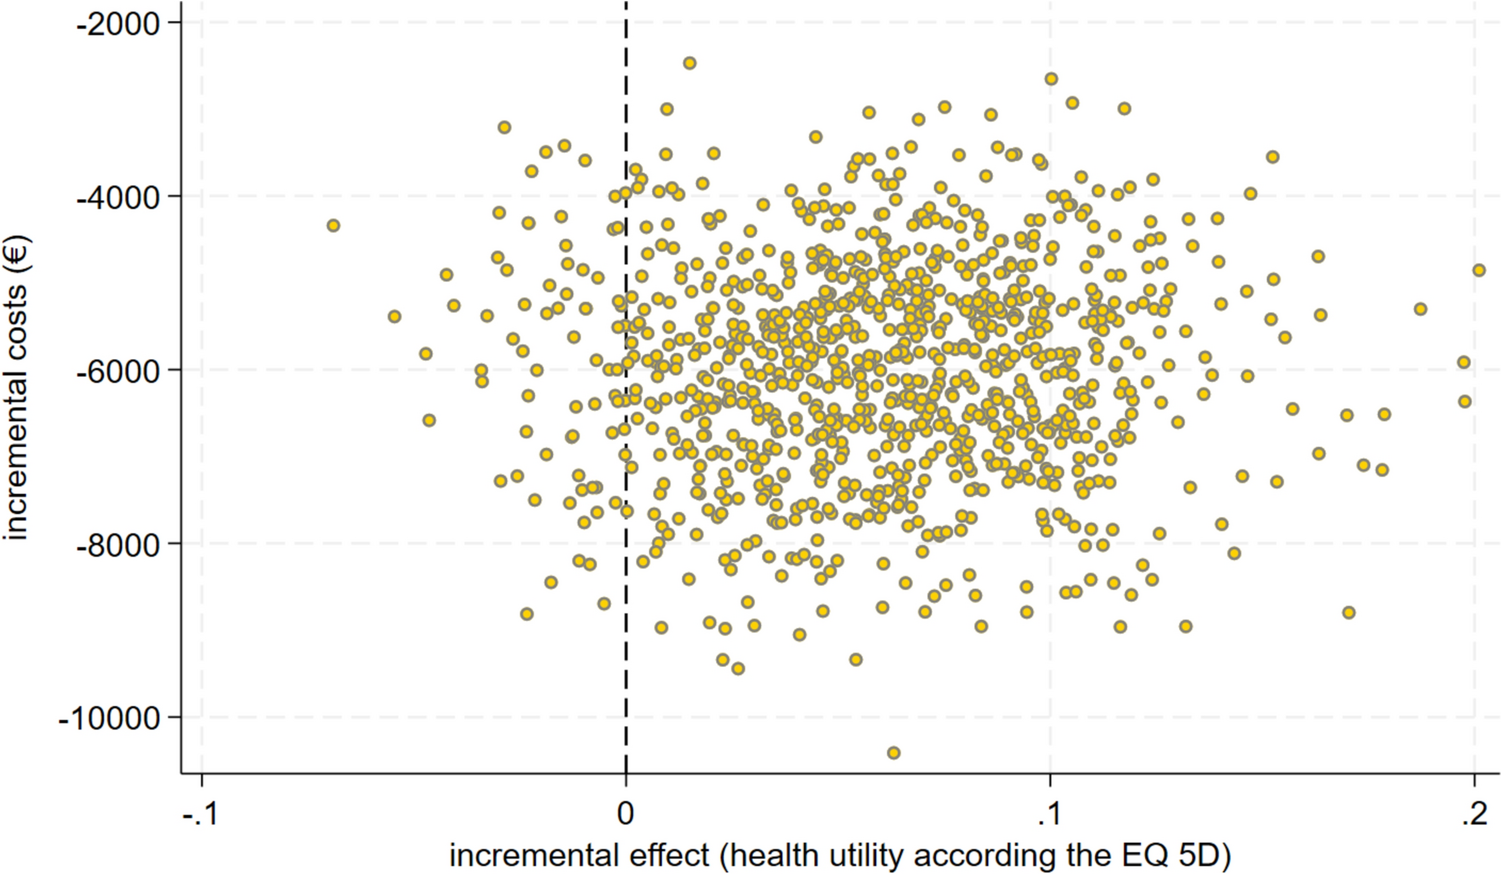
2.7 Uncertainty and SensitivityDeterministic sensitivity analyses were conducted to assess the impact of individual parameters on results, detailed in Supplementary S11 (see the electronic supplementary material). In addition, a number of scenario analyses were conducted to assess the impact of modelling decisions, such as the survival distribution, baseline hazard of mortality, and utility model. Finally, probabilistic sensitivity analysis (PSA) was conducted, varying the majority of uncertain parameters simultaneously.
Due to the linking PFS and OS LTR fraction and the expected failure of the multivariate normal assumption for parameters of the survival models, a non-parametric bootstrap was used to generate 1000 linked parameter estimates for the PFS and OS models, which were resampled in PSA.
留言 (0)