
記住我
Colorectal cancer (CRC) is a common malignant tumor of the gastrointestinal tract, and the global morbidity and mortality of CRC rank third and second among all cancers, respectively (1). According to Cancer incidence and mortality in China, 2022, China is inflicted with a high incidence of CRC, and its morbidity and mortality rank second and fourth among all malignant tumors, respectively (2). Contributors to CRC include gender, genetic factors, and family factors in addition to smoking, obesity, and poor lifestyle (3). Currently, CRC is usually diagnosed by laboratory tests, endoscopy, imaging, and histopathology, and treated with endoscopy, surgery, radiotherapy, chemotherapy, targeted therapy, and immunotherapy (4). Despite these diagnostic and treatment technologies, CRC is till prevalent in China, as shown by its continuous increase in morbidity and mortality in men during 2014-2018 (2). Artificial intelligence (AI) is revolutionizing the diagnosis and treatment of CRC, as shown by the advances in high-precision medical image analysis, endoscopic data processing, and digital pathology assessment, as well as personalized treatment and robot-assisted surgery. AI also help to better allocate and utilize medical resources and healthcare services (5–9).
Bibliometrics is a cross-cutting science that uses mathematical and statistical tools to quantitatively analyze scientific literature and provides standardized evaluation criteria to reduce subjective bias compared to traditional review studies (10). It can help researchers quickly understand the classic literature and core authors in a certain field as well as the research hotspots and development trends, in order to enhance the research efficiency and assist scientific research decisions (11, 12).
Recent years have witnessed an increasing number of studies related to the application of AI in CRC diagnosis. However, very few researchers have used bibliometric methods to systematically analyze studies in this area. In the only few bibliometric studies on related topics, they all focus on the analysis of the basic status of the research, without a detailed and extended analysis of the current research hotspots and future research trends (13, 14). Based on the Web of Science (WoS) core collection database, the present bibliometric study uses Cite Space (15), VoSviewer (16), Bibliometrix (17) to analyze the status quo, hotspots, and trends in the research of AI-related CRC diagnosis or treatment during 2004-2023, aiming to provide new ideas and clues for related research work.
2 Materials and methods2.1 Data sources and search strategyThe WoS is the most comprehensive, systematic, and authoritative database available for bibliometric analysis, due to its rich bibliometric indicators and inclusion of high-quality journals from around the world (18). The data included in this study were obtained from the Web of Science Core Collection (WoSCC) database (https://www.webofscience.com/wos/woscc/basic-search). The search was conducted on January 31, 2024. Our search topic was divided into two parts, technical terms and disease terms, and for a broader search, we looked for relevant synonyms in the Pubmed MeSH Database and referred to recent bibliometric studies related to AI (19) or colorectal cancer (20) to finalize the following search formula: TS=(Rectal Neoplasm* OR Rectal Tumor* OR Rectal Cancer* OR Rectum Neoplasm* OR Rectum Cancer* OR Cancer of the Rectum OR Cancer of Rectum OR Colorectal Neoplasm* OR Colorectal Tumor* OR Colorectal Cancer* OR Colorectal Carcinoma* OR Colonic Neoplasm* OR Colon Neoplasm* OR Cancer of Colon OR Colon Cancer* OR Cancer of the Colon OR Colonic Cancer*) AND TS=(artificial intelligence OR Computational Intelligence OR machine learn* OR deep learn* OR artificial neural network OR machine intelligence).In the filtering function of the WoSCC database, we have set it so that only studies published as “article” and “review” and in “English” from January 1, 2004 to December 31, 2023 were screened. The process of literature screening is shown in Figure 1. A total of 2,715 articles were finally included, and the complete records of these articles (including title, authors, sources, abstracts, references, etc.) were exported in “download_txt” format for subsequent analysis.
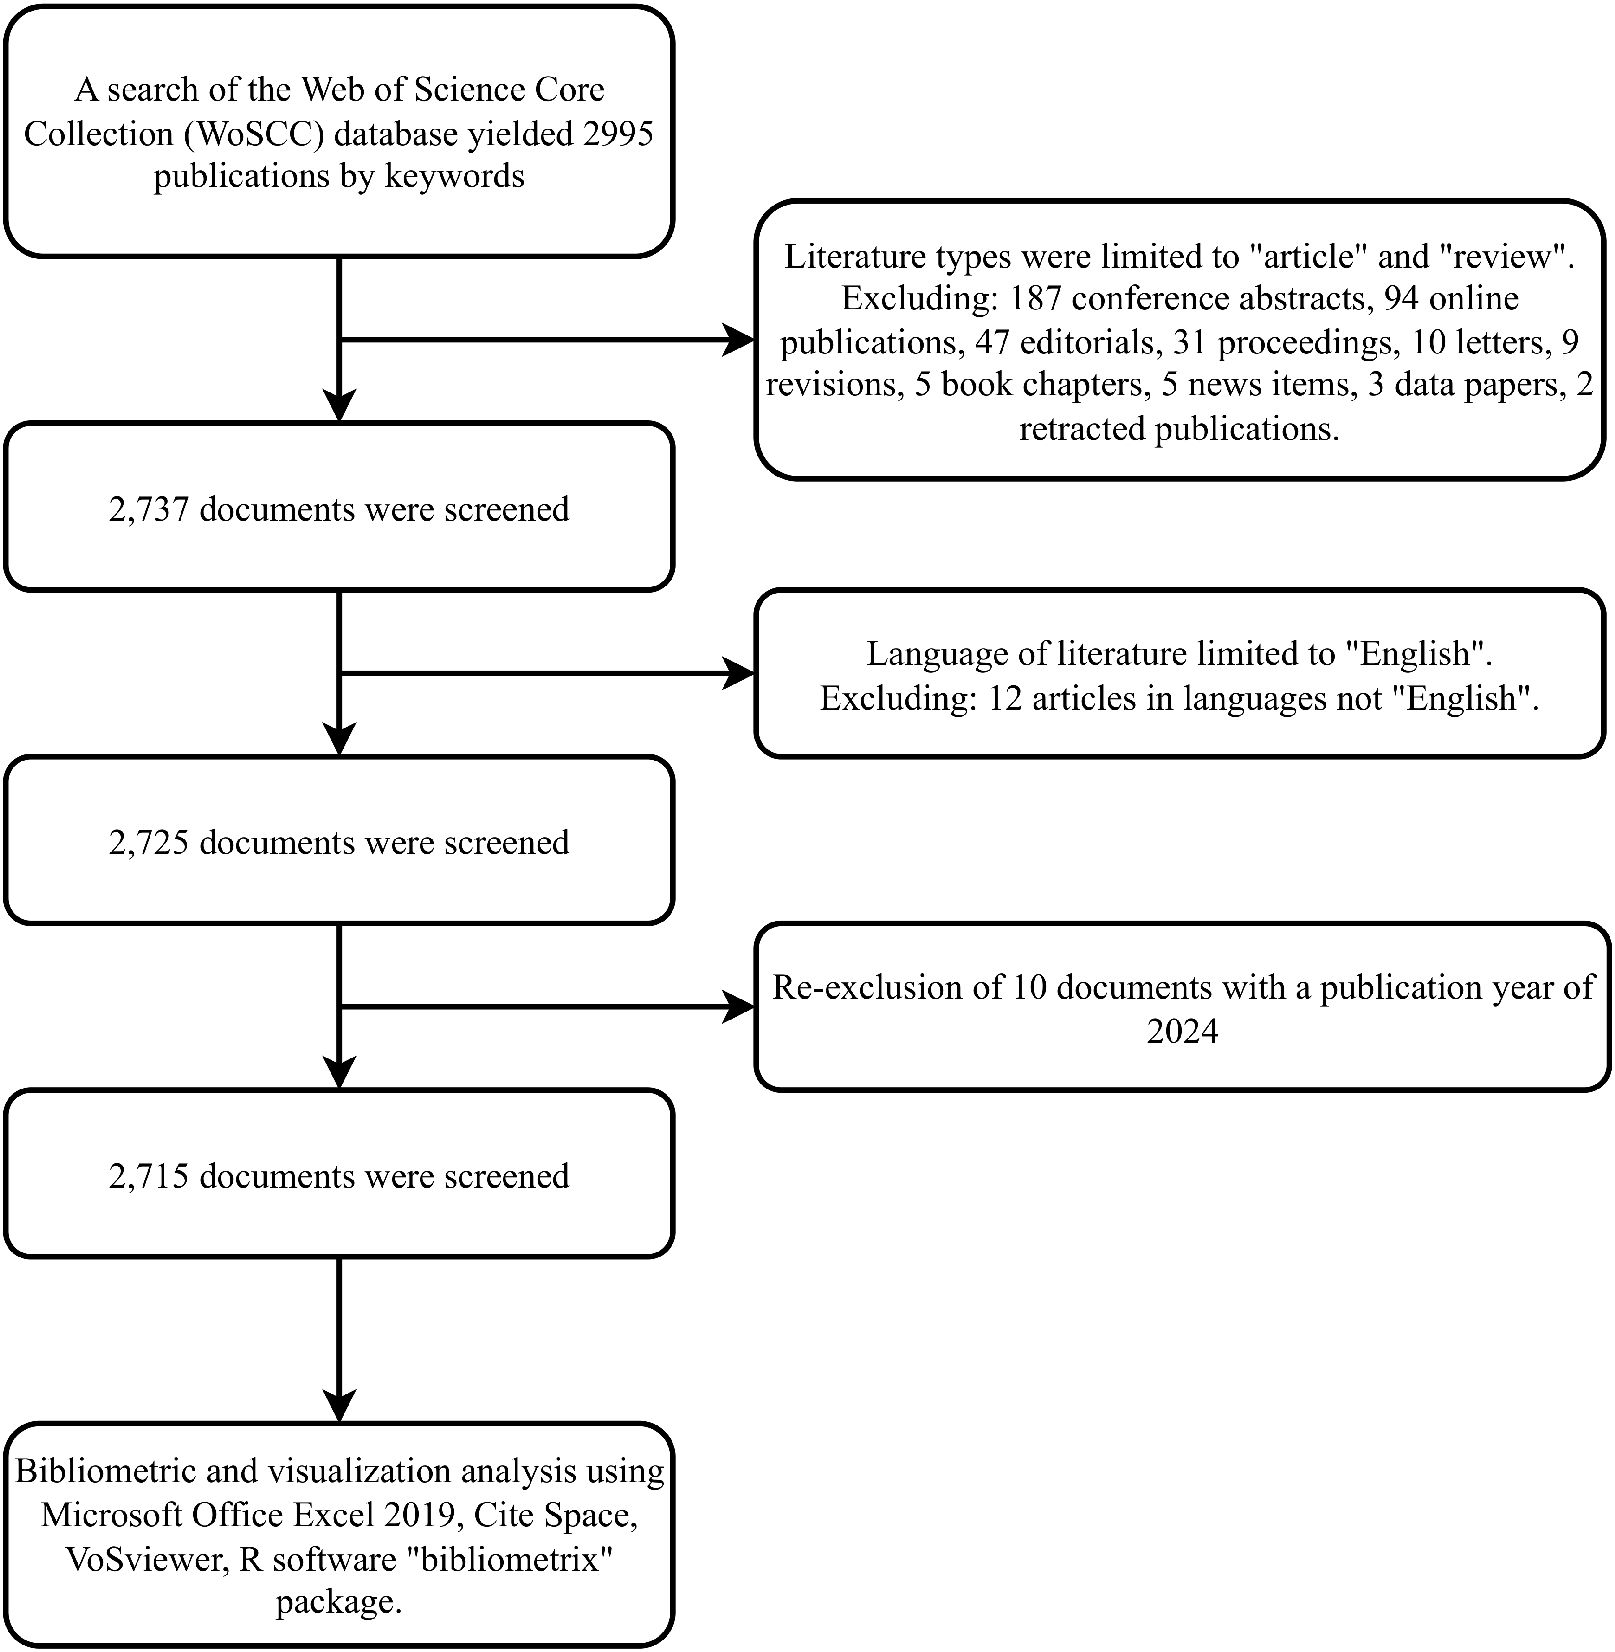
Figure 1. Flowchart of literature screening.
2.2 Methods of statistical analysisMicrosoft Office Excel 2019 was used to draw the infographics of the annual publication volume and the descriptive tables of various types of data. VOSviewer (v.1.6.20) was used to carry out co-authorship and co-occurrence network analyses among countries (regions), institutions, authors, and journals. High-frequency co-cited literature, highly cited literature, and keywords were presented through network visualization, overlay visualization, and density visualization. Journal biplot overlays, co-cited literature clusters, keyword clusters, and timeline plots of keyword clusters were plotted using CiteSpace (v.6.3.R1 64-bit advanced) and combined with citation databases for literature analysis. Thematic trend analysis of keywords was run on the Bibliometrix (v4.1.4) based on R software (v4.3.2). The changes of research hotspots over time in this research area were visualized.
3 Results3.1 General information about the dataA total of 2715 records were searched out of the WoS and imported into the Bibliometrix. The overall situation is shown in Table 1.
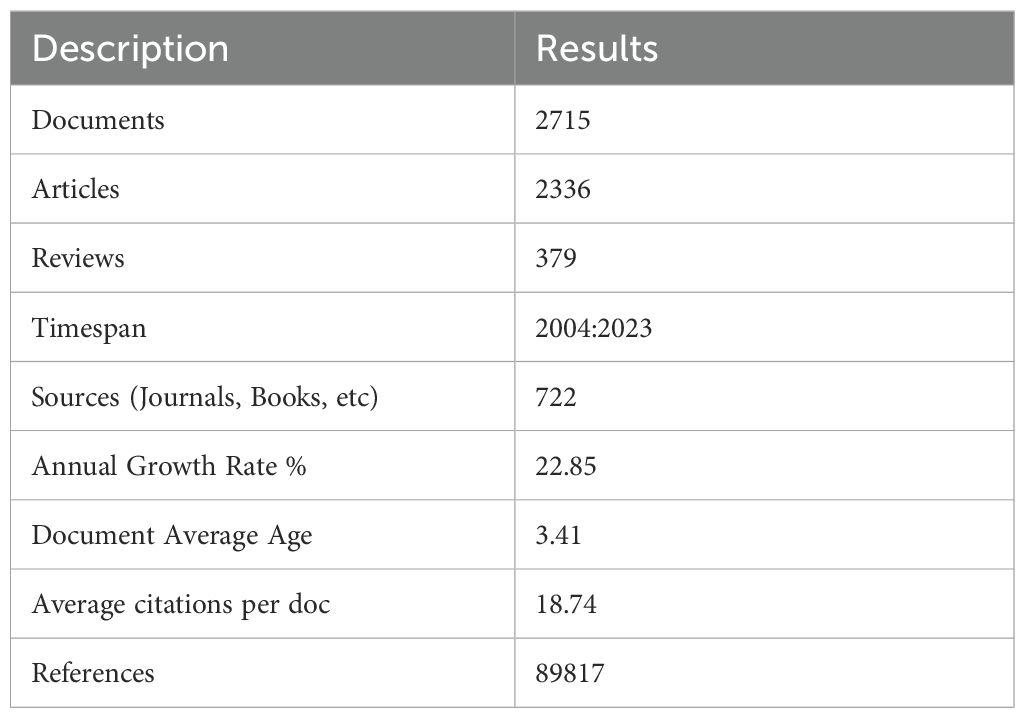
Table 1. Basic data information.
3.2 Analysis of the annual volume and its changing trendThe annual numbers of articles were imported into Microsoft Office Excel 2019 to plot the trend of this index (Figure 2). It showed that the annual number of articles grew slowly, and never exceeded 50 before 2016, but rapidly after 2017, especially between 2020 and 2023, till to a peak of 798 in 2023.
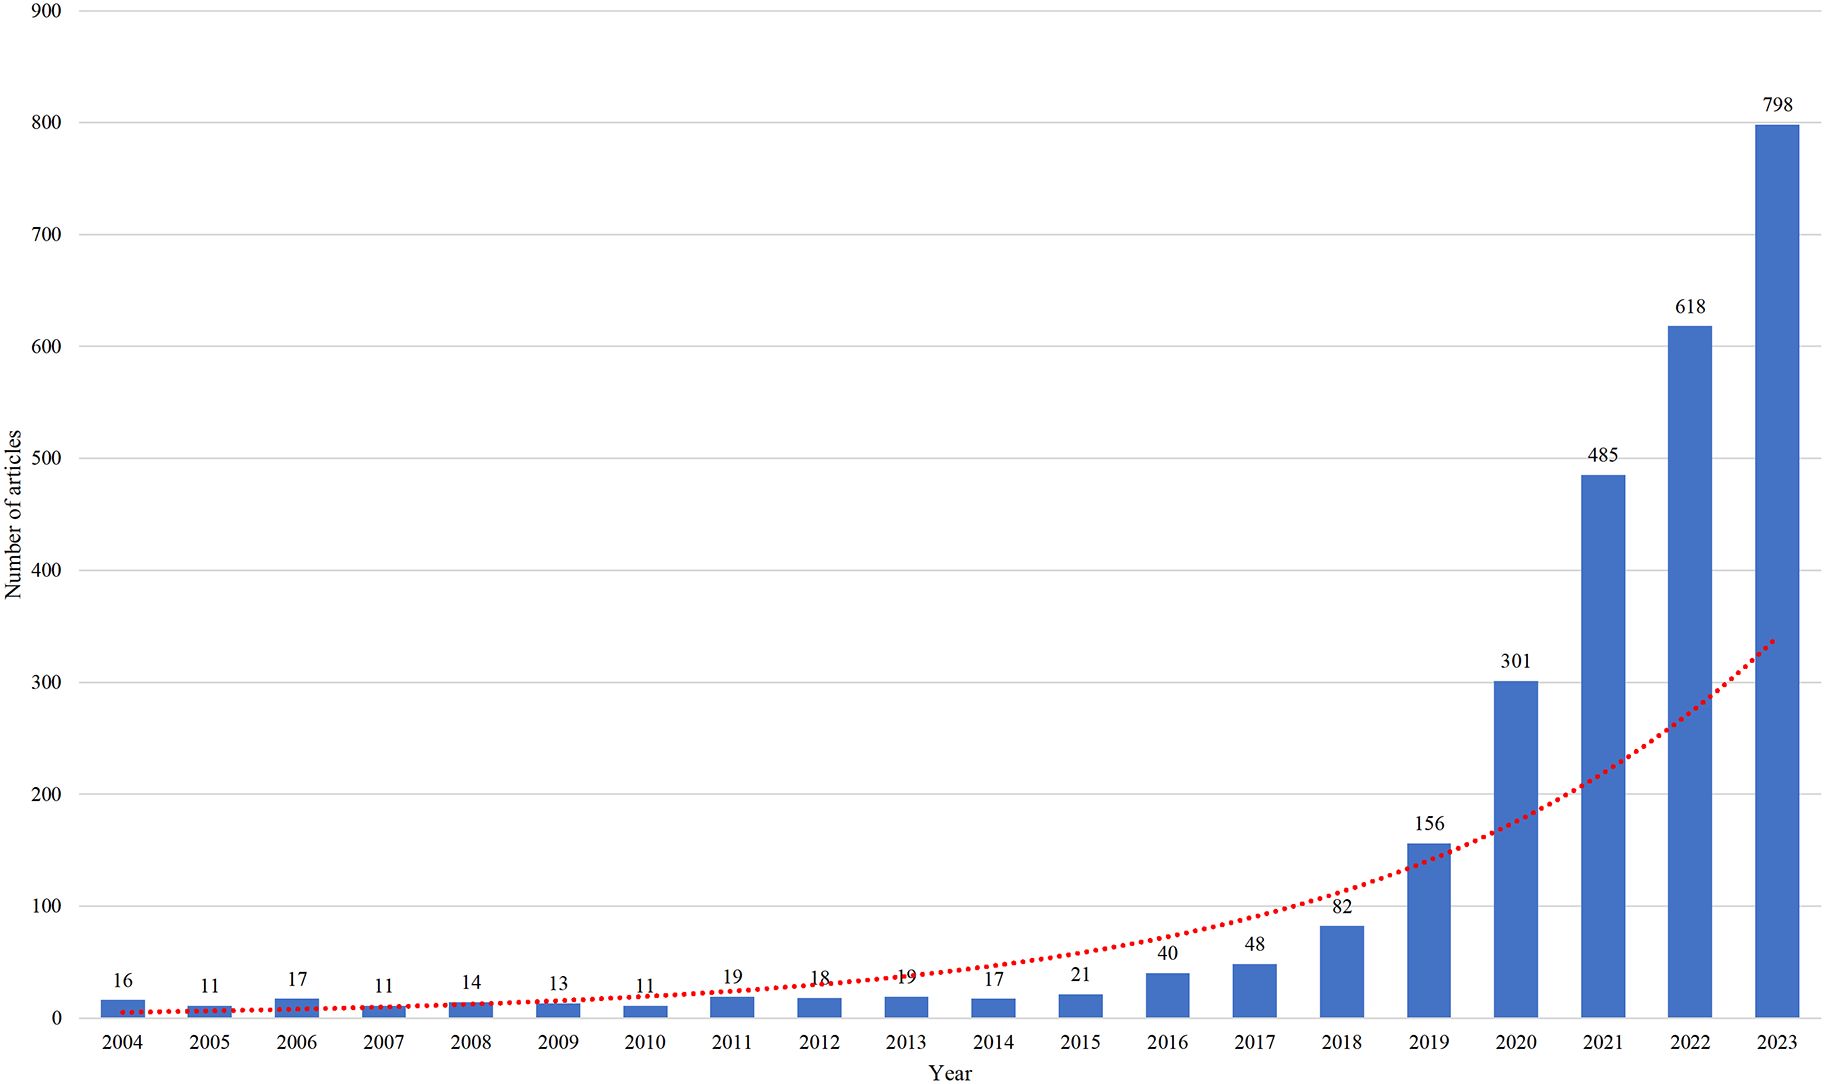
Figure 2. Trend in the annual number of articles published.
3.3 Analysis of countries (regions)The analysis of VOSviewer software showed that a total of 92 countries contributed to the research on AI in CRC diagnosis and treatment. The top 10 countries with the most publications are listed in Table 2, in which China ranked the first with 927 articles, the USA second with 658 articles, and the UK third with 240 articles. Although the USA took the second place in the total number of publications, its total number of citations reached 21,532 (the largest in the world) and average number of citations reached 32.7234, which indicates that the USA has a significant influence in this research field.
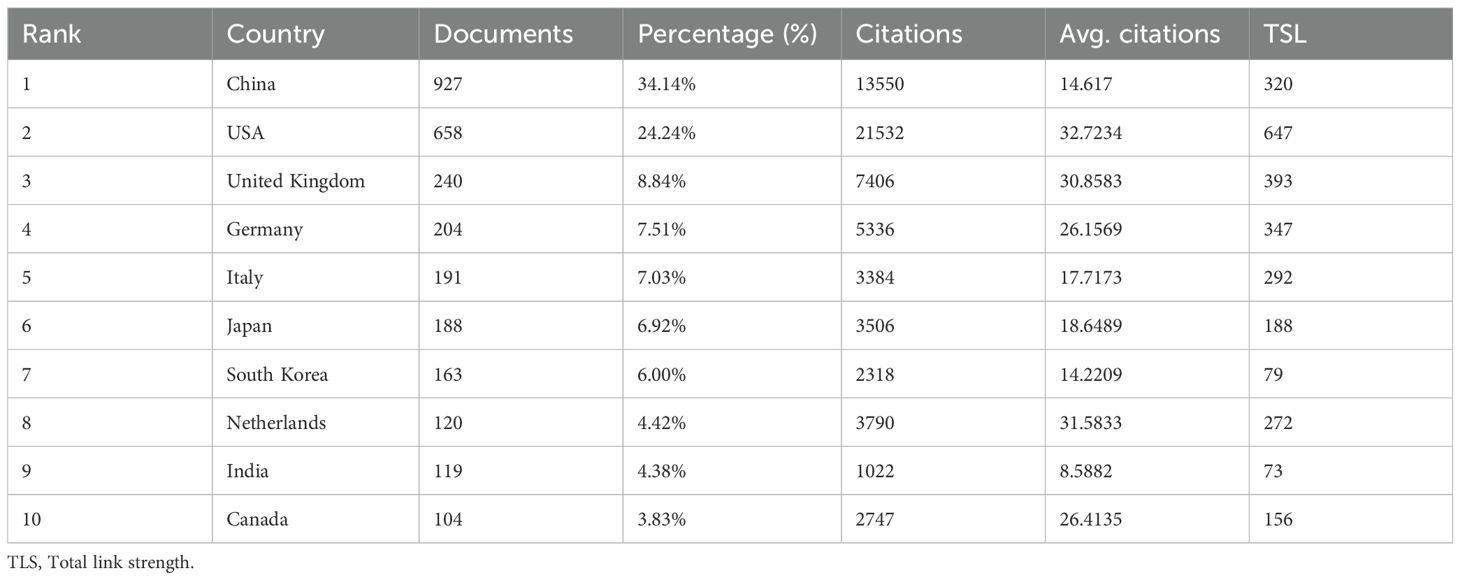
Table 2. Top 10 countries (regions) by number of publications.
In addition, the average numbers of citations in the Netherlands (31.5833), the United Kingdom (30.8583), Canada (26.4153), and Germany (26.1569) were also relatively high, which may imply that the studies in these countries are generally of high quality. It is particularly noteworthy that although Sweden only ranked 17th in the number of publications (47 in total), its average number of citations was as high as 41.2128, which ranked the first among all the countries, implying that the quality of the research results in Sweden is high.
Using the VOSviewer software, we performed a collaborative network mapping for the 32 countries with at least 20 publications (Figure 3), showing that international collaborations had appeared among a wide range of countries or regions in North America, Europe, and Asia, with the United States, the United Kingdom, Germany, China, and Italy as top centers.
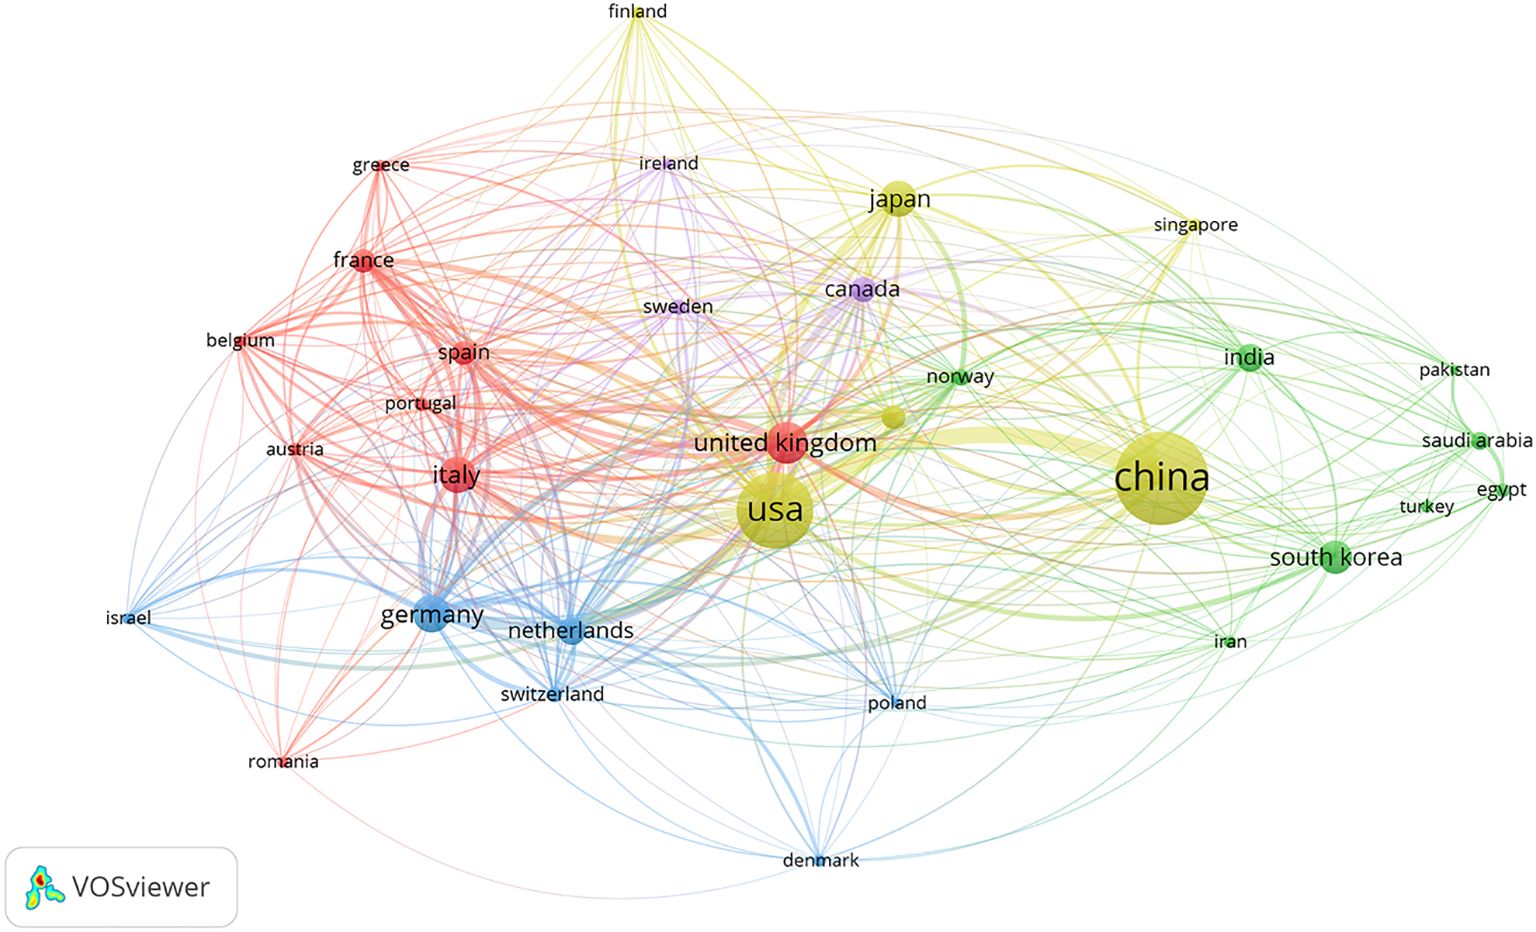
Figure 3. Networks of collaborations among countries (regions). Nodes indicate countries (regions); the size of nodes indicates the number of articles; a larger node indicates a larger number of articles; the color of nodes indicates the cluster to which the country (region) belongs; the line between nodes indicates the existence of an international collaboration; a thicker line indicates a closer collaboration.
3.4 Analysis of organizationsAccording to the results from the VOSviewer software, a total of 3,997 organizations have participated in the research on AI in CRC diagnosis and treatment. Table 3 lists the top 10 organizations having published the most publications, in which Sun Yat-sen University ranked the first (70 articles), followed by Fudan University (53 articles), Chinese Academy of Sciences (51 articles), Harvard Medical School (50 articles), and Zhejiang University (50 articles). Among these top 10 institutions, Harvard Medical School had the most total citations (2,362), followed by the Chinese Academy of Sciences (1,707) and Sun Yat-sen University (1,313).
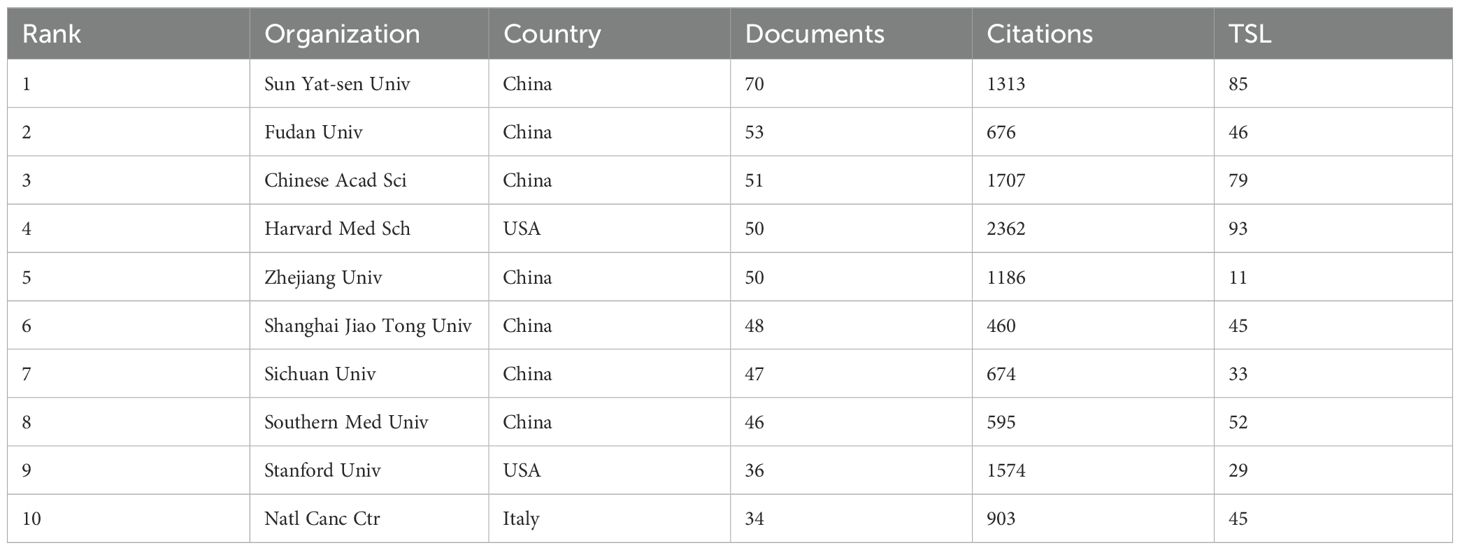
Table 3. Top 10 organizations in terms of number of articles issued.
It is worth noting that although Mayo Clinic did not enter the top 10 in the number of publications (25), its total number of citations was as high as 3,662, topping all other institutions, indicating that its research quality was the highest.
In addition, a network involving 71 organizations having published at least 15 articles was constructed by the VOSviewer software (Figure 4). There were strong links between several institutions. The top five in TSL (Total Score Length) included the University of Oslo, Harvard Medical School, Sun Yat-sen University, Chinese Academy of Sciences, and Showa University, reflecting their leadership and influence in the research on AI in CRC diagnosis and treatment.
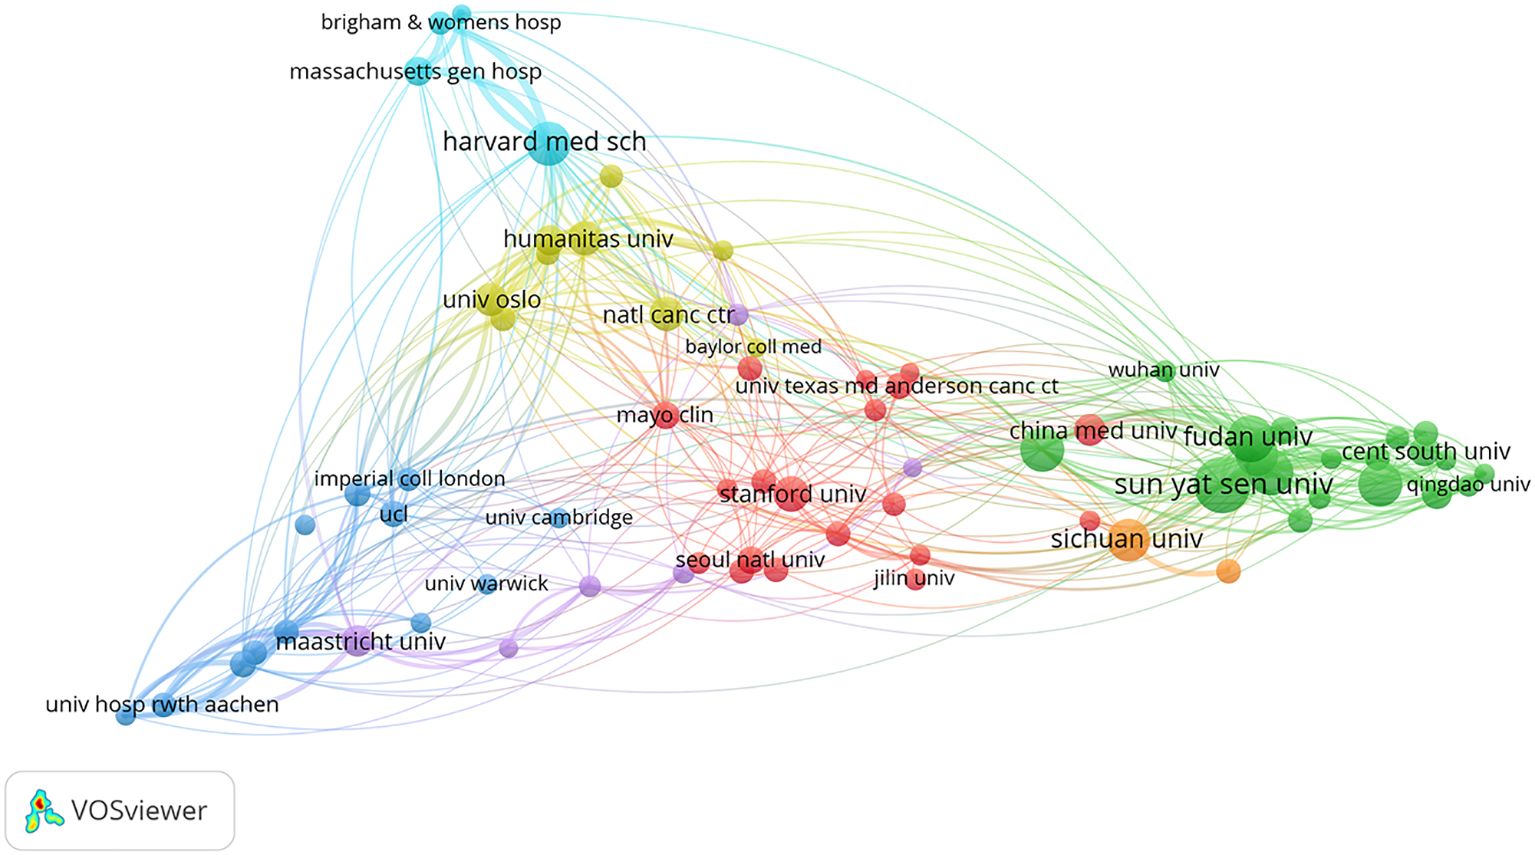
Figure 4. Mapping of inter-agency collaborative networks. Nodes represent organizations; the size of nodes indicates the number of publications; a larger node indicates a larger number of publications; the color of nodes indicates the cluster to which the organization belongs; the line between nodes indicates the existence of collaboration; a thicker line indicates a closer relationship.
3.5 Analysis of authorsThe results from the VOSviewer software showed that a total of 15,667 authors were involved in the research on AI in CRC diagnosis and treatment. As shown in Table 4, the top three authors with the most publications in this field were MORI, YUICHI (23), followed by REPICI, ALESSANDRO (20), and HASSAN, CESARE (18). As for the total number of citations, the top three authors were WANG, PU (10 articles with 1101 citations), BERZIN, TYLER M. (9 articles with 1088 citations) and KATHER, JAKOB NIKOLAS (17 articles with 1077 citations).
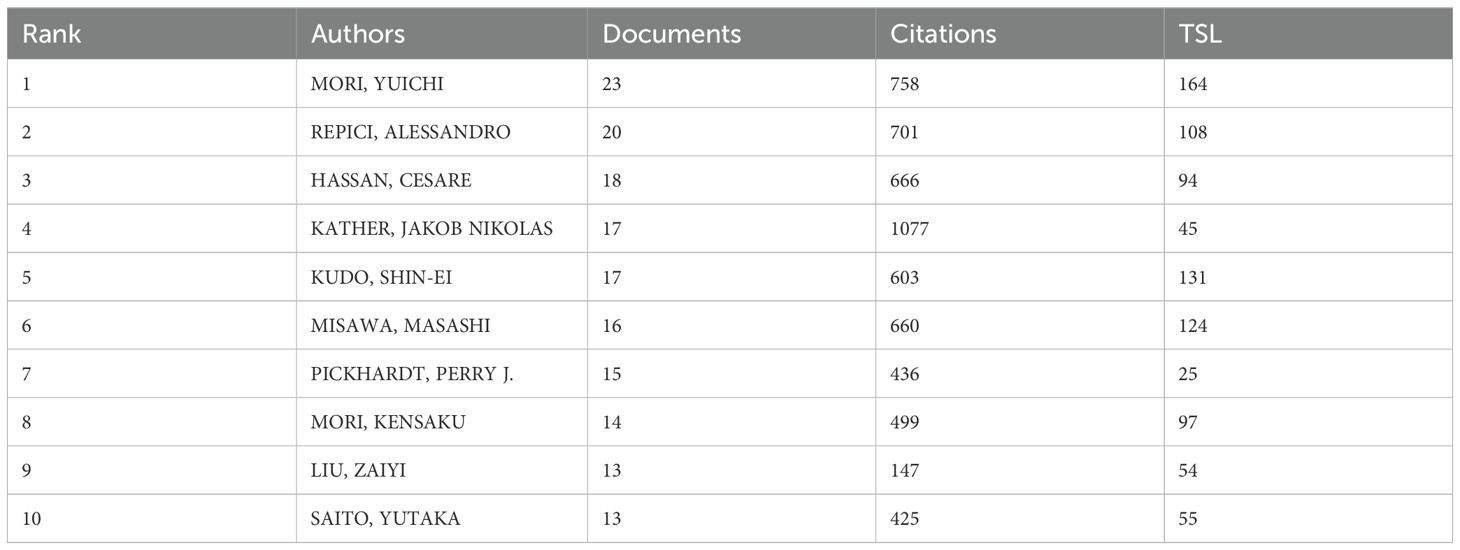
Table 4. Top 10 authors in terms of number of articles published.
In the VOSviewer software, a network of 234 authors with at least 5 publications was constructed (Figure 5), showing intense mutual collaborations between these authors. In this collaborative network, the top five authors in terms of TSL (Total Score Length) included MORI, YUICHI, KUDO, SHIN-EI, MISAWA, MASASHI, REPICI, ALESSANDRO, and MORI, KENSAKU, which indicated that they play more important roles in the collaborative network in this research area.
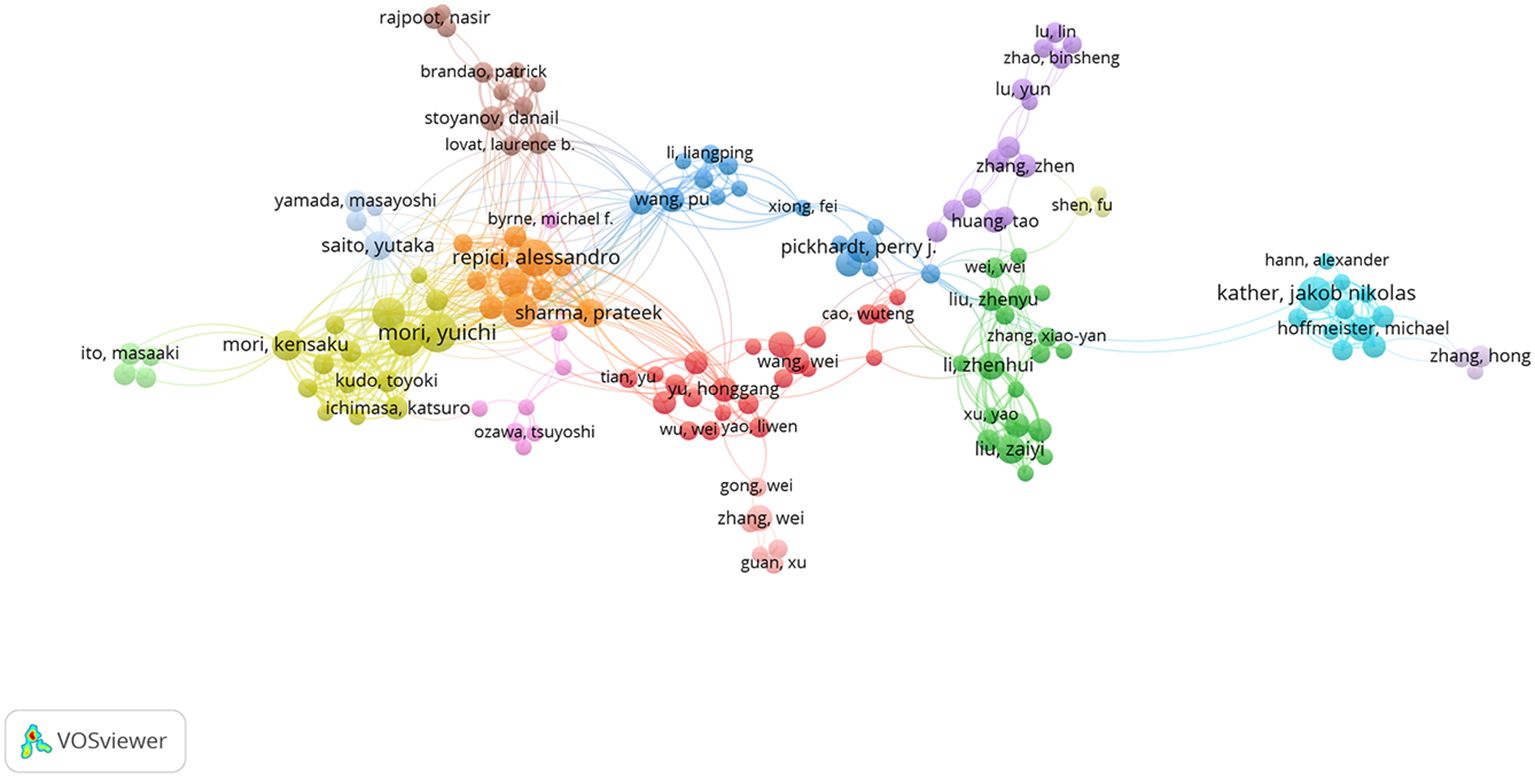
Figure 5. A network of inter-author collaborations. Nodes indicate authors; the size of nodes indicates the number of publications; a larger node indicates a larger number of publications; the color of nodes indicates the cluster of institutional authors; the line between nodes indicates the existence of an inter-author collaboration; a thicker line indicates a closer relationship.
3.6 Analysis of journals and co-citationsThrough the results from the VOSviewer software, we found that a total of 722 journals had published research on AI in CRC diagnosis and treatment. Among them, Cancers published the largest number of articles (110 articles). In terms of the number of citations, IEEE Transactions On Medical Imaging led with 3232 citations. Table 5 provides details of the top 10 journals in the number of articles published, where Computers In Biology And Medicine carried the highest impact factor of 7.7 in 2022.
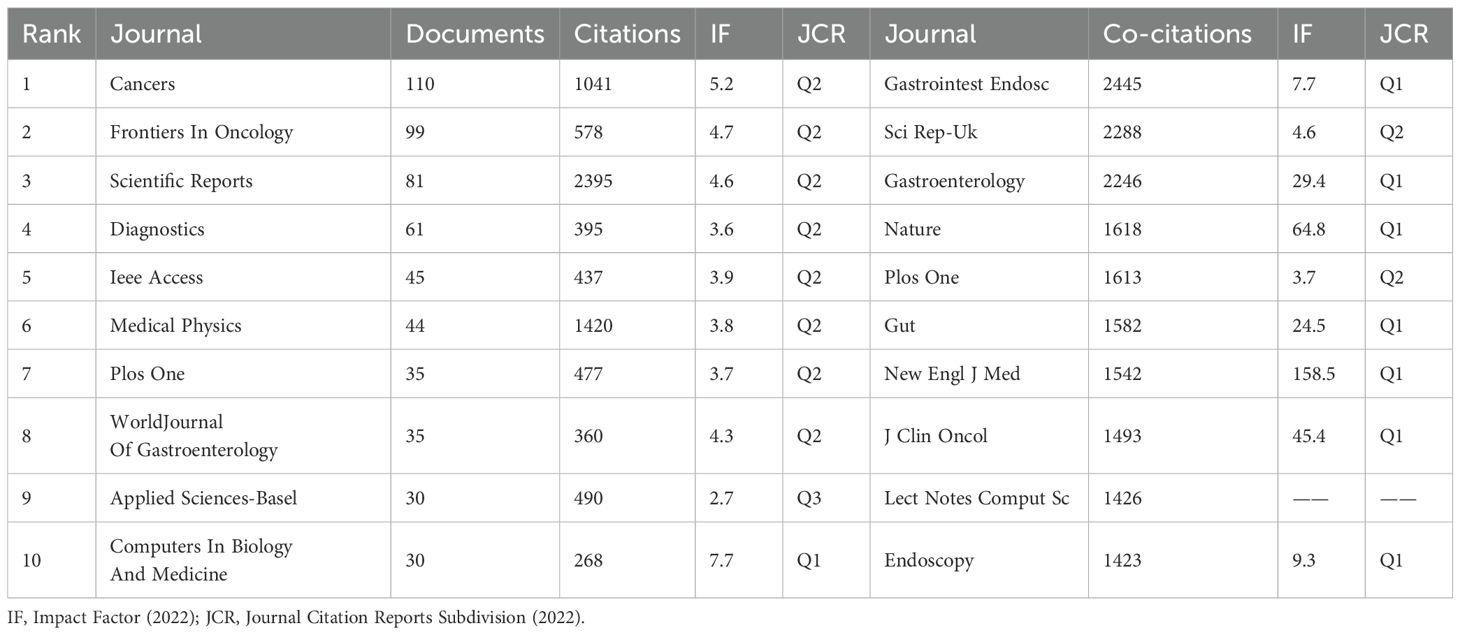
Table 5. Basic information of the top 10 journals in terms of number of publications and co-citations.
In terms of citation frequency, the top three journals were Gastrointestinal Endoscopy (2,445), Scientific Reports (2,288), and Gastroenterology (2,246), as shown in Table 5. Among these cited journals, The New England Journal of Medicine carried the highest impact factor of 158.5 in 2022.
Figure 6 shows a two-plot overlay mapping based on citing and cited journals in the CiteSpace software, revealing these journals were mainly cited through four paths: Literature published in journals in the fields of “Molecular, Biology, Genetics”, “Health, Nursing, Medicine” was cited by literature published in journals in the fields of “Medicine, Medical, Clinical”, “Molecular, Biology, Immunology”. This shows a complex network of intersections and influences between research areas.
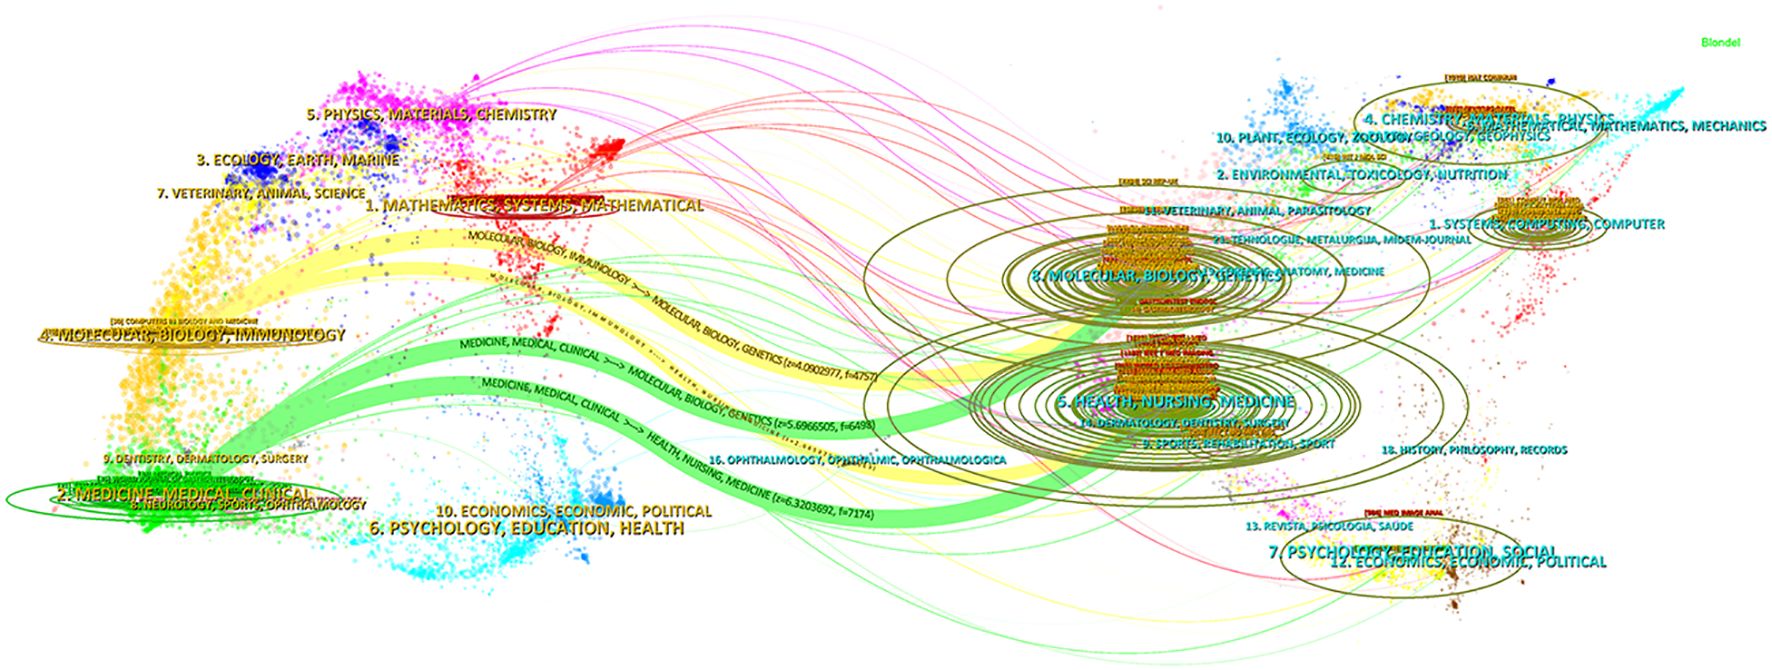
Figure 6. The dual-map overlay of journals. The left side is the cluster of citing journals and the right side is the cluster of cited journals; the curve in the middle is the citation curve; a longer vertical axis of the ellipse indicates that the journal publishes more papers, and a longer horizontal axis indicates a larger number of authors.
3.7 Analysis of referencesThe analysis in the VOSviewer software showed that a total of 89,755 references were cited in 2715 articles. As shown in Table 6, the top 10 most cited literature included. In addition to three epidemiological studies on tumor incidence and mortality [Global cancer statistics 2018: GLOBOCAN estimates of incidence and mortality worldwide for 36 cancers in 185 countries (21), Cancer Statistics, 2017 (22), Global Cancer Statistics 2020: GLOBOCAN Estimates of Incidence and Mortality Worldwide for 36 Cancers in 185 Countries (1)], and a study examining the relationship between adenoma detection rate and CRC mortality risk [Adenoma Detection Rate and Risk of Colorectal Cancer and Death (23)], the remaining six pieces of literatures (24–29) focus on the application of convolutional neural networks in colonoscopy image recognition.
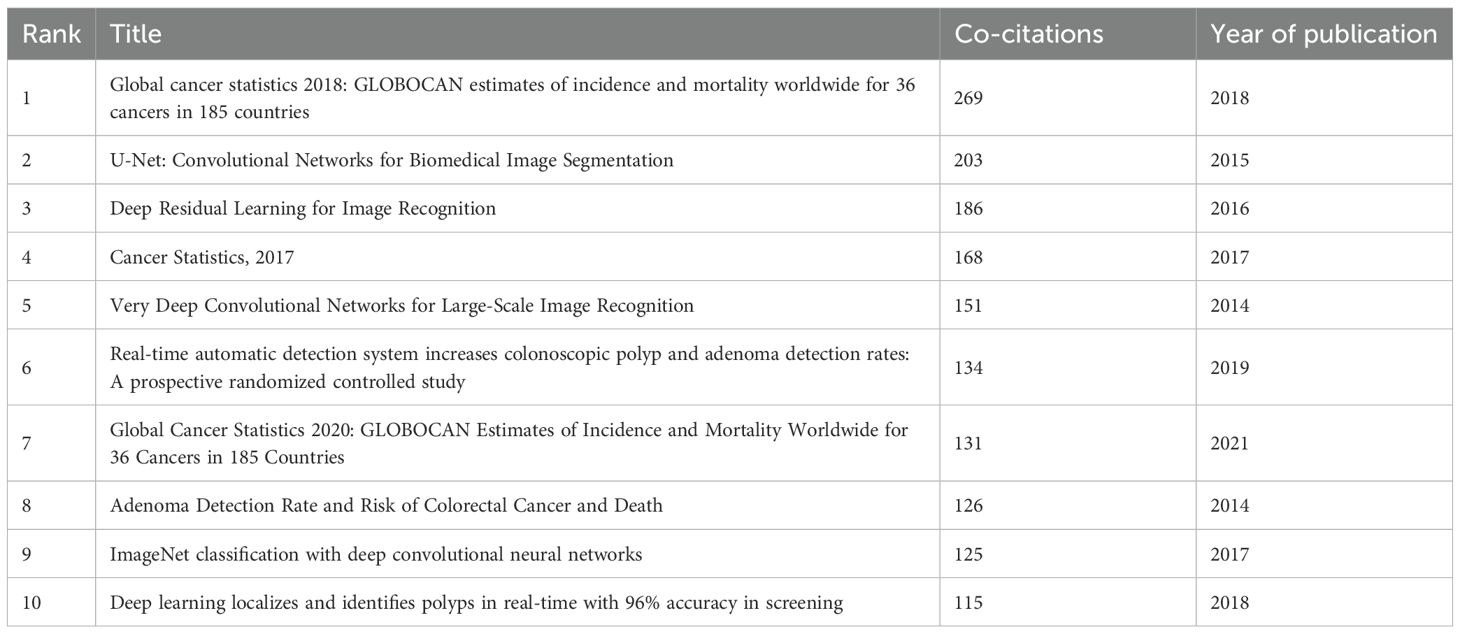
Table 6. Top 10 co-cited references.
The co-cited literature was clustered and analyzed in Citespace software (Figure 7), where the major clusters were mainly related to “Colonoscopy”, “Polyp Segmentation”, “Digital Pathology”, “Lymph Node Metastasis” and “Radiomics “.
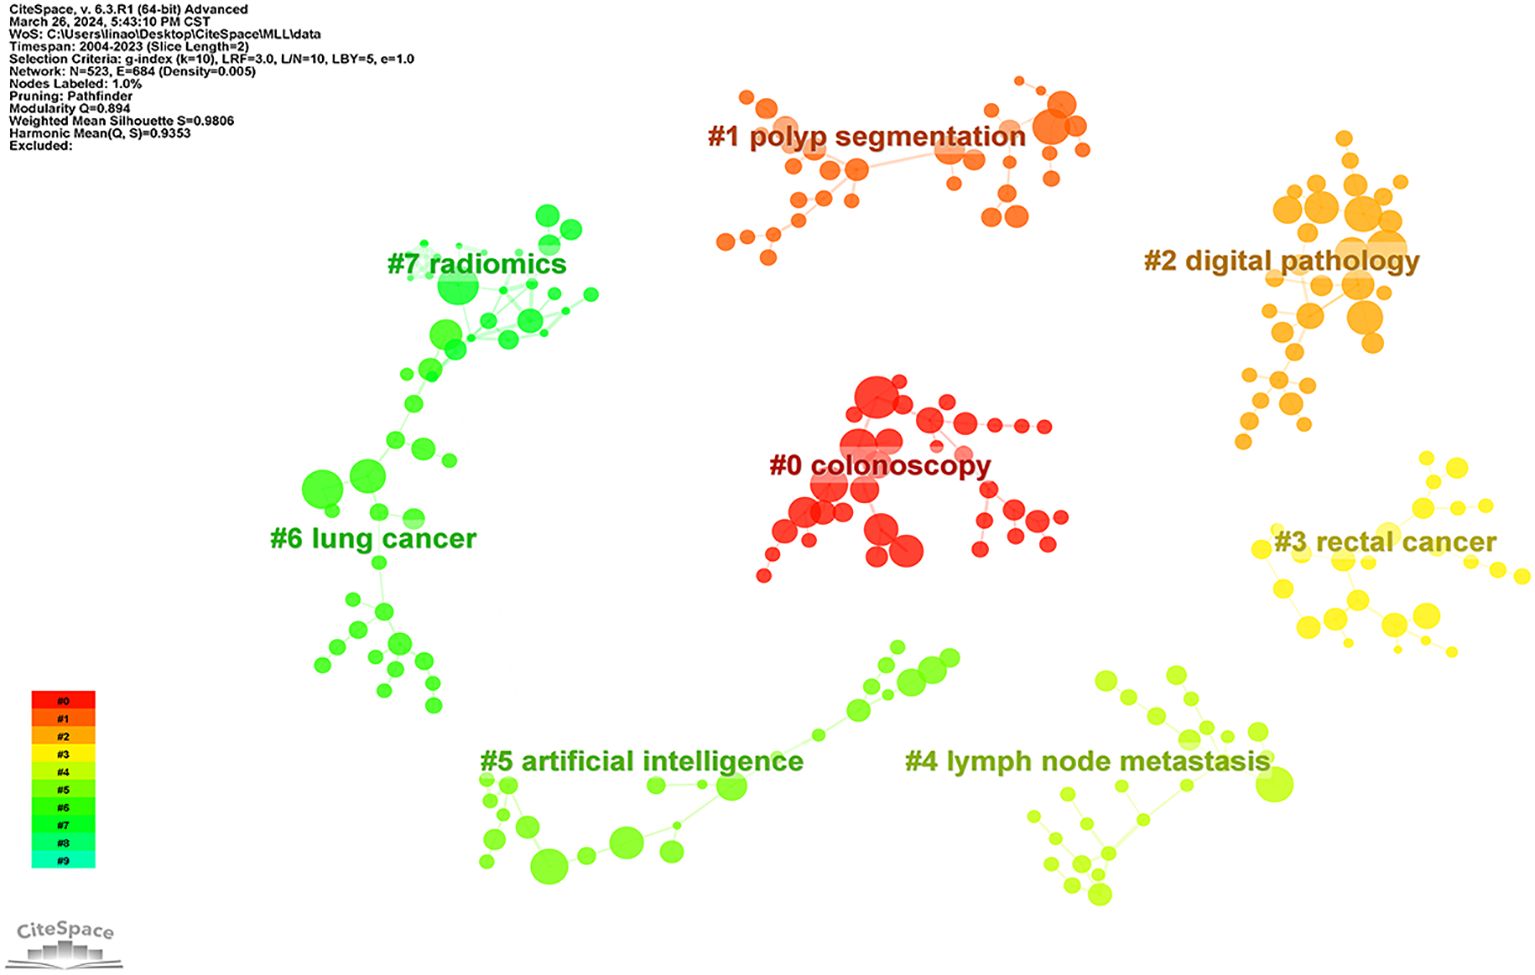
Figure 7. Clusters of co-cited references. Nodes indicate references; node size indicates the number of co-citations;, the larger the node indicates the higher the larger number of co-citations; the number indicates the number of the cluster, with smaller numbers indicating more references included in the cluster.
3.8 Analysis of highly cited studiesHighly cited studies are often regarded as authoritative in the field of research, as they provide key evidence and information on research progresses and trends. In 2715 pieces of results from the VOSviewer software, a total of 83 studies with more than 100 citations were screened out, of which 37 were strong interconnections, and their density is visualized in Figure 8. Table 7 shows the top 10 cited literature, which were published mainly between 2016 and 2019.
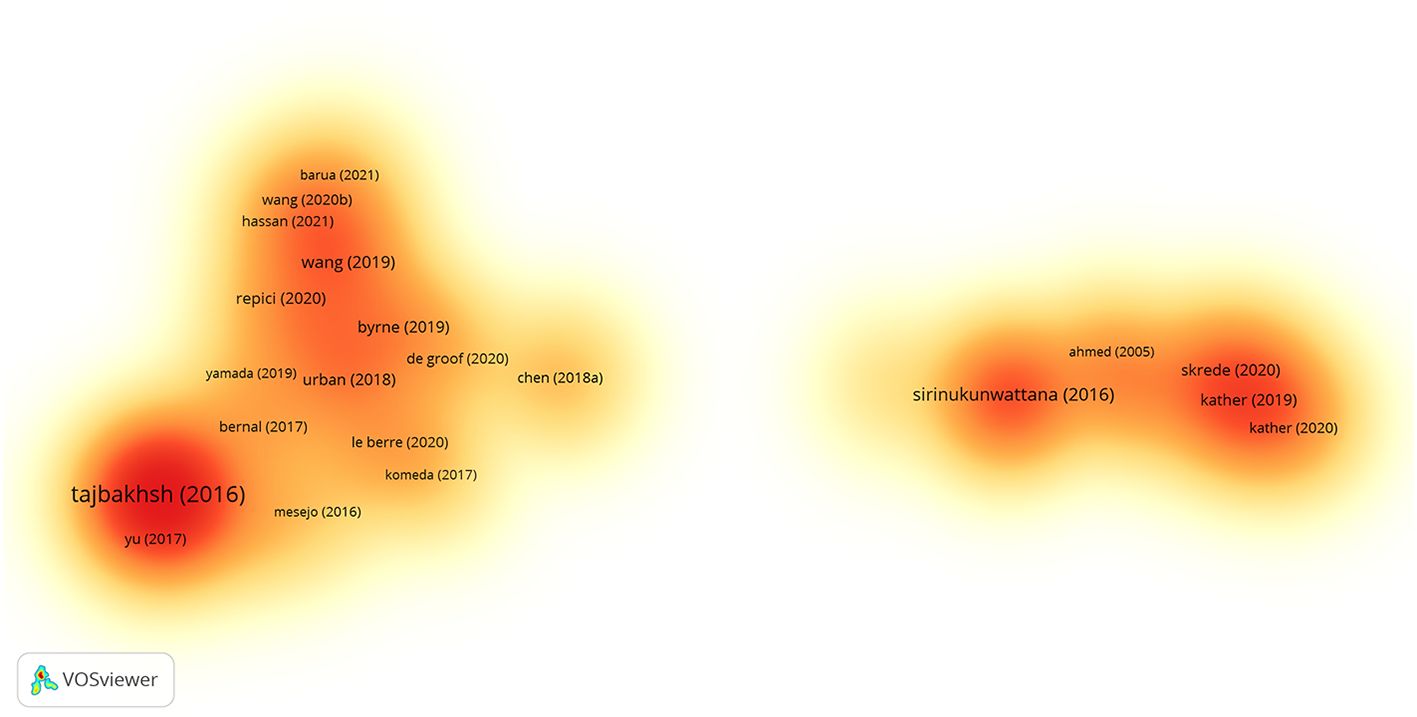
Figure 8. Documents citation density visualization. A color indicates the density of each publication. Yellow indicates a lower frequency of occurrence, while orange indicates a higher frequency of occurrence.
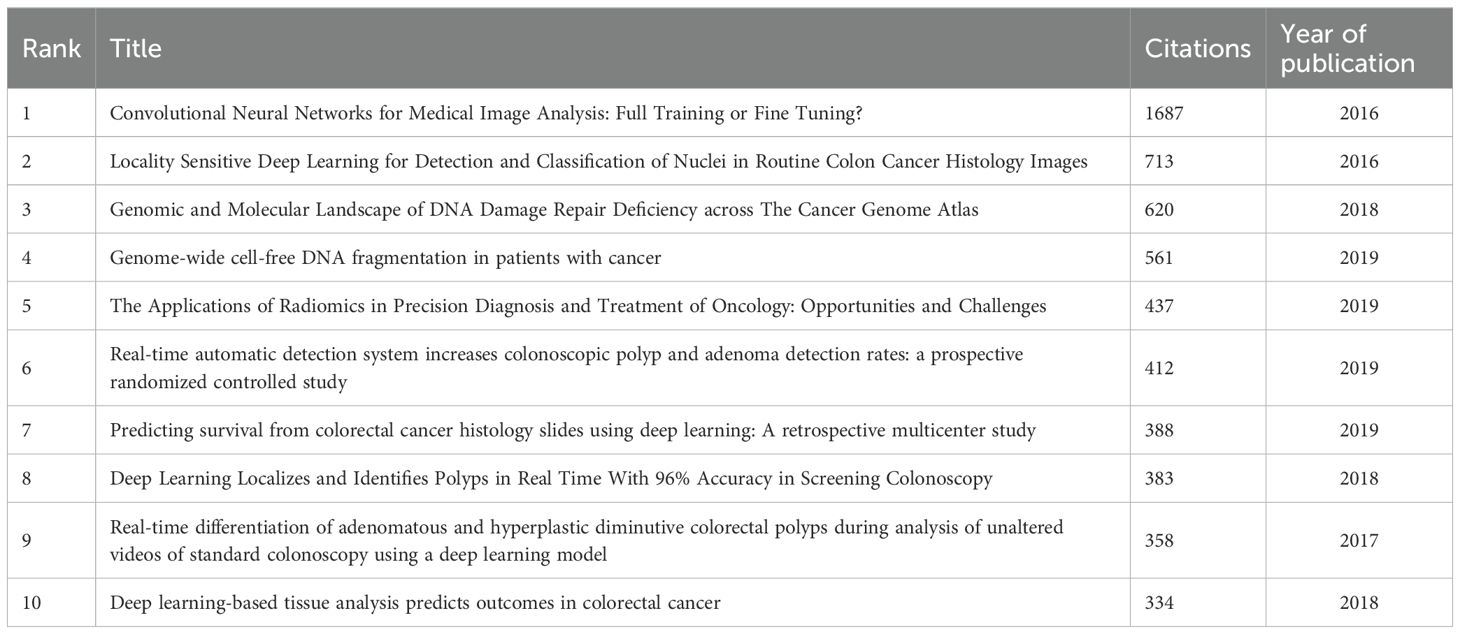
Table 7. Top 10 cited publications.
Among these highly cited studies, an article by TAJBAKHSH N et al. (30) published in IEEE Transactions on Medical Imaging, entitled “Convolutional Neural Networks for Medical Image Analysis: Full Training or Fine Tuning?”, received the largest number of 1687 citations. This article discussed how to more effectively apply convolutional neural networks to medical image analysis. The second most cited was an article by SIRINUKUNWATTANA K et al. (31) in the IEEE Transactions on Medical Imaging entitled “Locality Sensitive Deep Learning for Detection and Classification of Nuclei in Routine Colon Cancer Histology Images”, with 713 citations. It described the use of deep learning techniques to assist in the diagnosis and staging of CRC. Another representative study was “Genomic and Molecular Landscape of DNA Damage Repair Deficiency across The Cancer Genome Atlas” published by KNIJNENBURG TA et al. (32) in Cell Reports, cited for 620 times. This study involved the application of AI in identifying tumor gene expression patterns.
Among the top 10 cited studies, three focused on diagnostic colonoscopy, two on medical image analysis, two on genomic studies, two on prognostic analysis, and one on exploration for digital pathology. This broad coverage highlights the diverse and active research in this field.
3.9 Keywords analysis3.9.1 Keyword co-occurrence analysisCo-occurrence of these keywords can reveal the most active topics within a research field. After importing the data into the VOSviewer software, the results showed a total of 4882 keywords. The top 20 keywords with the highest frequency were displayed (Table 8). The keywords that appeared more than 500 times included machine learning, deep learning, and CRC. Then, the popular keywords were categorized according to the type and functionality of AI models used in these studies (Table 9). The top five types of AI models were machine learning, deep learning, convolutional neural networks, artificial neural networks, and transfer learning; while in terms of functionality, the top five were colonoscopy, radiomics, prognosis, magnetic resonance imaging, and endoscopy. In addition, the VOSviewer software was used to plot the 54 keywords with more than 20 occurrences into a time-stacked graph (Figure 9), which demonstrated the evolution of keywords over time. As shown by gradation of colors in the graph, a color closer to yellow indicates that this keyword is more recent. As can be seen from the timeline in the bottom right corner of the figure, the top keywords were more concentrated between 2020 and 2022. Relatively new keywords included computed tomography, attention mechanism, immunotherapy, lymph node metastasis, and polyp segmentation. The concentrations of these keywords reflected the latest trends and developments in the research.
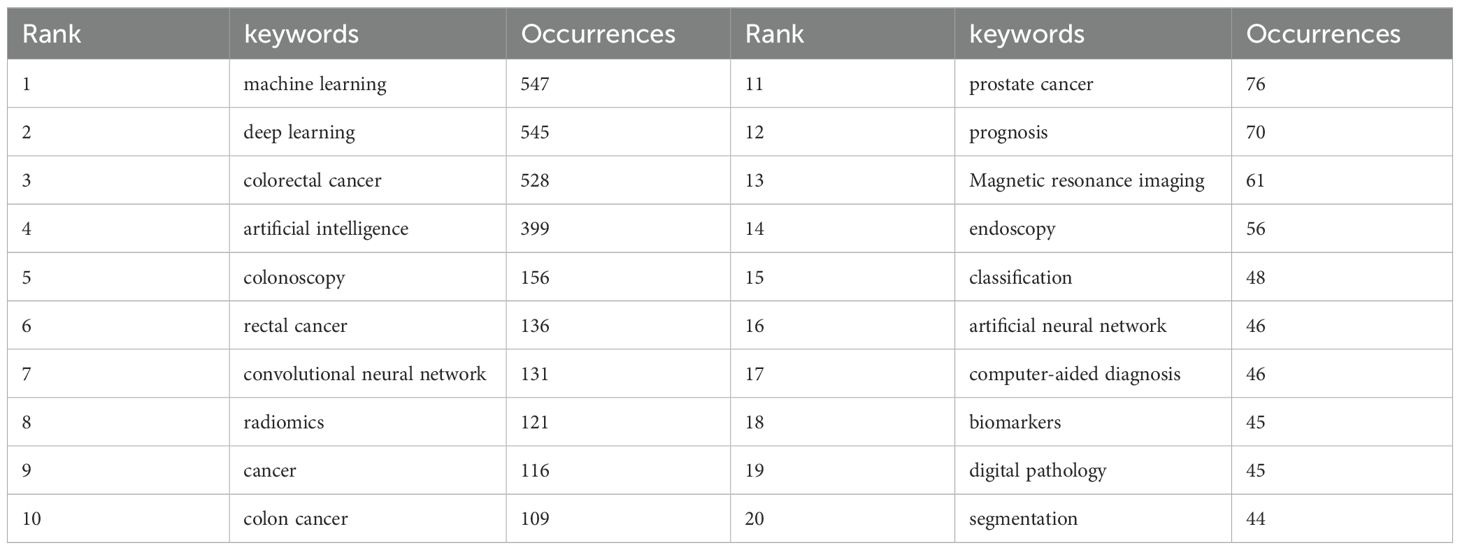
Table 8. Top 20 keywords in terms of frequency of occurrence.
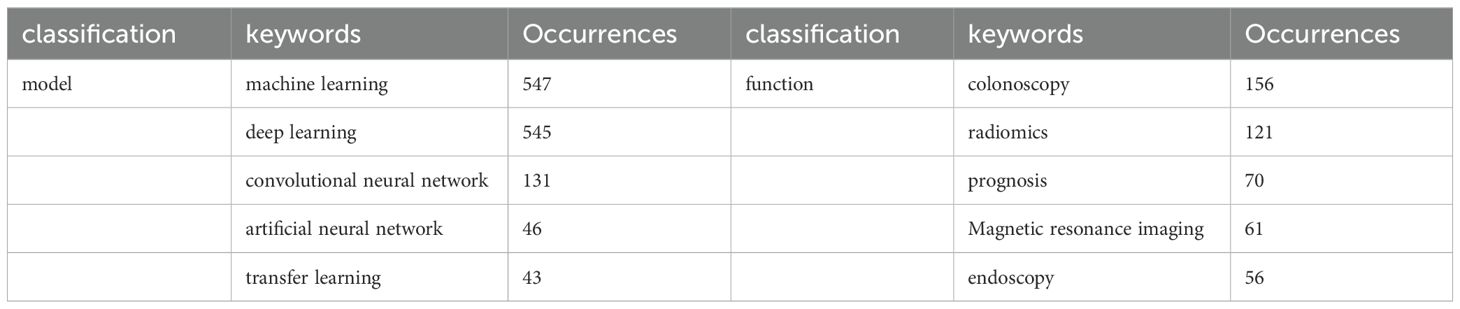
Table 9. Classification of hot keywords.
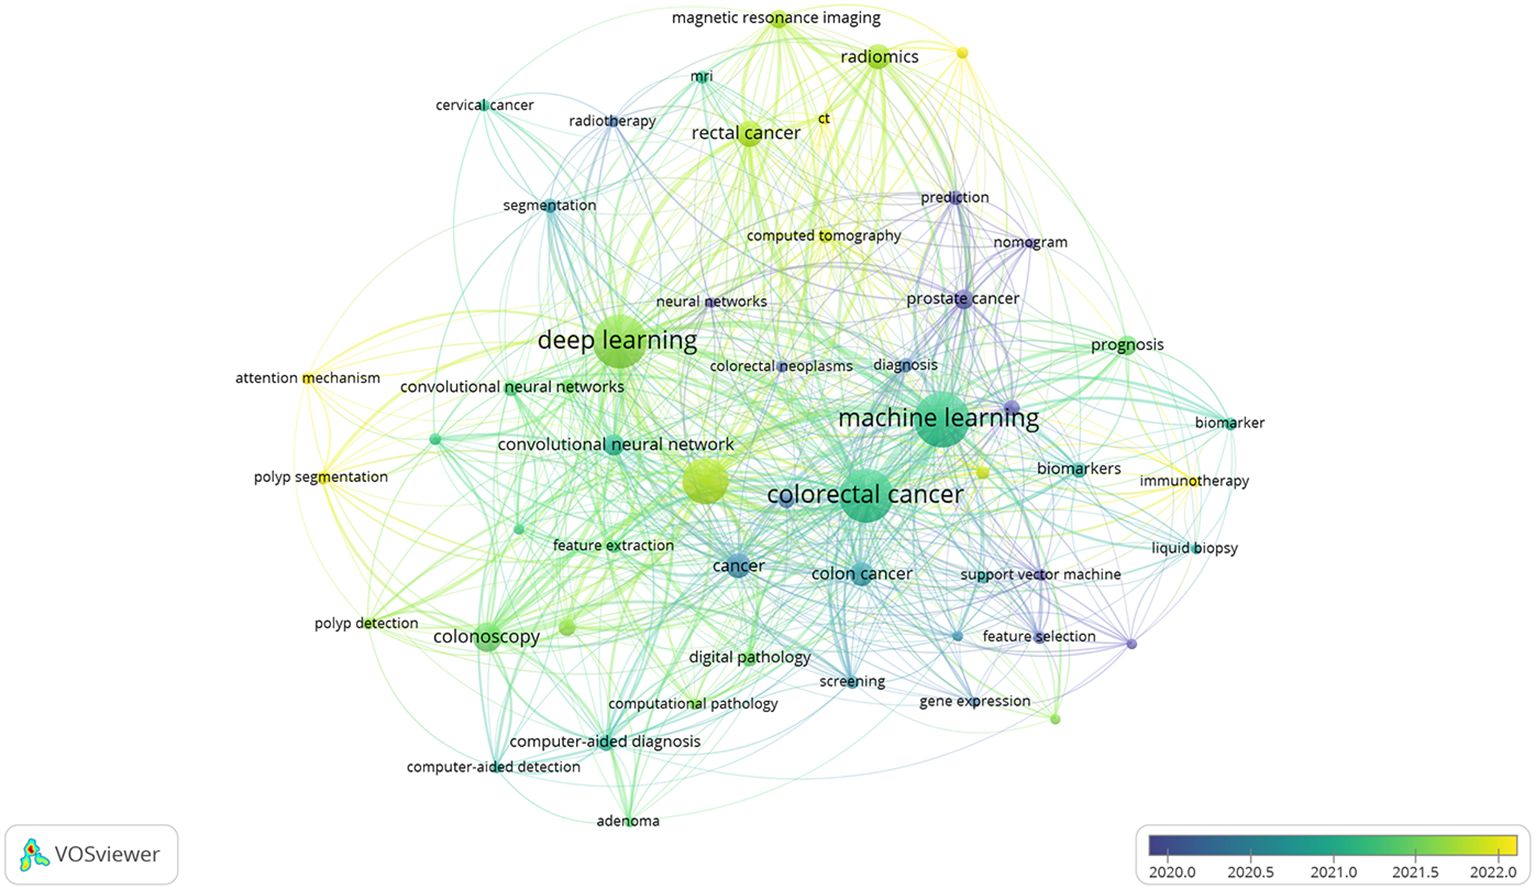
Figure 9. Keyword co-occurrence time overlay. Nodes indicate keywords; a node size indicates the frequency of one keyword; a larger node indicates a higher frequency of one keyword; the color of nodes indicates the time of keyword appearance; a color closer to blue indicates the earlier appearance of the keyword; a color closer to yellow indicates the later appearance of the keyword; the line between the nodes indicates the co-occurrence relationship between the keywords; a thicker line indicates a closer relationship.
3.9.2 Keyword clustering and theme trend analysisKeywords were clustered by CiteSpace software (Figure 10A), revealing the knowledge structure of a particular topic. A Q-value (Modularity) of 0.8317 and an S-value (Silhouette) of 0.9526 indicated that the clusters formed were highly structured and differentiated. Among the top 10 clusters identified (numbered 0-9), cluster #2 focused on polyp detection and covered keywords such as system, optical biopsy, and management; cluster #3 focused on inflammatory bowel disease and contained terms such as endoscopy, confocal laser microendoscopy, capsule endoscopy, and colonoscopy; cluster #5 dealt with digital pathology, with keywords such as microsatellite instability, image analysis, colonoscopy, and panoramic slice images; and cluster #6 focused on gene expression and highlighted the importance of deep learning, artificial intelligence, weighted gene co-expression network analysis, cells, and other concepts; cluster #7 focused on computer-assisted detection, and contained terms such as computed tomography, tumor heterogeneity, texture analysis, etc.; cluster #8 focused on cancer classification, with feature selection, gene expression data, deep learning, and quality metrics as its keywords.
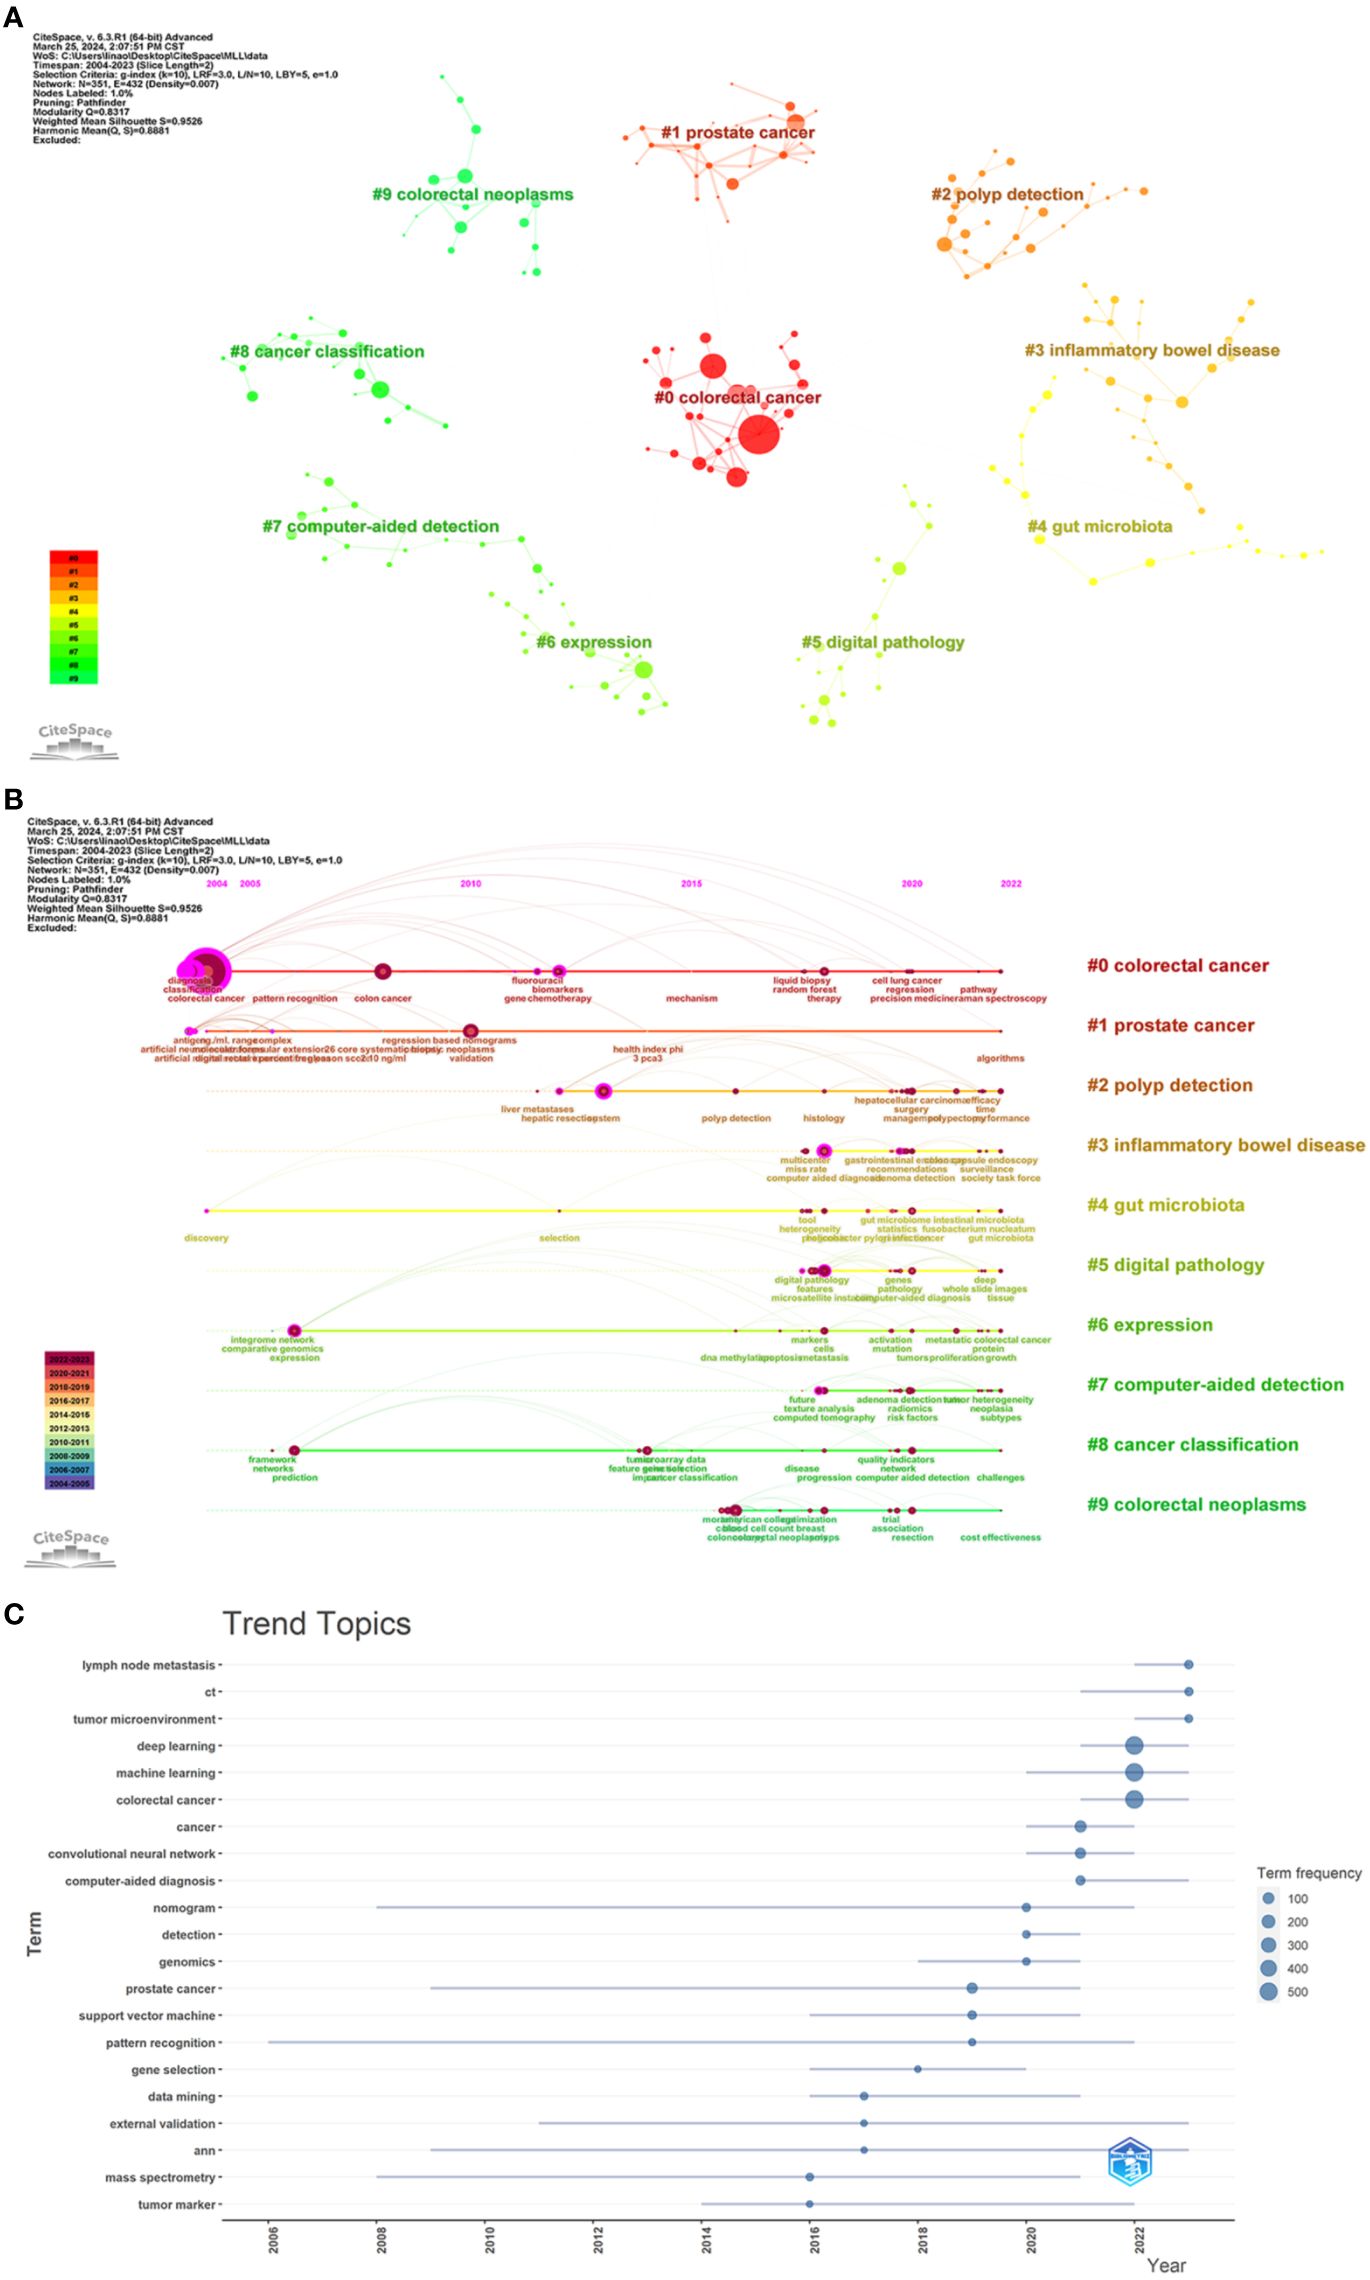
Figure 10. (A) Map of keyword clusters. Nodes indicate keywords; a node size indicates how often one keyword appear; a larger node indicates a higher frequency; the number indicates the number of the cluster, with smaller numbers indicating more keywords included in the cluster. (B) Timeline graph of keyword clusters. Nodes indicate keywords; the upper position of nodes on the horizontal axis corresponds to the time of the first appearance of the keyword; a larger circle indicates a higher frequency of the keyword; the node color indicates the time of one keyword’s appearance; a color closer to purple indicates an earlier appearance, and a color closer to red indicates a later appearance; the color curve indicates the co-occurrence of keyword clusters of different colors; the cluster tag on the right side represents the theme of the domain. (C) Map of thematic trends.
In the CiteSpace, we tracked the evolution of keywords over time by plotting a timeline of keyword clustering (Figure 10B). Using the Bibliometrix, we created thematic trend charts based on keywords over the period from 2016 to 2023 (Figure 10C). We found that early research focused on CRC diagnosis, classification, and biomarkers, whereas recent research tended to focus on areas such as AI-assisted colorectoscopy, digital pathology, image analysis, gene expression, and prognosis prediction. By analyzing the topic trend map, we found that the hot keywords in current research included lymph node metastasis, computed tomography (CT), and tumor microenvironment, which may guide the direction of future research.
4 Discussion4.1 Analysis of the basic situation of the studyThis bibliometric analysis reviews the research on AI in CRC diagnosis and treatment in the past 20 years. We found that the number of publications per year grew slowly and never rose above 50 during the period from 2004 to 2016. However, since 2017, this number began to grow significantly, especially between 2020 and 2023, indicating that this research has ushered in a new era since 2017. More encouraging research is expected in the future.
In the world, China ranked first and the USA second in the number of publications, but China sit far below the USA in the total number of citations. In addition, China’s average number of citations was also lower than that of countries such as Sweden, the United States, the Netherlands, the United Kingdom, Canada, and Germany. According to the TSL index, the United States collaborated most frequently with other countries (regions). These data suggest that although China has released the highest number of publications, the overall quality and authority of its research remain to be improved. The United States undoubtedly occupies a central position in this field. High-quality research is mainly contributed by developed countries in Europe and the United States.
At the institutional level, Sun Yat-sen University devoted the highest number of publications, while the Mayo Clinic gained the highest number of citations. Harvard Medical School and Chinese Academy of Sciences ranked high in the number of publications, number of citations, and TSL, demonstrating their heavy contributions in this research area. As for individual contributors, MORI, YUICHI had the highest number of publications for his research on AI-assisted colonoscopy, while WANG, PU was the most cited author for his research on the effect of AI-assisted colonoscopy on adenoma detection. Their contributions were focused on AI-assisted colonoscopy. Finally, based on the total number of citations and impact factor values, the journals “Gastrointest Endosc” and “Gastroenterology” enjoyed the highest reputation in this field.
4.2 Current research hotspotsAccording to the analysis of highly cited studies, co-cited references, and keywords, the current research hotspots are mainly categorized into the following three areas:
4.2.1 Early screening and diagnosisAI has greatly advanced the development of medical imaging. Features on CT, MRI, and other medical images can be extracted, quantified, and based on to identify and distinguish tumors. AI helps radiologists to detect not only CRC, but also tiny polyps or other early lesions, thus improving diagnostic accuracy and efficiency (33, 34). In colonoscopy, AI can locate and facilitate precise border segmentation of the lesions (24). Deep learning models, such as convolutional neural networks (CNN), can analyze colonoscopy video images in real-time to automatically detect polyps or other abnormal tissues. Some polyps that are small, isochromatic, flat, unclear at borders, hidden by folds, and located at the edges of the field of view, have been easily overlooked by endoscopists, but can now by accurately identified by AI (27, 29, 35). Computer-aided diagnostic (CADx) systems allow optical biopsy and characterization of polyps or other diseased tissues with an accuracy comparable to or higher than that of experienced endoscopists (36, 37).
4.2.2 Pathology and stagingHistopathologic analysis is regarded as the gold standard for assessing cancer diagnosis and prognosis. Whole Slide Imaging (WSI) is being widely around the world used for scanning and digitizing whole tissue sections. AI can extract pathological evidence from these digitized images to support decision-making on lesion type, grading, and other key characteristics (38, 39). To more accurately detect the nuclei, a team of researchers has combined Neighborhood Integration Predictor (NEP) with CNN to quantitate tissue components in the whole slide image (31). Staging of CRC is closely related to lymph node metastasis, lymph nodes with micro-metastases on whole slide images can currently be detected by deep learning models without manual annotation (40). In the future, the application of AI models in this field will be even broader.
4.2.3 Prognostic assessmentAn AI model can combine one patient’s clinical information, pathological results, genetic test results, and other multi-dimensional data to assess the prognosis and provide a strategy for personalized treatment (41). Based on images of CRC tissue samples, researchers have combined a CNN with a recurrent architecture to train a deep learning model for predicting CRC prognosis. This model can assess CRC morphology, histopathology, microenvironment more accurately than an experienced physician (42, 43). AI can also automatically extract multi-dimensional prognostic features (such as tumor size, shape, edge) from CT, MRI, and other medical images for prognostic assessment (44). A “meta-model” has been established to assist in clinical decision-making and predict the survival of cancer patients, even their clinical data are incomplete (45). These AI models have substantially sharpened physicians’ ability to predict the outcomes of CRC.
4.3 Future research trendsAs indicated by the results from the citation analysis and the topic trend analysis, future research of AI in CRC diagnosis and treatment is expected to focus on the following three aspects:
4.3.1 Multimodal data fusionMost of current AI models are operated in a single paradigm, which limits their application in a broader clinical context. The fusion of paradigms can increase the robustness and accuracy of diagnostic and prognostic AI models. Multimodal fusion of histological images and genomic features has demonstrated higher accuracy in tumor grading and molecular typing than single-peak deep networks trained only on histological and genomic data (46). Faisal Mahmood’s team at Harvard Medical School are exploring the application of AI for multimodal data integration in oncology. Their AI model can discover new associations within and across modalities which can explain variations in outcomes or resistance to treatment, as well as new tumor biomarkers and therapeutic targets (47, 48). AI has demonstrated the ability to analyze complementary multimodal data streams about CRC. Multiorganomics techniques and AI algorithms will become a research hotspot in the future and drive the development of precision medicine for cancer (49).
4.3.2 Personalized treatment and precision medicineAI can tail out an individualized treatment plan by analyzing a patient’s genetic information, biomarkers, clinical data, and lifestyle. It has shown that AI can predict microsatellite instability (MSI) and defective mismatch repair (dMMR) in CRC patients, thus facilitating the establishment of personalized drug regimens (50). Various algorithms, which can be run on APPs, have been trained to predict a wide range of genetic mutations, molecular tumor subtypes, gene expression signatures, and standard pathological biomarkers in routine pathological tissues (51). With the continuous advancement of AI technology, the treatment of CRC in the future will be more personalized, precise, and efficient.
4.3.3 Drug developmentAI can be used to optimize peptide synthesis and molecular design, virtualize molecular docking, quantitate conformational relationships, drug repositioning, protein misfolding, protein-protein interactions, and identify molecular pathways in polypharmacy (52). Using AI, an IncRNA-related ceRNA regulatory network containing 144 core genes has been constructed for CRC, thereby easing the exploration of targeted treatments (53). In summary, AI has aroused a sea change in drug development.
5 LimitationGiven that other databases may contain valuable literature, use of only the WoSCC database may have limited the significance of the study. There may have been a language bias from the inclusion of only publications in English, rather than other languages. The quality of selected literature was not assessed, which may have affected the interpretation of the results. Recent high-quality articles were not included into the analysis, which may have discounted the reliability of our findings.
6 ConclusionIn the research on AI in CRC diagnosis and treatment, the United States makes a significant contribution by publishing a large number of articles with high qualities and impacts. China also occupies an important position in the volume of published articles, but there is still room for improvement in the overall quality of research. Currently, the main research hotspots are put on early screening and diagnosis (including imaging, colonoscopy, etc.), pathological diagnosis and staging, and prognostic assessment. Future research may turn to multimodal data, personalized treatment, precision medicine, as well as drug development.
Data availability statementThe raw data supporting the conclusions of this article will be made available by the authors, without undue reservation.
Author contributionsLS: Methodology, Writing – original draft, Writing – review & editing. RZ: Data curation, Software, Writing – original draft. YG: Data curation, Formal analysis, Writing – review & editing. LH: Data curation, Writing – review & editing. CJ: Conceptualization, Supervision, Writing – review & editing.
FundingThe author(s) declare financial support was received for the research, authorship, and/or publication of this article. This study was supported by the National Natural Science Foundation of China (Grant No. 82274269), Traditional Chinese Medicine Technology Development Plan of Jiangsu Provincial Administration of Traditional Chinese Medicine (ZD202324), and Top Talent Support Program for young and middle-aged people of Wuxi Health Committee (BJ2023064).
Conflict of interestThe authors declare that the research was conducted in the absence of any commercial or financial relationships that could be construed as a potential conflict of interest.
Publisher’s noteAll claims expressed in this article are solely those of the authors and do not necessarily represent those of their affiliated organizations, or those of the publisher, the editors and the reviewers. Any product that may be evaluated in this article, or claim that may be made by its manufacturer, is not guaranteed or endorsed by the publisher.
References1. Sung H, Ferlay J, Siegel RL, Laversanne M, Soejomataram I, Jemal A, et al. Global cancer statistics 2020: GLOBOCAN estimates of incidence and mortality worldwide for 36 cancers in 185 countries. CA: Cancer J Clin. (2021) 71:209–49. doi: 10.3322/caac.21660
留言 (0)