
記住我


We recruited a total of 60 CeD patients and 83 of their NC1R. Out of the total 143 volunteer participants, 133 answered the questionnaire that addressed demographic, clinical, dietary and lifestyle factors and 10 were excluded. In addition, 4 CeD patients and 2 NC1R had taken antimicrobials 2 weeks prior to sample collection and 4 CeD patients and 1 non-celiac relative had taken probiotics during the last month. Thus, these volunteers were excluded from the study as well as the 9 NC1R associated to the excluded CeD patients. The recruiting and exclusion processes are represented in Fig. 1.
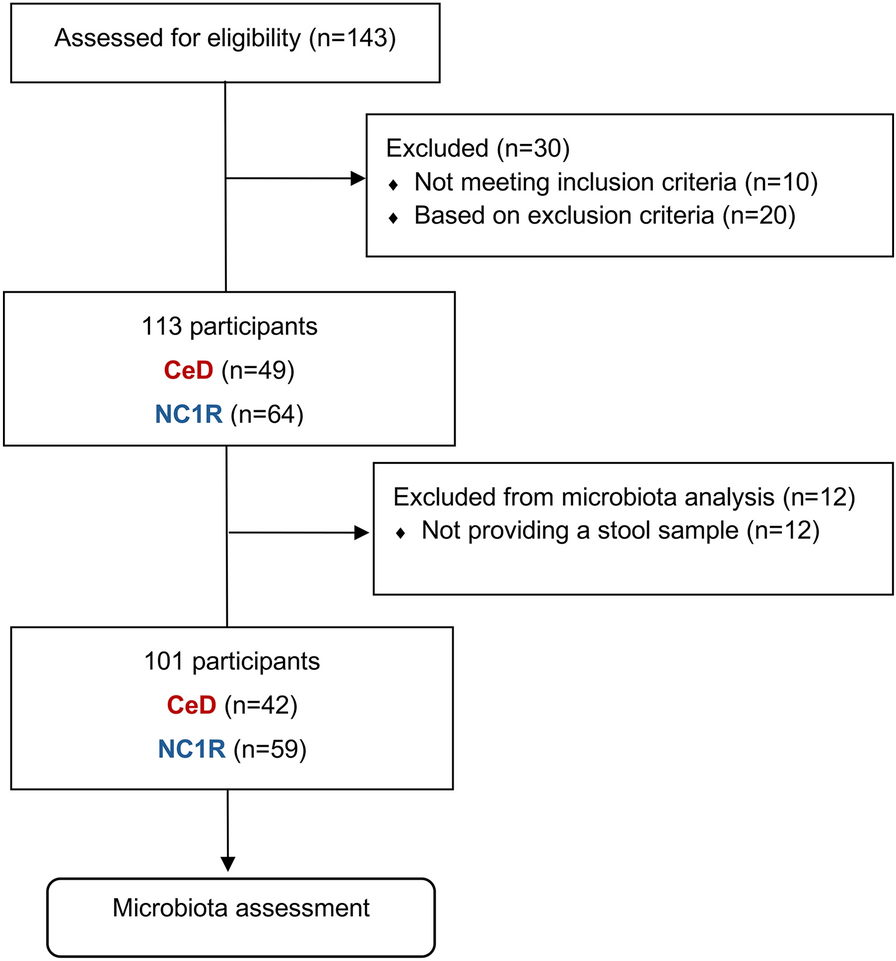
Fig. 1
Study recruiting and exclusion processes. Flow diagram showing the number of participants included: 143 celiac patients (CeD) and their non-celiac 1st-degree relatives (NC1R) volunteered to participate in the current study; out of the 143, 30 were excluded based on inclusion and exclusion study criteria; the final 113 participants were included, but 12 participants failed to provide a stool sample for microbiota assessment
The study population comprised 40% (n = 49) CeD patients and 60% (n = 64) NC1R (Table 1) (see Supplementary Table 1 for detailed metadata). In both groups, female participants outnumbered male subjects, with a higher ratio in the CeD group (CeD, female/male = 43:6; NC1R, female/male = 36:28), with a statistically significant association between sex and CeD (Chi-test = 13.0, p < 0.001). Age distribution ranged from 3 to 58 years old with a mean of 29 ± 14 and a median of 27 years old in the CeD, and 3 to 80 years old in the NC1R with a mean of 40 ± 19 and a median of 45 years old, with a statistically significant difference between the mean ages of both groups (t = − 3.44, p < 0.001). Both groups exhibited diverse education levels, with the majority in each group having either a bachelor’s degree or a master’s/doctoral degree (CeD, n = 25; NC1R, n = 25). Most of the participants resided in urban areas (CeD, n = 27; NC1R, n = 35) and lived with 3 or 4 people in the same house (CeD, n = 30; NC1R, n = 36).
Table 1 Study population demographic and dietary metadataAge of CeD diagnosis had a wide range, from 1 to 51 years old with a median of 21 years old. Less than a quarter CeD patients included in this study reported having a 1st-degree relative with CeD. Also, in the CeD group, approximately half had another concomitant medical condition (n = 25), with the majority having either 1 or 2 (n = 20) and the remaining 3 comorbidities (n = 5). The most common was a respiratory and/or allergic disease (n = 8), followed by autoimmune thyroiditis (n = 7), anxiety (n = 4), anemia (n = 3), osteopenia (n = 3), and irritable bowel syndrome (n = 3). Within the NC1R, almost half reported having at least 1 medical condition (n = 24). Respiratory and/or allergic disease was also the most common comorbidity in this group (n = 7), followed by hypercholesterolemia (n = 6), hypertension (n = 5), and type 2 diabetes (n = 5). Prevalence of type 2 diabetes and hypertension differed statistically significantly between groups (Chi-test = 8.0, p = 0.015), as well as hypercholesterolemia (Chi-test = 6.5, p = 0.04).
All individuals in the CeD group followed a gluten-free diet. In the NC1R group almost all had a gluten-containing diet (n = 60). Majority of participants from both groups reported having a regular eating schedule (CeD, n = 40; NC1R, n = 52). Dietary habits indicate most of the individuals in both groups reported eating less than 3 portions/servings per day of all food groups, including, for instance, grains and grain products (CeD, n = 26; NC1R, n = 34), vegetables (CeD, n = 34; NC1R, n = 45), fruits (CeD, n = 29; NC1R, n = 42), and fish, poultry and eggs (CeD, n = 31; NC1R, n = 37), with no observed significant differences between groups. Interestingly, a statistically significant difference in nutritional supplements intake, like vitamins, minerals, and weight-loss dietary supplements, was found between groups (Chi-test = 6.7, p = 0.012), with a higher intake associated with CeD subjects (CeD, n = 20; NC1R, n = 12). Moreover, only 5 out of the 49 CeD subjects reported being followed by a nutritionist, and of these, only 2 reported intakes of nutritional supplements.
In both groups, the majority reported practicing physical activity (CeD, n = 35; NC1R, n = 34) and non-smoking habits (CeD, n = 46; NC1R, n = 61), while alcohol consumption was limited to less than half of the individuals legally eligible to drink (> 18 years old, according to Portuguese Law) in both groups (CeD, n = 14/38; NC1R, n = 24/52). No significant differences were observed between groups regarding these lifestyle factors.
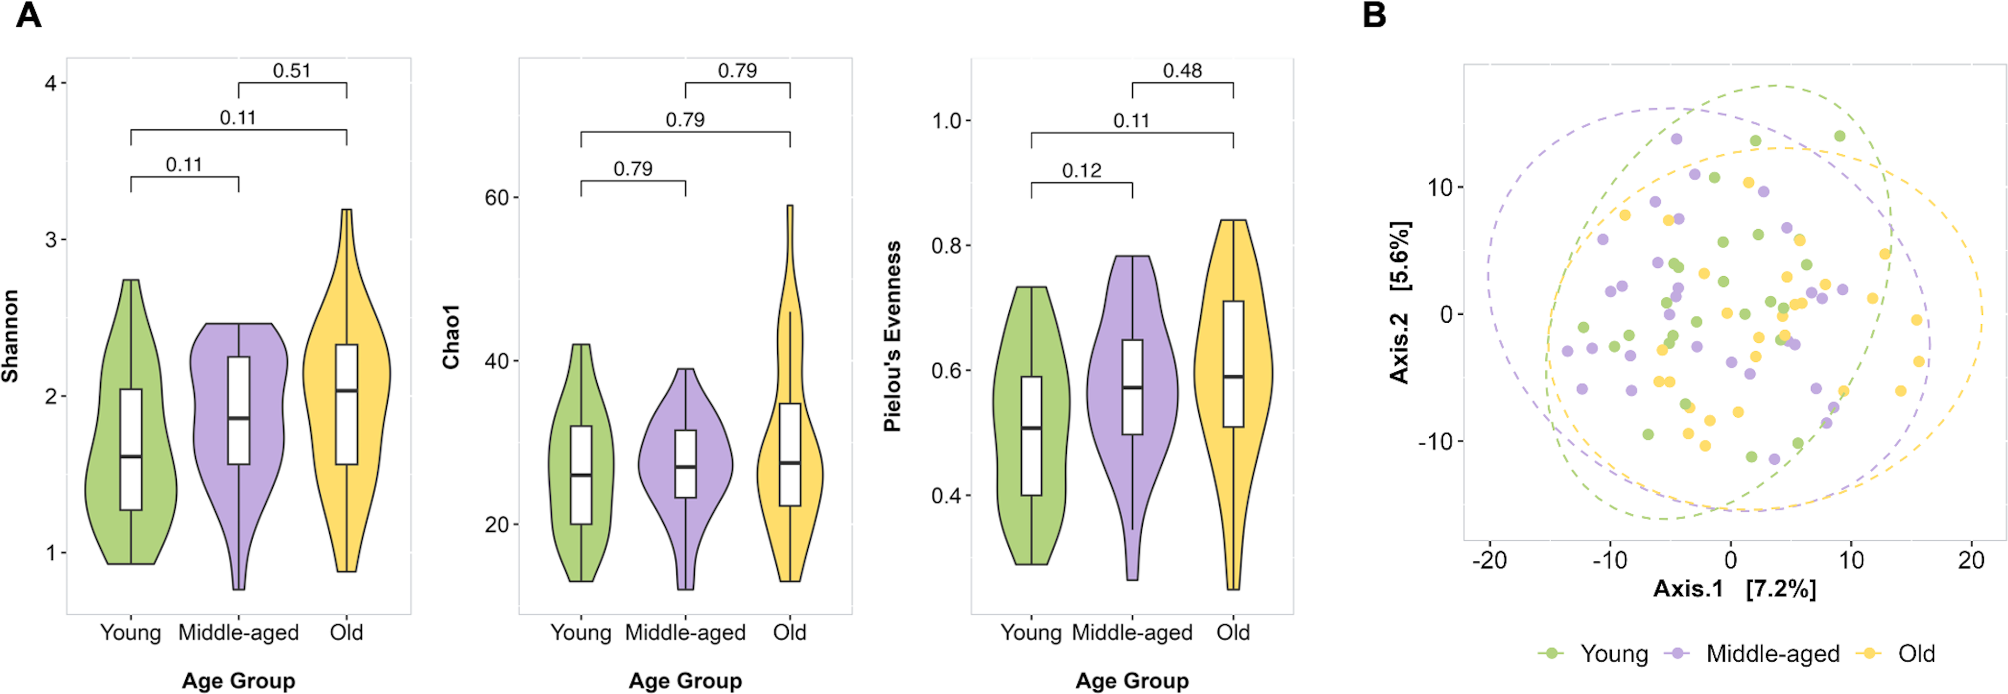
Microbiota resultsMicrobiota abundance at the species level was retrieved for 101 samples (CeD, n = 42; NC1R, n = 59). After following strict criteria for filtering out and retaining alignments with high-quality and sequence identity values, we obtained a data matrix with abundance estimation for more than 200 gut microbial species to calculate ecological descriptors with comparative aims between groups. From all descriptors evaluated, individual-based alpha diversity indicates no significant differences between CeD individuals and NC1R, but the last ones tended to have larger number of species present in their samples (adj-GLM = 0.021, Z-value = 1.37, adj-p = 0.170) (Fig. 2A). At the community structure level (beta diversity), we could discern classical host covariates influencing and shaping the gut microbiota. Thus, in addition to the grouping variable (CeD vs NC1R, Adonis = 1.80, R2 = 0.018, p = 0.005) (Fig. 2B), the structure of the gut microbiota was influenced to a similar extent by the sex (Adonis = 1.47, R2 = 0.015, p = 0.036), age (Adonis = 2.26, R2 = 0.022, p < 0.001), and body mass index (BMI) (Adonis = 1.64, R2 = 0.016, p = 0.011), where the disease status and age explained roughly 2% of the observed variability. Consequently, we included such covariation (see methods) in the generalized linear mixed models as random variables, aside from the sequencing batch, to unveil potential microbiota species differentially abundant in CeD individuals.
Fig. 2
Microbiota assessment on celiac (CeD) subjects and non-celiac 1st-degree relatives (NC1R). Red color legend shows values and distributions for CeD and blue color legend for NC1R (N = 101, CeD = 42, NC1R = 59). A Distribution of individual richness alpha diversity descriptor. Statistical comparison based on generalized linear mixed models (GLM, lme4:glmer function) with covariate adjustment. B Non-metric dimensional scaling (NMDS) analysis of microbiota multivariate data. A permutation-based comparison (Adonis, vegan::adonis2 function) was used to evaluate the microbial variability attributed to disease condition; statistical estimates are shown in the inbox scatter plot. Ellipses show value distribution and confidence interval at 95%. C Aitchison distance (compositional) between relative and non-relative pairs is shown in a boxplot manner. The non-relative distances outnumber several hundred times the obtained for relative pairs. For homogeneous comparison aims, there was a resampling to obtain 250 non-relative random distances to compare with < 100 retrieved from relative pairs. This procedure was tenfold, and statistical comparison was achieved every time, always significantly different (Wilcoxon Rank Sum test). D Bacterial species found to be more abundant in non-celiac controls. E Species retrieved to be more abundant in CeD subjects. Distribution of clr-based abundance is shown as violin plots; medians appear as solid lines with respective color legends. Statistical comparisons in D and E are based on generalized linear mixed models (GLM, lme4:glmer function) with covariate adjustment
Before proceeding with the differential abundance approach, we wondered to what extent the kinship perspective adopted in this study could help us distinguish specific microbial signatures for CeD. In such a manner, we compared the Aitchison distance between microbial communities from relatives (patients and their NC1R pairwise comparisons) and non-relatives (remaining pairwise comparisons between non-related individuals) regardless of the disease status. As expected, we found that related individuals had lower Aitchison distance between their gut microbial communities (closer in terms of species occurrence and abundance) (Fig. 2C). Consequently, this cross-sectional framework with a kinship perspective may be crucial for discerning disparate microbial features in similar microbial communities as disease development and progress determinants. Generalized linear mixed models (GLM) with covariate control showed CeD subjects with lower proportions of gut microbiota related to complex polysaccharide and fiber degradation, such as Ruminococcus, former Eubacterium, and Prevotella species. Among those taxonomy categories with reliable species delimitation and larger size-effect (GLM estimate), we found that Ruminiclostridium siraeum (adj-GLM = 0.87, Z-value = 2.62, adj-p = 0.009) and Ruminococcus bicirculans (adj-GLM = 17.5, Z-value = 4.57, adj-p = 4.81e-6) were more abundant in NC1R than in CeD. Besides, we also found that Bacteroides plebeius (adj-GLM = 0.47, Z-value = 1.75, adj-p = 0.095), Akkermansia muciniphila (adj-GLM = 0.67, Z-value = 1.95, adj-p = 0.051) and Gemigger sp. 003476825 (adj-GLM = 1.01, Z-value = 2.06, adj-p = 0.039) were more abundant in control individuals (Fig. 2D). Conversely, CeD subjects exhibited a meaningful increased abundance of Erysipelatoclostridium ramosum (adj- adj-GLM = − 1.01, Z-value = − 2.64, adj-p = 0.008), Haemophilus parainfluenzae (adj-GLM = − 1.08, Z-value = − 1.64, adj-p = 0.100), Eisenbergiella massiliensis (adj-GLM = − 0.71, Z-value = − 2.02, adj-p = 0.044), and Streptococcus infantis (adj-GLM = − 0.81, Z-value = − 2.34, adj-p = 0.019) in their intestinal tract (Fig. 2E).
Microbiota and host variable data integrationCeD patients are prone to nutritional deficits because they are forced to adopt lifelong gluten-free diet regimes [22, 23]. Given the interrelated set of microbial species lessened in CeD fecal samples, we wondered if dietary patterns could directly influence these observations. Dietary records (categorical variables) for servings, whole grain, animal protein, dairy products, refined sugars, alcohol, coffee, vegetables, and fruit averaged daily intake were surveyed and integrated with microbiota data via logistic regression with covariate control to look for possible interactions explaining differential microbiota abundance. We detected several interactions among microbial species, exhibiting disparate abundance between study groups and certain diet variables obtained from self-reported records. Among them, R. siraeum seemed to be greatly influenced by several dietary parameters, which also differ between CeD and their NC1R. As a consequence, consumption of nutritional supplements (e.g. vitamins, minerals, and weight-loss supplements) negatively affected the abundance of R. siraeum (OR = 0.53, p = 0.002), whose higher intake was linked to CeD subjects (Chi-test = 11.3, p = 0.002) (Fig. 3A). Also, we revealed that R. siraeum was positively influenced by vegetable intake patterns. In particular, the intake of 3 servings a day boosted its abundance (OR = 1.27, adj-p = 0.015). Moreover, CeD subjects had a drastic drop of this microbial species in lower vegetable intake regimes (Fig. 3B). In this last regard, this association was reversed when vegetable servings a day was less than 3 (OR = 0.82, adj-p = 0.021), thus suggesting a direct nutrient-microbe interaction, with a larger effect on NC1R (R. siraeum median clr-abundance = − 1.25 vs 1.18 for low and higher vegetable intake, respectively, adj-p = 0.049).
Fig. 3
Integration of gut microbiota data with host variables. Logistic regression (stats::glm function with binomial distribution assessment) with covariate control was used to evaluate correlation between dietary patterns and disparate gut microbiota traits between celiac (CeD) (red) and non-celiac 1st-degree relatives (NC1R) (blue). Statistical assessment supports interaction between Ruminiclostridium siraeum and nutritional supplementation (A), and with vegetable consumption (B). C The pattern of 3 servings a day was correlated with 4 out of 9 categories detected to be differentially abundant between CeD and NC1R (Fig. 1D, E). Comparison between subgroups was achieved using Wilcoxon Rank Sum test with multiple testing (FDR). Chi-squared test (stats:chi.sq function with Monte Carlo simulation) was computed to evaluate contingency tables resulting from subject grouping and dietary patterns as categorical and dichotomous variables
On the other hand, we found several species differentiated between CeD subjects and NC1R to be strongly influenced by the number of servings consumed daily. Again, R. siraeum (OR = 1.32, adj-p = 0.002) and, to a lesser extent, B. plebeius (OR = 1.07, adj-p = 0.025) were positively correlated with the consumption of 3 servings a day, a pattern more prevalent in NC1R (Chi-test = 12.1, p = 0.001). By contrast, this meal pattern seemed to have the opposite effect on E. ramosum (OR = 0.76, p = 0.012) and S. infantis (OR = 0.73, p = 0.011) abundance (Fig. 3C). Strikingly, this correlation pattern was fully reversed when considering intake regimes of more than 3 servings consumed daily, an observation that can plausibly link the abundance of such species with daily calorie intake. The regime of more than 3 servings a day was more frequent in CeD subjects (Chi-test = 11.3, p = 0.003), but CeD individuals had statistically significantly lower BMI compared to NC1R (20.9 vs 25.3, t = − 5.42, p = 4.49e-7), a surrogate marker for calorie intake. The above may be explained by the nutrient malabsorption characteristic of CeD [22,23,24]. However, it is important to notice that CeD subjects who consumed more than 3 servings a day (CeD, n = 35) had, on average, a BMI almost 1 unit higher than those who took lower number of servings per day (CeD, n = 7) (21.1 vs 20.4, no statistically significant difference); what might support the microbe-caloric intake interaction predicted. In NC1R the BMI average was equal in both dietary regimes (25.25 vs 25.31). Finally, we detected a negative association between fat consumption and Akkermansia muciniphila abundance. This species was lower in subjects consuming at least 3 servings/portions of fats/oils daily (OR = 0.74, CI 0.52–0.99, adj-p = 0.043), although no differential pattern of consumption was observed between groups (Chi-test = 0.06, p = 1.000). All in all, we cannot disregard the impact of nutrient quality, rather than quantity, on the microbial community structure and disease progression, given the radically different dietary regime regularly followed in CeD [25]. Nevertheless, this is still a limitation of the current study that make impossible to establish more specific diet-host-microbe interactions.
留言 (0)