
記住我


Sequence conservation and SNP specificity are the basis of Herb-Q assay [31]. To select candidate SNPs, suitable sequences were identified using commonly used candidate barcodes (ITS, matK, rbcL, and psbA-trnH). A total of 734 ITS, 232 psbA-trnH, 421 matK, and 382 rbcL sequences from Fritillaria were downloaded from GenBank database. The phylogenetic tree was established to complete the phylogenetic analysis after aligning the sequences, and sequences with incomplete sequencing or obviously abnormal evolutionary positions were eliminated. A total of 467 ITS, 168 psbA-trnH, 320 matK, and 284 rbcL sequences were suitable for subsequent SNPs screening. Based on the specificity of SNPs, no suitable SNPs were screened in the rbcL and psbA-trnH sequences. Hence, the 467 ITS and 320 matK sequences were determined suitable for quantifying FCB and its adulterants using Herb-Q. The ITS and matK sequences from 170 samples were examined and collected as self-test sequences to complement the reference database used for Herb-Q analysis. Combined with previously downloaded sequences, a total of 637 ITS and 490 matK sequences were aligned to screen for candidate SNPs (Supplementary Table 3).
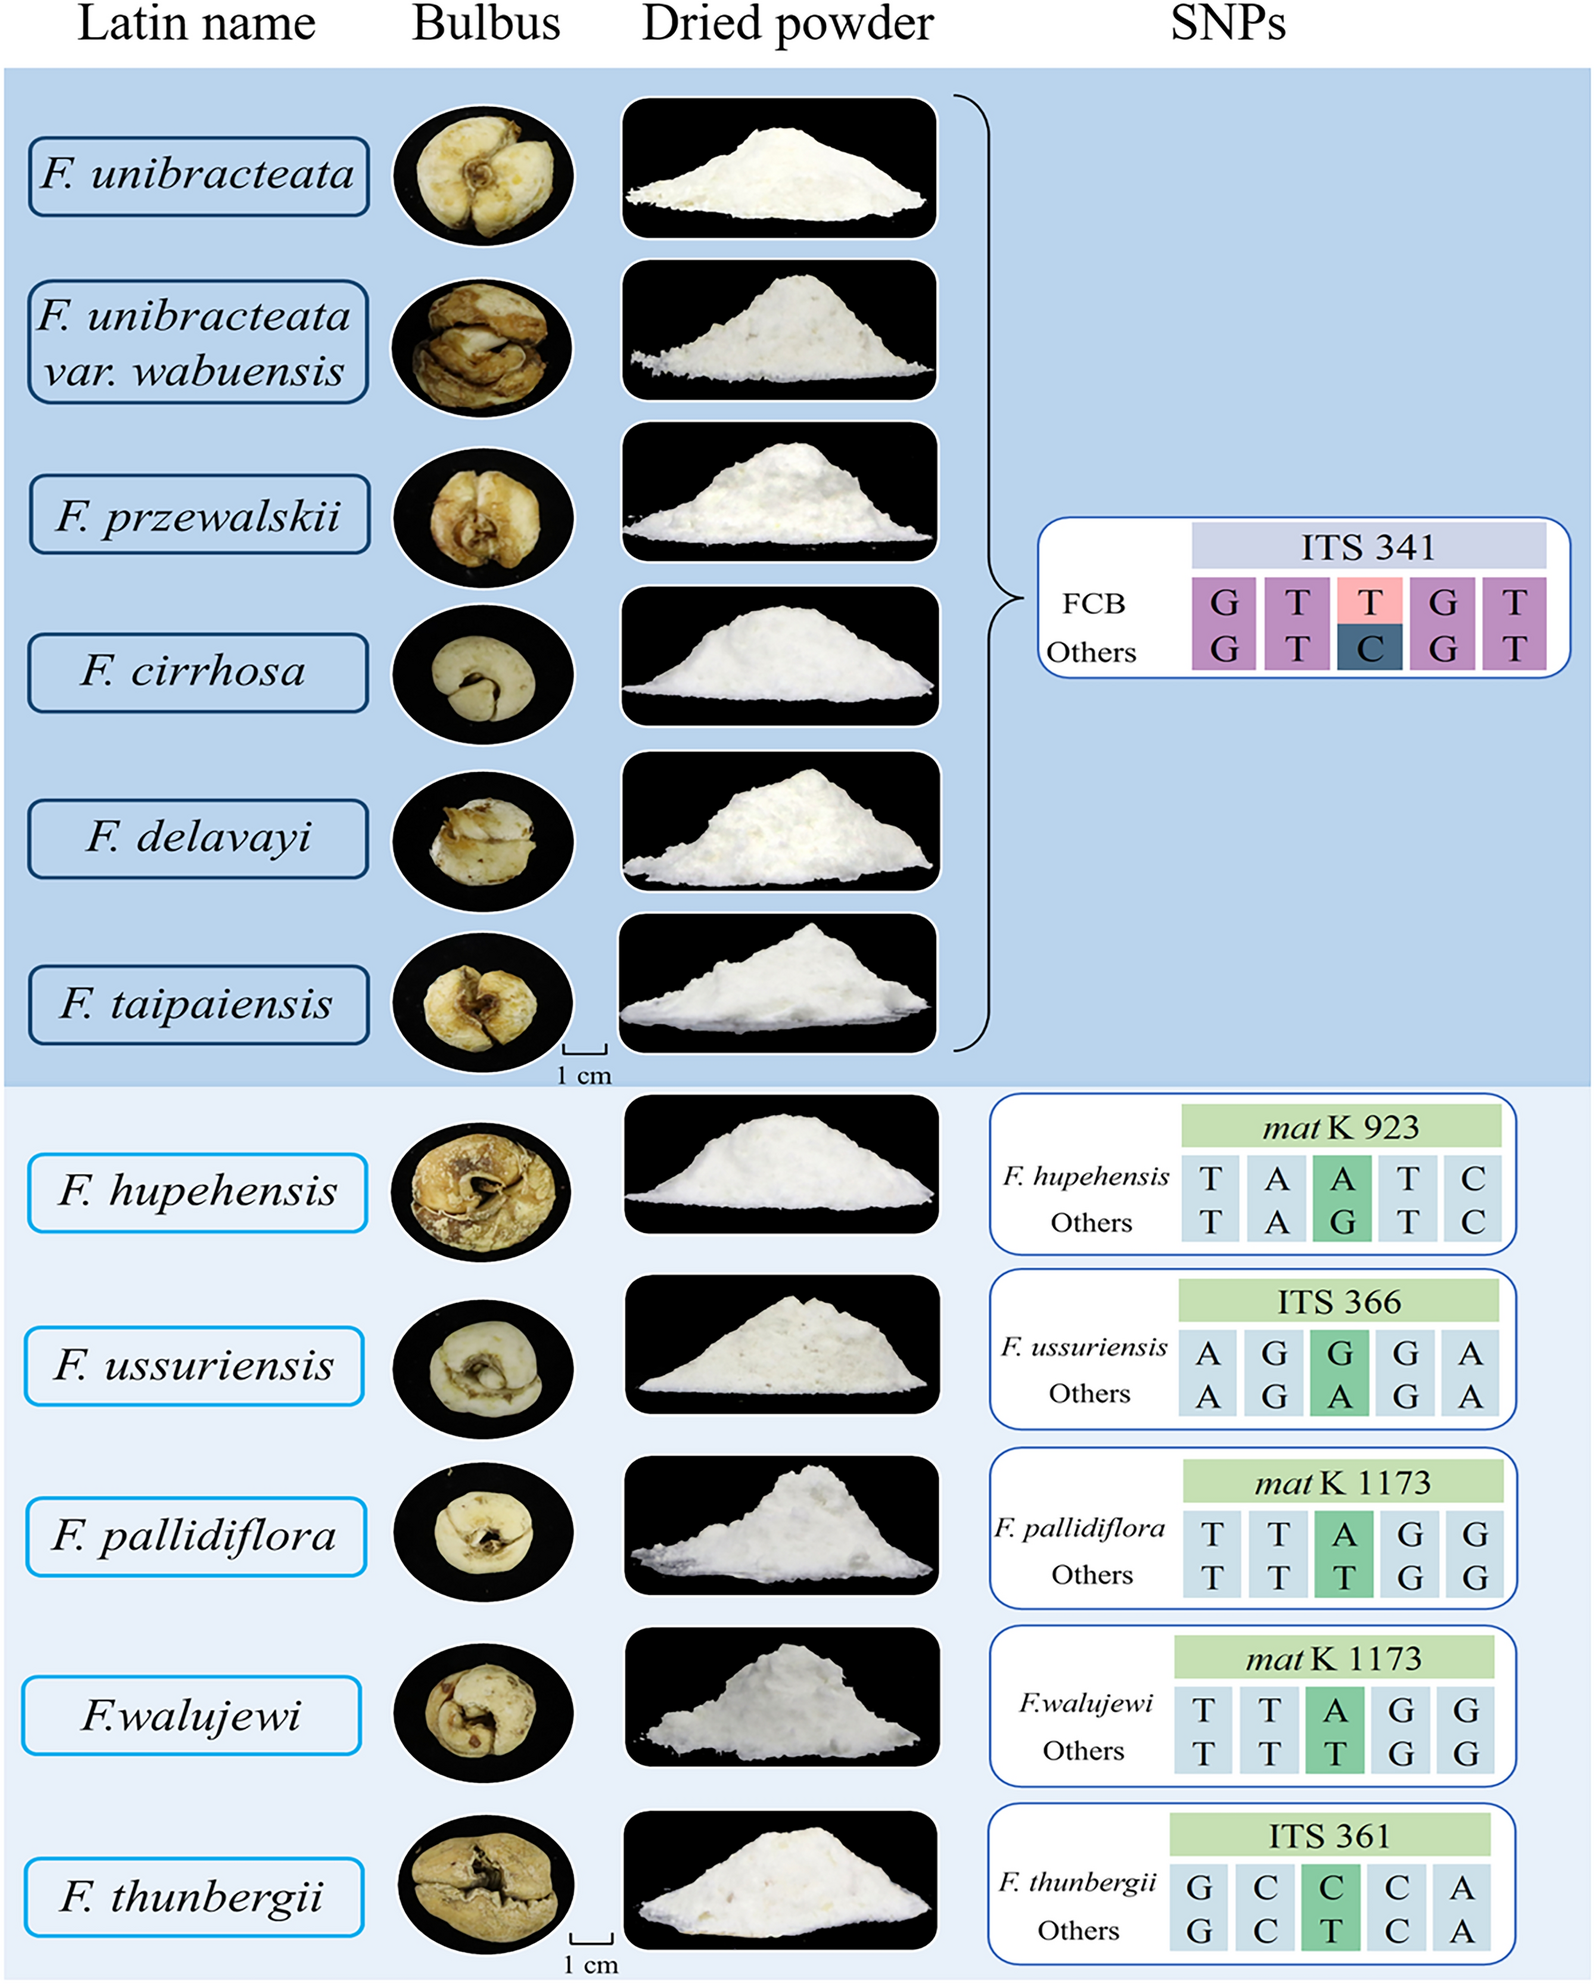
Screening of candidate SNPsFive SNPs that could identify FCB and its five adulterants were obtained following the two-step screening criteria. First, to screen the identification sites of FCB and its adulterants, the sequences of six original species of FCB were aligned with the sequences of five adulterated species, and ITS 341 and matK 336 site were obtained. At ITS 341 site, all species were genotyped as T or C, while at matK 336 site, all species were genotyped as A or G (Supplementary Table 4). Based on the principles of pyrosequencing instrument, base A consumes energy during the experimental reaction, which affects the quantitative results. Therefore, ITS 341 site was more suitable for further validation and was chosen as the identification site for FCB and its adulterants (Fig. 1). Second, to screen the identification sites of five adulterants of FCB, the sequences of single adulterant species were compared with those of other Fritillaria species (Supplementary Table 5). The ITS 361, ITS 366, matK 923, and matK 1173 sites could be used to identify F. thunbergii, F. ussuriensis, F. hupehensis, and FPB, respectively, which corresponded to genotypes C, G, A, and A (Fig. 1). The screened sites were unique identification sites; therefore, the energy consumption of the bases was not considered. Five candidate SNPs were obtained by preliminary screening, and their specificity and effectiveness require further verification.
Fig. 1
Characteristics and SNPs information of Fritillariae Cirrhosae Bulbus (FCB) and its adulterants. From left to right, the Latin names, medicinal parts, dried powder and SNP of six original species and five adulterants of FCB are shown
Verification of specificity and validity of candidate SNPsTo verify the specificity of the five SNPs obtained from the screening, a 55 bp sequence containing the SNP was selected [32]. BLAST results for these sequence sites were consistent with those of the corresponding identified species (Supplementary Table 6).
The validity of the obtained SNPs was verified using pyrosequencing. Among the five specific SNPs, ITS 341 site was used to identify FCB and its adulterants; the genotype of FCB was T, while that of other adulterants was C. When the verified samples had six origins, five adulterants, and a mixed powder of these 11 species (1:1 mixture), the pyrosequencing results showed three types of pyrograms (Fig. 2A and B). Based on this result, ITS 341 site was obtained to specifically distinguish FCB and its adulterants. Among the specific identification sites for the five adulterants of FCB, matK 923, and matK 1173 sites were used to identify F. hupehensis and FPB, respectively. At matK 923 site, pyrosequencing was expected to result in an A genotype for F. hupehensis, a G genotype for the remaining ten single samples, and both A and G genotypes for the mixed powder of FCB and its adulterants (Fig. 2C and D). At matK 1173 site, the genotype of FPB was A, that of the other nine species was T, and the mixed powder of the 11 species contained both T and A. The verification results for these samples are shown in Fig. 2E and F, 1–12. These results were consistent with the expectations, indicating that the matK 923, and matK 1173 sites were successfully verified. The verification results for the other two SNPs are shown in Supplementary Fig. 1. In subsequent experiment, these five SNPs were combined with Herb-Q to identify the six origins and five adulterants of FCB.
Fig. 2
Verification SNPs for FCB, F. hupehensis and Fritillariae pallidiflorae bulbus (FPB) at ITS 341, matK 923, and matK 1173 sites. A, C, E The standard pyrograms of ITS 341, matK 923, and matK 1173 sites; B, D, F The text pyrograms of ITS 341, matK 923, and matK 1173 sites; 1: F. unibracteata; 2: F. unibracteata.var. wabuensis; 3: F. cirrhosa; 4: F. przewalskii; 5: F. delavayi; 6: F. taipaiensis; 7: F. hupehensis; 8: F. ussuriensis; 9: F. pallidiflora; 10: F. walujewii; 11: F. thunbergii; 12: Mixed powder: It is a 1: 1 mixed powder of six original species and five adulterants of FCB, each of which accounts for 1/11
Establishment of Herb-Q methodologyIn the present study, mixtures of different proportions were prepared using powders of FCB and F. hupehensis. The linear relationship, LOD, and LOQ of Herb-Q were explored and evaluated for reproducibility and accuracy. The ITS 341 site was randomly chosen as the identification point to complete the methodological study.
Linearity, LOD and LOQ determinationA linear equation was established with the proportion (x) and allelic frequency (y) of F. hupehensis (base C) (Fig. 3A). The regression equation was y = 0.994 x + 0.002, and the R2 value was 0.9997 (> 0.99), indicating a good linear relationship (Fig. 3B). Accurate allele frequencies were obtained for specific sample proportions (except for 1%). However, the allele frequencies of the samples at 1% were not consistent with the expected values (Fig. 3C; Supplemental Table 7).
Fig. 3
Linear equation of herb molecular quantification (Herb-Q) method at ITS 341 site and its ten proportional pyrograms. A The standard pyrograms of ITS 341 site; B Linear regression equation of mixed samples of FCB and F. hupehensis, with the R2 = 0.9997 (≥ 0.99); C: The ten proportional pyrograms of mixtures at ITS 341 site; C1–C10 The ratio of hupehensis to FCB is 1, 2 4, 6, 8, 10, 20, 30, 40 and 50% (wt/wt) respectively. D LODs and LOQs for F. hupehensis adulteration in FCB by Herb-Q
The RSD were 131.8% and > 25% when the adulteration rate was 1% in the mixed samples. Hence, the LOQ of the Herb-Q was 2%. The LOD was determined to be 2%, as the stable detection of 2% adulteration in the mixed powder reached 95% (Fig. 3D; Supplementary Table 8).
Repeatability and accuracyTo further evaluate the reproducibility and accuracy of Herb-Q, mixed powders were prepared in specific proportions. The average allele frequencies differed by approximately ± 0% or 1%, and the RSDs were all below 25%, showing the good repeatability and accuracy of Herb-Q (Table 1).
Table 1 Verification results of quantification for samples with known proportions (n = 6)Quantitative analysis by Herb-QF. ussuriensis and F. thunbergii have recently been shown to be adulterated or mixed with FCB because of their high market output, low price, and similar bulbs. In this study, FCB, F. ussuriensis, and F. thunbergii were selected to construct the Herb-Q system.
Establishment of the quantitative standard curveMixed powders of FCB and F. ussuriensis were randomly selected as samples for a quantitative linear relationship study. The quantitative standard curve of ITS 341 site was established using Herb-Q based on the proportion of the mixed powders and the corresponding allele frequencies. Seven mixing ratios were prepared with the powder of FCB and F. ussuriensis, and their corresponding allelic frequencies are shown in the pyrograms (Fig. 4A). A linear equation was established with these seven proportions and the allelic frequency of the base T. The regression equation for the proportion of FCB (x) and allelic frequency of FCB was y = 1.0078 x + 0.0096, and the R2 value was 0.9988 (> 0.99), indicating a good linear relationship (Fig. 4B, C). Based on these results, a quantitative standard curve of ITS 341 site of FCB was successfully constructed using Herb-Q. In subsequent applications, the establishment of a quantitative linear relationship provides the basis for constructing a quantitative system.
Fig. 4
Pyrograms of different proportions at ITS 341 site and the coefficient of determination for linearity. A The standard pyrograms of ITS 341 site and the pyrograms of seven mixed powders of FCB and F. ussuriensis with the proportions of 0:100, 10:90, 30:70, 50:50, 70:30, 90:10 and 100%:0% (wt/wt); B Linear regression equation of mixed samples of FCB and F. ussuriensis, with the R2 0.9988; C Six allele frequencies and their average values of FCB in mixed powder at ITS 341 site
Calculation of quantitative resultsTo accurately calculate the actual weight of each constituent substance in the presence of non-adulterated impurities, three types of mixed powders were prepared, and the corresponding pyrograms were obtained (Fig. 5A1-8, B). Taking Sample 1 as an example, the weight of F. thunbergii was 0.1002 g, and the average allele frequency of base C was 54% at ITS 361 site, which can be deduced to be 0.2003 g of total weight of the mixed powder. Second, the genotype of FCB was T at ITS 341 site, with an average allele frequency of 34%. It can be inferred that the amount of FCB powder in the mixed powder was 0.0681 g, and the bias between it and the actual value was 6.907%, which was within the range of ± 25% (Fig. 5C–E). Similarly, for Samples 2 and 3, the biases between the measured and the actual values were 7.075% and 3.937%, respectively, within the range of ± 25% (Fig. 5C–E). The other results are shown in Supplementary Fig. 2. For non-adulterated species in the mixed powder, Herb-Q successfully quantified FCB and its adulterants with reasonable accuracy.
Fig. 5
Herb-Q to construct an absolute quantitative process. A1/A5 The standard pyrograms of ITS 361, and ITS 341 sites; A2/A6 The text pyrograms of wheat-flour in the samples at ITS 361, and ITS 341 sites; A3/A7: The text pyrograms of soil in the samples at ITS 361, and ITS 341 sites; A4/A8 The text pyrograms of wheat-flour and soil in the samples at ITS 361, and ITS 341 sites; B Composition and weight information of three samples; C Allele frequency of three samples at ITS 361 site; D Allele frequency of three samples at ITS 341 site; E Actual value, calculated value and bias of FCB in three samples
Quantitative analysis of cpms by Herb-QTo identify the adulteration of self-produced CPM, the prepared CPM was identified at ITS 341, ITS 361, and ITS 366 sites (Fig. 6A a1–6). At ITS 361 site, F. thunbergii had the C genotype and an allele frequency of 50%, and a total weight of 0.2002 g was deduced from its weight of 0.1001 g (Fig. 6A b). At ITS 341 site, FCB had the T genotype, corresponding to an allele frequency of 33%. Based on the total weight, the weight of FCB was determined to be 0.0661 g (Fig. 6A b). At ITS 366 site, the genotype of F. ussuriensis was G, the corresponding allele frequency was 20%, and the corresponding weight was 0.0400 g (Fig. 6A b). The biases of FCB and its adulterants were 0.762% and 0.138%, respectively, which are in the range of 25% (Fig. 6A c).
Fig. 6
The quantitative identification results of self-produced and commercial Chinese patent medicines (CPMs) by Herb-Q. A The figure contains the quantitative identification process of self-produced Shedan Chuanbei capsule (SDCB); a1, a3, a5: The standard pyrograms of SDCB at ITS 361, ITS 341, and ITS 366 sites; a2, a4, a6: The text pyrograms of self-produced SDCB at ITS 361, ITS 341, and ITS 366 sites; b: Pyrosequencing results of self-produced SDCB at ITS 361, ITS 341, and ITS 366 sites; c: Quantitative results of pyrosequencing of self-produced SDCB. B The figure contains the quantitative identification process of commercial SDCBs; a1: Qualitative results of pyrosequencing of commercial SDCB 3–5 and 8 at ITS 341 site; a2: Qualitative results of pyrosequencing of commercial SDCB 1–2 and 6–7 at ITS 341 site; a3: Qualitative results of pyrosequencing of commercial SDCB 1–2 at ITS 361, and ITS 366 sites; a4: Qualitative results of pyrosequencing of commercial SDCB 6–7 at ITS 361, and ITS 366 sites; a5, a6: Qualitative results of pyrosequencing of commercial SDCB 1–2 and 6–7 at matK 923, and matK 1173 sites; b: Quantitative results of pyrosequencing of commercial SDCB 1–8
To identify commercial CPMs, ITS 341, ITS 361, ITS 366, matK 923, and matK 1173 sites were used to qualitatively identify eight samples. First, the ITS 341 site was used to determine whether the samples were adulterated. At ITS 341 site, samples 1, 2, 6, and 7 contained bases T and C, while samples 3–5 and 8 only contained base T, indicating that samples 1, 2, 6, and 7 were adulterated, whereas the remaining samples were not (Fig. 6B a1, a2). Second, the types of adulteration in the samples were determined. At ITS 361 site, bases C and T existed in samples 1 and 2, and only base T was present in samples 6 and 7 (Fig. 6B a3). At ITS 366 site, samples 6 and 7 contained bases G and A, while samples 1 and 2 only contained base A (Fig. 6B a4). At matK 923 and matK 1173 sites, samples 1, 2, 6, and 7 did not contain the corresponding genotypes (Fig. 6B a5, a6). As a result, it could be determined that the adulterants in samples 1 and 2 were F. thunbergii, the adulterants in samples 6 and 7 were F. ussuriensis, and there was no adulteration in samples 3, 5, and 8 F. hupehensis was chosen as the external standard substance to be added into the samples for quantitative identification. According to the calculations, samples 1, 2, 6, and 7 contained approximately 0.22 g of FCB, and the weight of the adulterants varied from 0.05 g to 0.10 g, accounting for 9–15% of the total weight. Samples 3, 5, and 8 contained approximately 0.28 g of FCB, which conformed to the Chinese Pharmacopoeia standards (Fig. 6B b; Supplementary Table 9).
留言 (0)