
記住我


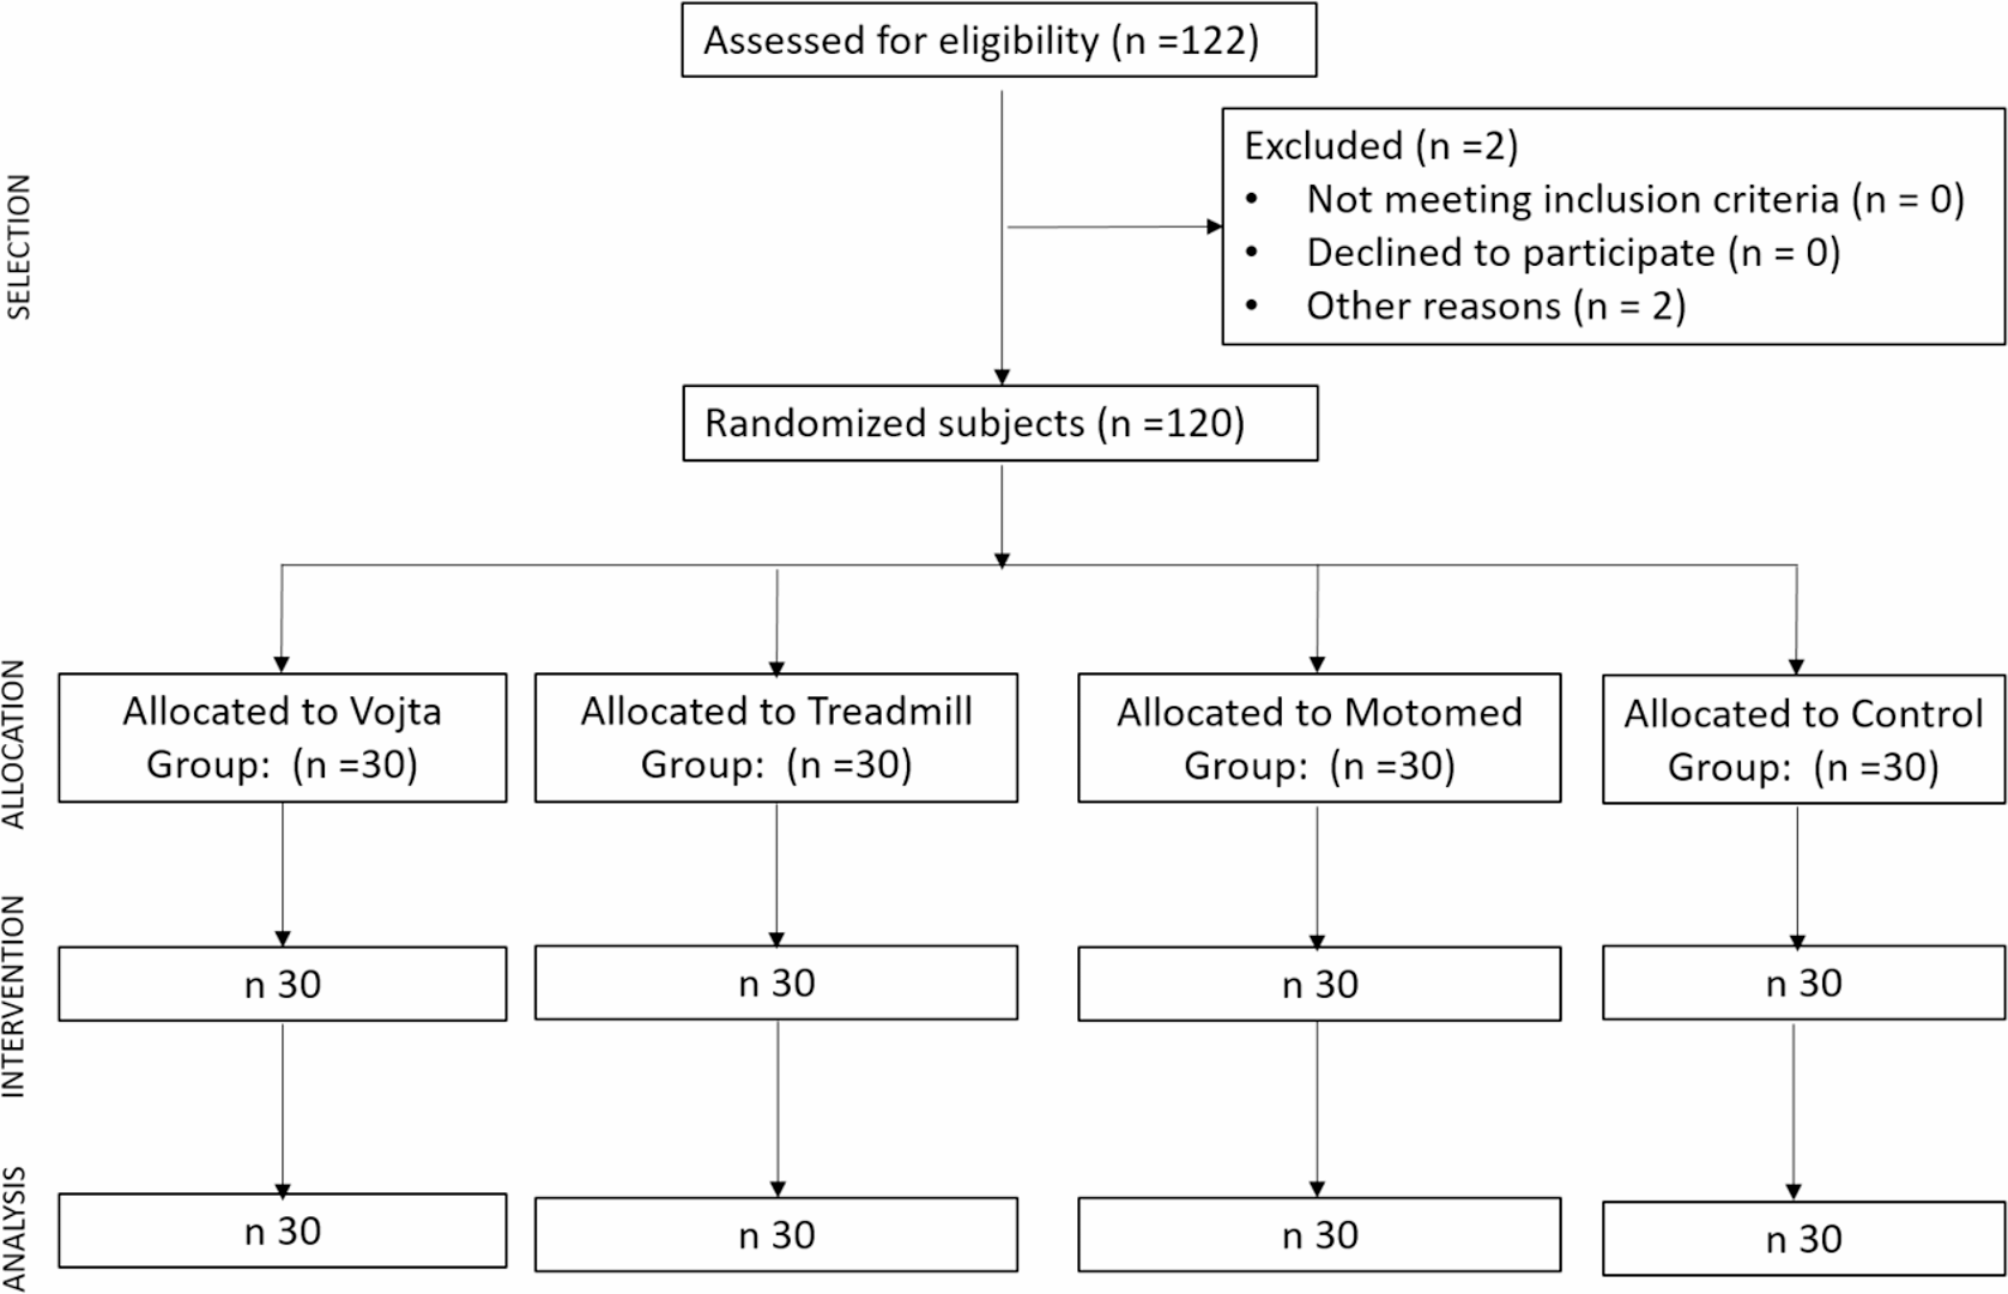

A double-blind randomised controlled trial (RCT) was designed with a pre-test and a post-test assessment (ClinicalTrials: NCT04689841). The Consolidated Standards of Reporting Trials (CONSORT) statement was consulted to help authors improve the reporting of the RCT. A non-probabilistic sampling of consecutive cases was performed. The effect size estimated for the main measure (time spent walking the first 3 m) was 0.30, considering a statistical power of 0.95 and an alpha error of 0.05 for the ANOVA tests of the four groups according to the G.power software (version 3.1.9). Accordingly, a minimum of 102 participants were needed. Accounting for a 10% potential loss, a sample size of 120 participants (30 per group) was considered for this study.
Fig. 1
The sample was recruited from the Universidad Europea de Madrid (Madrid, Spain). All able-bodied individuals who met the inclusion criteria were randomized into four study groups by a blind investigator —the Vojta group, the treadmill group, the Motomed group or the control group—using the QuickCalcs GraphPad® software with a computer-generated sequence.
Allocation was performed by a blinded investigator of any intervention and evaluations performed. Figure 1 shows the CONSORT flow diagram.
ParticipantsThe inclusion criteria were as follows: aged between 18 and 65 years; no neurological, cardiorespiratory, or systemic disease; able to complete the 10-meter walk test (10MWT) at a comfortable speed of 15 s; and able to perform a deep squat without assistance. The exclusion criteria were having a prosthesis in any extremity, not having undergone surgery in the last 3 months, pregnancy, having arthrodesis in any extremity, ankylosis or bone fixations in any extremity, soft tissue pathologies or range of movement limitations in the lower limbs.
All the subjects included in the present study were informed of the objectives, protocol and possible risks. All the participants voluntarily agreed to participate and provided their consent in writing. The protocol and informed consent provided to all the subjects were approved by the Research Ethics Committee of Rey Juan Carlos University (reference: 2404201908919). This randomised controlled trial was registered at ClinicalTrials.gov (Identifier: NCT04689841).
InterventionsThe participants were randomly distributed into one of the 4 intervention groups established (Fig. 1). Prior to group assignment, all the participants performed a voluntary gait on the ground (VoG) in a calibrated circuit following the 6MWT instructions [14] (Fig. 2 top-left).
Fig. 2
Interventions and voluntary gait pre-intervention (6MWT). Top left: voluntary gait on the floor (6MWT pre-intervention). Top-center: Motomed group (MG); Top-right: Treadmill group (TG). Bottom left: Vojta Group (VG) initial position (maximal flexion on the legs, facial arm: 135° arm flexion, 40° elbow flexion and the nuchal arm extending along the body). Bottom-right: Control group (CG)
Vojta group (VG)RLT was performed with a defined starting position (Fig. 2 bottom-left). The posture was changed reciprocally for a maximum of 7 min per side, twice on each side. The stimulation areas were located at the external protuberance of the calcaneus and gluteus area [6, 7]. Other areas, such as the trunk area and acromion, were stimulated, and the head and sacrum were guided resistance areas following the RLT technique [8]. Intervention was performed by a Physical Therapist specialized in the application of Vojta therapy with adults.
Motomed® group (MG)Motomed® Group (MG) muvi de Rech, a device for simultaneous and coordinated pedaling of legs and arms with servo-assistance, was used [15]. Active pedaling mode was programmed at a rate of no less than 60 revolutions per minute (rpm) for 30 min (Fig. 2 top center).
Treadmill group (TG)Walking was carried out on a treadmill brand BH model LK700WS with a walking surface of 550 × 1350 mm at a speed of 3 km/h for 30 min [16]. No additional weight suspension system was used, nor was the inclination gradient active on the treadmill (Fig. 2 top-right).
Control group (CG)The participants included in this group did not receive any kind of intervention and were asked to sit still in a chair for 30 min (Fig. 2 bottom-right).
Outcome measuresAll outcome measures were measured by two blinded investigators with respect to the interventions carried out.
6-minute walking test pre-intervention (voluntary)The 6MWT was performed on all participants following international recommendations. The subjects stood with their right foot forward and their weight resting on the left foot with a normal passage width, and voluntary walking started at his normal speed on the floor on a calibrated circuit [14]. We evaluated the distance covered, and we also extracted and evaluated the percentage of the step cycle executed, considering a single complete step as 100%. In addition, the time spent walking the first 3 m was also extracted and considered.
6-minute walking reflex test post-intervention (nonvoluntary)For the pre-intervention 6MWT, the participants started in the same starting position. The subject remained in this position following the command “STOP”, which was reinforced with a second command: “DO NOT MAKE ANY VOLUNTARY MOVEMENT”. After such instructions were given to all the subjects, the post-intervention 6MWT assessment began to assess the presence of AG. We evaluated the distance covered in meters and the percentage of the step cycle executed, considering a complete step as 100% of the cycle of an automatic walk (non-voluntary), in case this activation occurred in the post-intervention evaluation. The gait cycle is considered the sequence of movements that occur between two successive contacts of the same foot with the ground [3, 10]. The cutoff point to consider the presence of AG was established at 20% of the gait cycle in this study. This percentage corresponds to the initial single support stance phase.
Surface electromyography (sEMG)Measurements at the first 3 m of the 6MWT pre- and post-intervention (with a nonwalking command) were recorded. The distance was considered, and it was captured by the video camera in the sagittal plane for subsequent kinematic analysis with Kinovea® software.
A Biosignalplux® device for sEMG recording was used. The signal was amplified and digitized by a Biosignalsplux Hub 8-channel device (Plux Wireless Biosignals S.A., Lisbon, Portugal), transmitted and stored with OpenSignal software. All the measurements were taken only on one side (right), and 100% gait cycle data were obtained in each complete cycle on the measured side. Because able-bodied persons were recruited and able to walk (and both lower limbs would move through all phases of the cycle with practically the same activity), obtaining EMG data from both sides was not considered relevant since it was not intended to compare the activity between paired muscles. In addition, as the right side was in the foreground (closer to the rater camera), this side was completely visible in the sagittal plane for posterior analysis.
Surface ElectroMyoGraphy for the Non-Invasive Assessment of Muscles (SENIAM) [17] indications were followed to place the eight electrodes: the tibialis anterior (TA), soleus (SO), rectus femoris (RF), biceps femoris (BF), external abdominal oblique (EO), paraspinal (PV), mid trapezius (MT) and anterior deltoid (DA) electrodes.
sEMG data analysisIntergroup comparisons were performed. The AG threshold initiated in the 6MWT post-intervention was considered for all groups as a 20% gait cycle. Two gait cycle reciprocal events were selected for EMG contrast during the 6MWT before and after intervention. The first event corresponds to the right leg’s initial swing phase (IS), and the second event corresponds to the right mid-stance phase (MS) (Fig. 3).
EMG was captured at 1000 Hz and then processed in Matlab v2017b (The MathWorks Inc., Natick, Massachusetts, USA) according to standard procedure [18]. Initially, the first gait cycle was segmented and extracted from the total recording according to the manually annotated events. Then, the signal in that segment was subsequently detrended by subtracting any offset or linear trend. After that, a zero-phase 6th-order Butterworth digital filter was applied between 10 Hz and 495 Hz. The segment was then split into the two consecutive gait phases considered. Finally, for each gait phase segment, the envelope of the signal was extracted by computing the root mean square (RMS) in sliding windows of 150 ms (150 samples) and then normalized (division) to the maximum RMS value in each segment. Each segment was then quantified by the average normalized RMS value extracted. The described processing procedure was applied to each muscle signal individually. In summary, two average RMS values from each gait phase for each of the eight muscles were computed for each recorded session.
Kinovea ®The kinematics and spatiotemporal parameters of the 6MWT were analyzed before and after the intervention (indicating the order of not walking after the intervention to all the subjects), and the measurements were performed in synchrony with the sEMG measurements for the first 3 m of the 6MWT. Sagittal plane video recording with reflective markers in the assessed joints [19] was performed. Gait speed was measured during the first 3 m of the 6MWT, and stride length and hip, knee and ankle kinematics during the initial swing (IS) and midstance (MS) phases were measured in the right leg because they are reciprocal phases (Fig. 3). In addition, the step of the first cycle was recorded, expressed as a percentage, and executed within the first 3 m of the 6MWT.
Statistical analysisThe SPSS (version 23.0) statistical package was used for analysis. Demographic and biometric variables are expressed as the means and standard deviations for quantitative values. The qualitative variables are presented as percentages. MANOVA with Bonferroni adjustment was performed for between-group comparisons. For measures in which a normal distribution could not be assumed post-intervention (according to the Shapiro‒Wilk test), the Kruskal‒Wallis test was applied to each independent variable for comparison between groups. Nonparametric tests (Wilcoxon’s) were applied for related samples for intragroup analysis. The statistical analysis was performed with a 95% confidence interval, and the significant values were those with p < 0.05. The effect size was calculated via Cohen’s d.
The difference in the average EMG RMS values for each muscle between the different groups in the pre-intervention recordings was tested independently for the two gait phases by means of a multivariate analysis of variance (MANOVA). Pairwise differences were tested with the Bonferroni post hoc correction in the case of significant main effects. Statistical significance was considered as p < 0.05.
The difference in the average EMG RMS values for each muscle between the pre- and post-intervention recordings of the participants in the Vojta group who showed reflex locomotion was analysed independently for the two gait phases considered. For that purpose, the paired-samples t-test was applied after confirming the normality of the populations with the Shapiro‒Wilk test. Statistical significance was considered as p < 0.0005 (Bonferroni correction).
留言 (0)