Cell cultures and myoblasts immortalization
HEK293 cells were maintained with Dulbecco’s modified Eagle Medium high glucose (DMEM), supplemented with 10% Foetal Bovine Serum and 1% of penicillin-streptomycin (Thermo Fisher, Waltham MA, USA).
A myoblast immortalised DMD cell line with a deletion of exon 52 (DMD∆52) (ID: DMD638a) was provided by the Institute of Myology (Paris, France) and was the subject of the CRISPR/Cas9 gene edition. Additionally, immortalised human myoblasts derived from three healthy male donors’ biopsies (ID: AB1079 (C1), AB1190 (C2) and AB678 (C3) of 38, 16 and 53 years old respectively) were also provided by the Institute of Myology.
To create an immortalised culture (named Im∆45–55-D1), a biopsy of tibialis anterior from a 32-year-old male donor harbouring a del45–55 with specific intronic breakpoints (del45–55-D1), was obtained in La Fe University Hospital (Valencia, Spain) after informed consent (research ethics committee authorization 2018/0200). Primary human skeletal myoblasts were purified as previously described [38] and immortalized in collaboration with the Institute of Myology (Paris, France) to increase its proliferative capacity as follows: primary myoblasts were transduced with both hTERT and Cdk4 lentiviral vectors with a ratio of the number of transducing lentiviral particles to the number of cells (MOI) of 5 in the presence of 4 µg/ml of polybrene (Sigma-Aldrich, Sant Luis, MO, USA). Transduced cell cultures were selected with puromycin (0.2 µg/ml, Life Technologies, Carlsbad, CA, USA) for four days and neomycin (0.3 mg/ml, Life Technologies, Carlsbad, CA, USA) for ten days. Cells were seeded at clonal density and selected clones were isolated from each population using glass cylinders [36].
Human myoblasts were cultured with Skeletal Muscle Cell Growth Medium (SMC) (PELOBiotech, Planegg, Germany). Differentiation medium (DM), when needed, was prepared with DMEM, supplemented with 2% of Horse Serum and 1% of penicillin-streptomycin (Thermo Fisher, Waltham MA, USA).
Cell proliferation assay
A total of 5000 primary and immortalized myoblasts (derived from the patient 45–55) per well were seeded in 96-well plates and were incubated at 37º C in a humidified chamber with 5% CO2 for 24, 48, 72, and 96 h in SMC medium. Cell proliferation was measured using the CellTiter 96 aqueous non-radioactive cell proliferation assay (MTS) (Promega, Madison, WI, USA) as previously described [39].
CRISPR-Cas9 design and gRNA selection
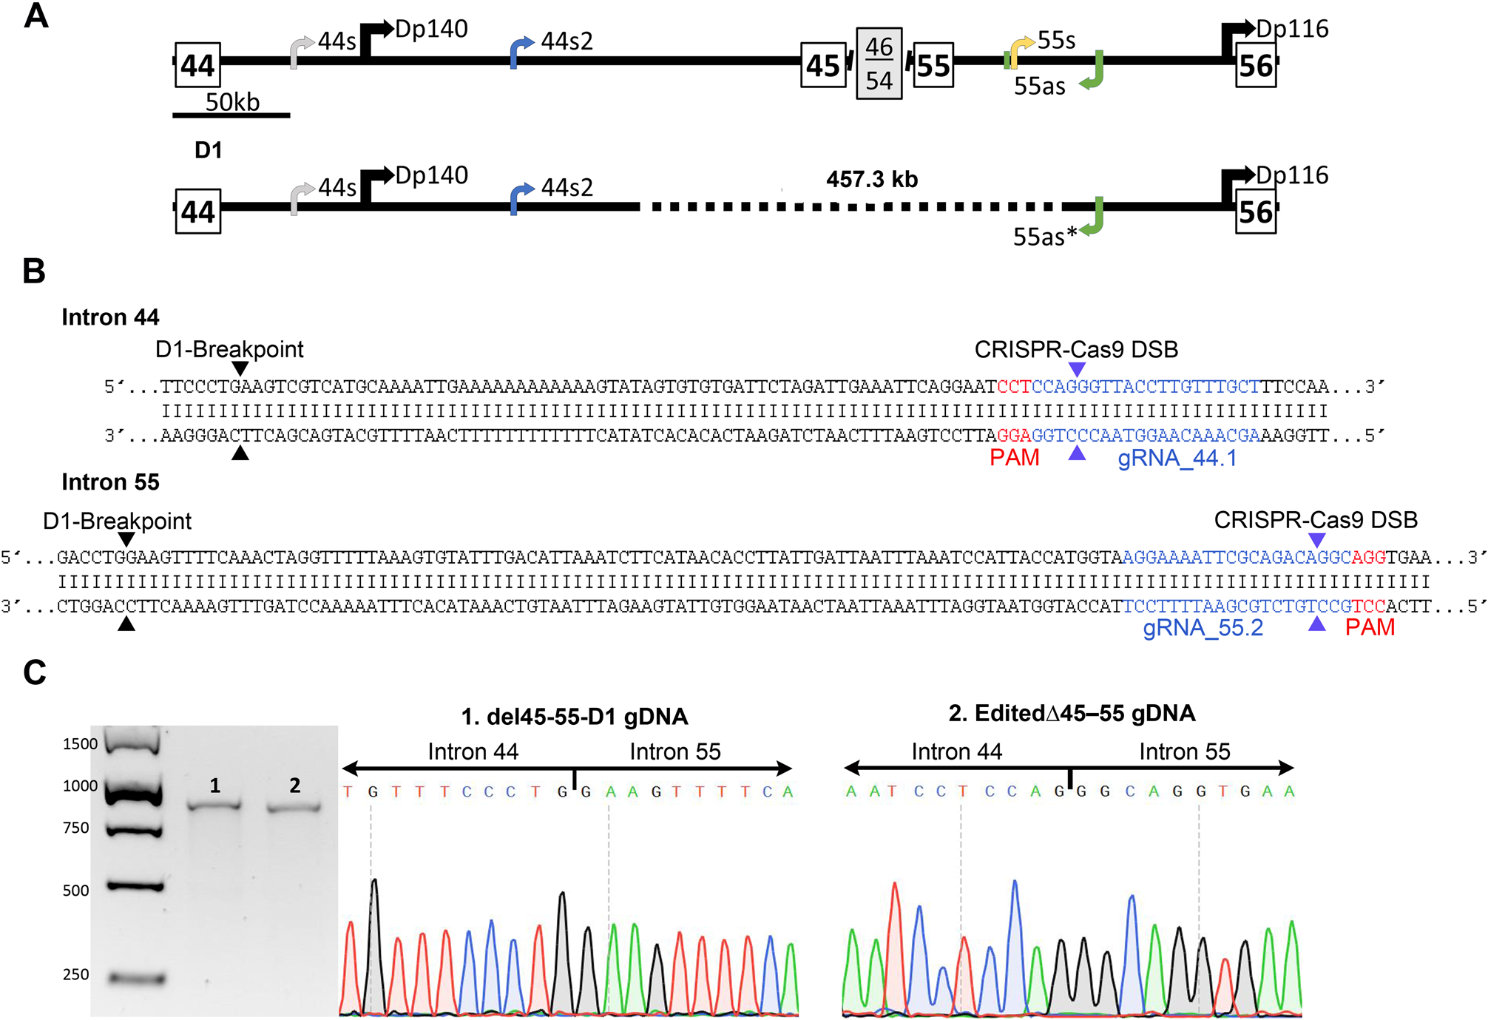
Two gRNAs were designed to target the vicinity of each breakpoint in intron 44 and 55 of the del45–55-D1 (ChrX:32056814 and ChrX:31599476 respectively, according to the human genome reference GRCh37/Hg19), using the Zhang lab designing tool (crispr.mit.edu). The genomic location and the sequence of the four gRNAs can be found in Table S1.
Each gRNA was cloned into a plasmid containing spCas9 and EGFP sequences (PX458; Addgene 48138) [40]. To assess the cleavage efficiency of the sgRNAs, 1.5ug of each plasmid was transfected independently into HEK293 cells using Lipofectamine 3000 (Invitrogen, Carlsbad, CA, USA). Forty-eight hours after transfection, the genomic DNA was extracted (QIAamp® DNA Mini Kit, Qiagen) amplified using primers hybridising in the proximity of the cleavage site (Table S1), and the PCR products were purified. The T7E1 assay was then performed and indel frequencies were calculated as previously reported [41].
The two selected gRNAs (gRNAs_44.1 and 55.2), targeting intron 44 and 55 breakpoints) were co-transfected into HEK293 cells (1.5ug of each plasmid) to evaluate the production of the DMD del45–55-D1. Forty-eight hours after co-transfection, cells’ DNA was extracted and amplified by PCR (using ∆45–55-D1 screening primers) and subsequently sequenced using Sanger sequencing (Table S1).
Generation of edited clones with the del45–55-D1 (Edited∆45–55)
The immortalised DMD∆52 myoblasts were co-transfected with 1.5ug of each plasmid containing the selected sgRNAs using Viafect™ (Promega, Madison, WI, USA) transfection reagent (1:5 ratio). Forty-eight hours after transfection, fluorescence activated cell sorter (FACS) was applied to seed individually the GFP positive cells into 96 well plates and amplified to form homogeneous clonal cell cultures as previously described [37]. The DNA was extracted from the successfully grown clones, analysed by PCR and resolved on a 1% agarose gel to detect those harbouring the del45–55-D1 (Table S1). One edited clone, named “Edited∆45–55” was expanded for further for characterisation analysis. These experiments were carried out at Biobizkaia HRI, Barakaldo, Spain (NAT-RD group).
On-target and off-target analysis
In order to identify any potential off-targets that might be produced by the gRNAs_44.1 and 55.2 (containing up to three mismatches), Cas-OFFinder tool was employed [42].
Amplicon high-throughput sequence analysis was conducted to evaluate the on-target efficiencies and the potential off-target events. The off-target analysis was conducted using DNA from DMD immortalised myoblasts that had been co-transfected with both sgRNAs. For the on-target analysis DNA from DMD myoblasts transfected with the sgRNA of interest (either 44.1 or 55.2) was used in each case. DNA from DMD untransfected myoblasts was used as control for each target locus. A two-step PCR strategy was employed to generate the library. For the first PCR (PCR1), primers for each locus contained an adapter sequence. PCR products were purified using AMPure Beads (BD Bioscience, Franklin Lakes, NJ, USA). For the second (PCR2), PCR products were re-amplified with primers containing the adapter sequence overlapping the first primers, and with an index sequence in the reverse primer. Final PCR products were purified with AMPure Beads. The library was prepared with the PCR products pooled in equimolar amounts following the manufacture’s protocol, and loaded in a Micro MiSeq Reagent Kit v2 (500-cycles) (Illumina, San Diego, CA, USA) on a MiSeq platform (Illumina). The fastaq.gz files were analysed using the CRISPResso2 software to evaluate the edition efficiency and potential off-target effects, using default parameters. The primers used for the PCR1 and PCR2 are listed in Table S2.
Additionally, we analysed the potential off-targets of the selected clone used for the functional characterisation by Sanger sequencing (using PCR1 primers without the adapter sequence, Table S2).
RNA analysis
RNA was extracted from differentiated cell cultures (at day 0, 2, 5 and 7 of differentiation) after being pelleted (RNeasy mini kit, Qiagen, Hilden, Germany). Reverse transcription was performed using 1 µg of total RNA and with SuperScript IV Reverse Transcriptase (Invitrogen, Waltham, MA, USA) and nested PCR of cDNA samples was carried out using specific primer pairs (hybridising in DMD exons 41 and 60 (RT-PCR1) and in exons 43 and 59 (RT-PCR2); Table S1) as previously described [27]. The PCR products were analysed on 1% agarose gels, DNA was purified (Gel Extraction Kit; Omega Bio-Tek, Norcross, GA, USA) and validated via Sanger sequencing.
Duplex droplet digital PCR (ddPCR) was performed with 2 µl of cDNA using the QX200 Droplet Digital PCR system (Bio-Rad Laboratories, Hercules, CA, USA), as previously described [27] for the detection of: dystrophin (probe ID: dHsaCPE5049433, HEX labelled, Bio-Rad), Pax7 (probe ID: Hs.PT.58.19502533, FAM labelled. IDT); Myf5 (probe Id: Hs.PT.58.20820798, FAM labelled, IDT); MyoD (probe ID: Hs.PT.58.39155876, FAM labelled, IDT) and Myh3 (probe ID: Hs.PT.58.45297783, HEX labelled). TBP (probe ID: Hs.PT.58v.39858774, HEX labelled, IDT) and HPRT1 (probe ID: Hs.PT.58v.45621572, FAM labelled, IDT) were used for expression normalisation.
Cell cultures immunofluorescence
For all immunodetections, 2.5 × 10⁴ myoblasts /well were seeded in 24-well plates and, after 0, 2, 5 and 7 days differentiating into myotubes, cells were fixed in 4% paraformaldehyde. The cell cultures were permeabilised with PBS-T (0.1% X-TritonX-100 in PBS 1X) and blocked for 1 h at room temperature (RT) in PBS-T, 1% BSA, 1% normal goat serum (blocking buffer) before incubation with primary antibodies, diluted in blocking buffer, overnight at 4 oC. For dystrophin immunostaining, a mixture of three mouse monoclonal antibodies at 1:50 dilution was used: NCL-Dys1 (Novocastra Laboratories, Newcastle Upon Tyne, UK), Mandys1 and Mandys106 (The Wolfson Centre for Inherited Neuromuscular Disease). For myosin heavy chain detection (MyHC), a mouse monoclonal anti-MyHC antibody was used (MF20, 1:50, DSHB, University of Iowa, IA, USA) and for desmin detection, a rabbit polyclonal anti-desmin antibody (1:200, Abcam, Cambridge, UK) was utilised. Following a PBS-T wash, cells were incubated with the appropriate secondary antibody: goat anti-Mouse IgG (H + L) Alexa Fluor Plus 488 and goat anti-rabbit IgG (H + L) Alexa Fluor Plus 488 (1:200, Thermo Fisher). Subsequently, samples were mounted with VECTASHIELD® mounting medium containing DAPI (Vector Laboratories, London, UK) for the detection of the nuclei. Images were acquired in an LSM800 confocal microscope (Zeiss) at 100x magnification.
The fusion index was calculated as the percentage of nuclei within myotubes (> 2 nuclei) out of the total number of nuclei in Desmin-positive cells (10 micrographs per condition), and the myotube diameter was calculated in parallel. The differentiation index was calculated as the percentage of nuclei within MyHC-positive myotubes out of the total of nuclei (10 micrographs per condition) as we previously described [39].
Protein quantification
In-cell western assays (myoblots) were performed as previously described [43, 44]. Briefly, the cultures were seeded in 96-well plates and differentiated for 7 days. Plates then were fixed with ice-cold methanol, permeabilised with PBS-T, blocked (Intercept (PBS) blocking buffer, LI-COR® Biosciences, Lincoln, NE, USA) and incubated with primary antibodies overnight at 4oC. For dystrophin detection, the mixture of the three primary antibodies described above (NCL-Dys1, ManDys1 and ManDys106, 1:100 each) was used. On the subsequent day, the plates were incubated with the secondary antibody. The secondary antibody, IRDye 800CW goat anti-mouse 1:500, was prepared together with CellTag 700 Stain (LI-COR® Biosciences) at 1:1000 dilution and incubated for 1 h at RT and protected from light. After incubation, plates were analysed using the Odyssey® M Imager (LI-COR® Biosciences).
Western blot quantification was performed on cultures seeded in P6 plates (2.5 × 10⁵ cells/well) and differentiated for seven days. The cell pellets were then collected and solubilized in lysis buffer [45]. Protein concentration was determined using the BCA Protein Assay (Thermo Fisher, Waltham MA, USA). Samples were loaded onto a NuPAGE® Novex® 3–8% Tris-Acetate (Thermo Fisher, Waltham MA, USA) and run at 100 V during 5 h. Protein wet transference onto 0.45 μm nitrocellulose membrane was carried out at 20 V for 18 h at 4 oC. Then, membranes were blocked in 5% non-fat dry milk diluted in TBST (0.1% Tween20) for 1.5 h at RT and incubated overnight at 4oC with primary antibodies: anti-dystrophin antibody (NCL-Dys1, 1:40, Novocastra Laboratories) and anti-alpha actinin antibody (A7732, 1:3000, Sigma-Aldrich). The membranes were incubated with the secondary antibody sheep anti-mouse IgG (H + L) (ab6808, 1:2000, Abcam) for 1 h in dark. Membranes were revealed using SuperSignal™ West Pico PLUS (Thermo Fisher, Waltham MA, USA) using an Amersham Imager 600 (GE Healthcare, Chicago, IL) imaging system. Bands’ intensities were quantified with the ImageJ software (NIH, Bethesda, MD, USA). The dystrophin signal was normalised to the alpha-actinin signal.
Statistical analysis
Mann–Whitney U, Kruskal-Wallis and linear regression tests were used to determine the statistical significance of the obtained data. Statistical analysis was performed using GraphPad Prism 6 software.


留言 (0)