Participants
Participants (32 healthy boys and girls aged 12–14 y, with no known illnesses, pre-existing injuries, or disabilities) were recruited through advertisements on social media platforms (including sponsored advertisements) from October 2022 to September 2023. Parents of potential participants were sent information sheets and a screening questionnaire to deem eligibility. The study received ethics approval from the University of South Australia Human Research Ethics Committee (Ethics no. 204723) and was conducted in accordance with the Declaration of Helsinki. Written consent and assent were obtained from the parent/legal guardian and participants, respectively.
Procedures
Participants completed three exercise trials in a non-randomised order: a graded exercise test (GXT), followed by two submaximal modified 20mSRTs. Each trial was separated by a minimum of 48 h (median = 12 days [IQR, 7–22 days]). The ordering of the exercise trials was kept consistent between participants (i.e. non-randomised) to allow ‘perceptual anchoring’ and to give participants an opportunity to physically experience and familiarise themselves with the range of sensations that correspond to a given RPE level (Eston and Lamb 2000). Height and mass were recorded using a stadiometer (SECA 213, Ecomed, NSW, Australia) and scales (BC-148, Tanita, Tokyo, Japan) during the first visit.
Graded exercise test
On the first visit to the laboratory, a GXT to volitional exhaustion was conducted on a motorised treadmill (PPS Med 55, Woodway USA Inc., WI, USA) to assess peak oxygen uptake (VO2peak). The attainment criteria for a maximal effort during the GXT were: a respiratory exchange ratio (RER) ≥ 1.0, reported RPE at 9 or 10, and ≥ 90% of age-predicted maximal HR based on Tanaka et al. (2001) prediction equation (HRmax = 208 − 0.7 * age) (Armstrong and Fawkner 2007). Before commencing the GXT, participants were given demonstrations of safety procedures and familiarised with the treadmill. The GXT commenced at 4 km/h and increased by 1 km/h every minute up to 8 km/h, whereafter the speed increased by 0.5 km/h (Kasai et al. 2023). The treadmill gradient was kept constant at 1% to replicate the energy cost of overground running (Jones and Doust 1996). Breath-by-breath respiratory gas data were collected (Metalyzer 3B; Cortex Biophysik GmbH, Leipzig, Germany) with a paediatric face mask (Hans Rudolph Inc., Kansas, USA). Participants reported their RPE and affect using the Eston–Parfitt RPE scale and Feeling scale, respectively, during the last 15 s of each minute.
Modified 20-m shuttle-run test
On the second and third visit, participants performed the modified 20mSRT protocol individually to ascertain test–retest reliability. Prior to starting each trial, participants were informed that the test would stop when they reported a 6 on the E–P scale. The modified 20mSRT protocol started at 4 km/h and increased by 1 km/h every minute up to 8 km/h, whereafter the speed increased by 0.5 km/h every minute. Participants reported their RPE and affect prior to starting each trial and during the last levels of each stage prior to beginning the next speed, until they reported a 6 on the E–P scale, when the test was stopped.
Data from this study were compared with the study of Kasai et al. (2023) involving 25 children (n = 14 boys, n = 11) aged 12–14 years, which followed the same exact methodology, with the exception of the submaximal end point of EP7.
MaterialEston–Parfitt RPE scale
The Eston–Parfitt (E–P) RPE scale was used to measure perceived exertion during all three trials. The E–P scale is a pictorial 0–10 scale that shows characters at several stages of exertion along a progressively increasing slope with verbal anchors ranging from 0 (“very, very easy”) to 10 (“so hard I am going to stop”). The E–P scale has previously demonstrated good reliability in the production of exercise intensity (ICC = 0.71–0.76) (Eston and Parfitt 2007) and has been validated for quantifying overall perceived exertion in children during treadmill exercise (R2 = 0.96) (Lambrick et al. 2011) and overground running (Lambrick et al. 2013).The E–P scale has previously been used to predict VO2peak in children during a laboratory-based graded exercise test (Lambrick et al. 2016) and in our recently published work that utilised the E–P scale during a 20mSRT that was terminated at EP7 (Kasai et al. 2023).
Feeling scale
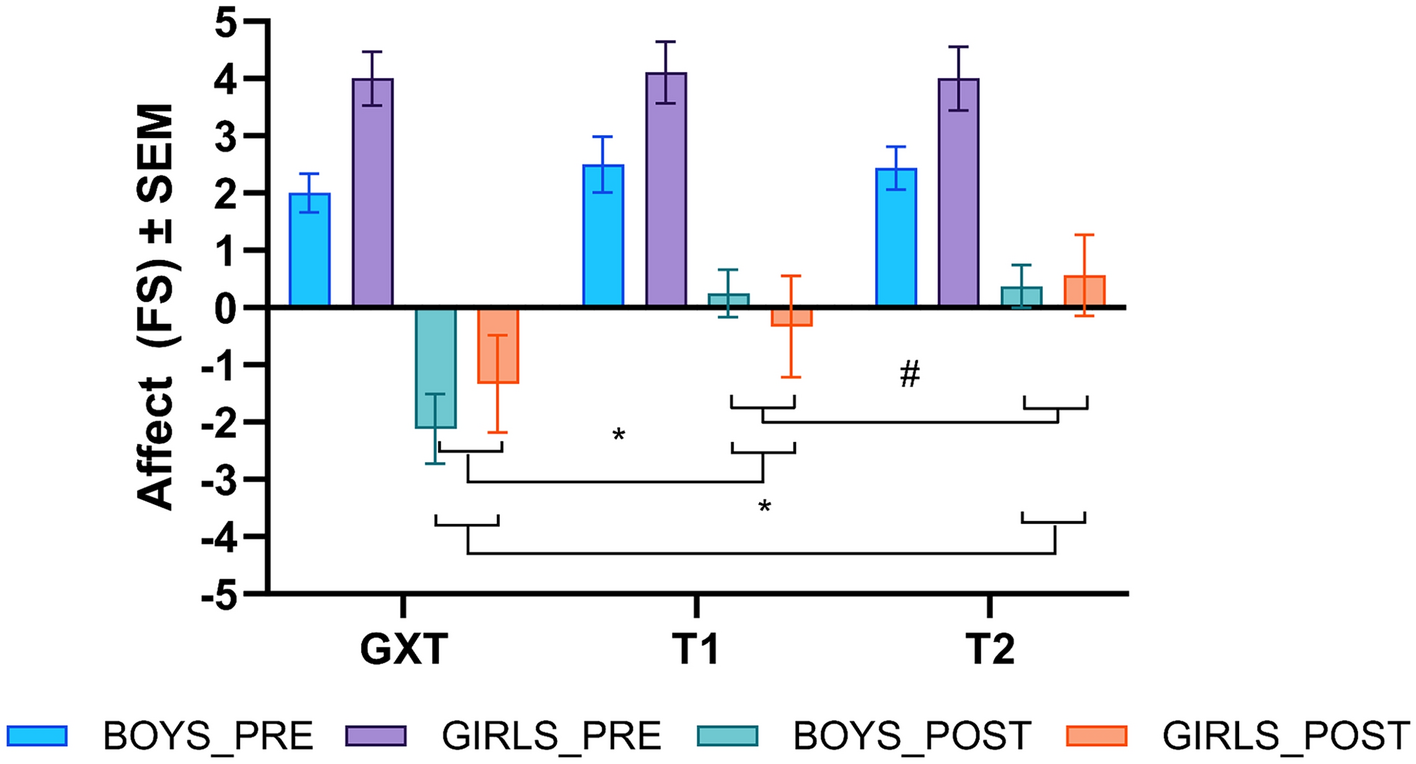
Affective valence during each trial was recorded using the ‘Feeling scale’ (FS) (Hardy and Rejeski 1989). The FS is an 11-point numerical scale ranging from − 5 (very bad) and 0 (neutral) to + 5 (very good). The FS has been successfully used in studies with children to assess affective valence (Sheppard and Parfitt 2008; Schneider et al. 2009; Schneider and Graham 2009; Benjamin et al. 2012; Kasai et al. 2023).
Participants were introduced and re-familiarised on how to employ both the E–P scale and the FS prior to starting each session.
Data analysis
Breath-by-breath data from the GXT were collapsed into 10-s bins. VO2peak was determined as the highest 10-s value observed. Independent samples t tests were conducted using SPSS (ver.28, IBM Analytics, USA) to examine sex differences on descriptive physiological data. A significance level of 0.05 was set for all statistical analyses. Where sphericity was violated, the Greenhouse–Geisser correction factor was applied. Repeated measures planned comparisons were conducted to identify main effects or interactions.
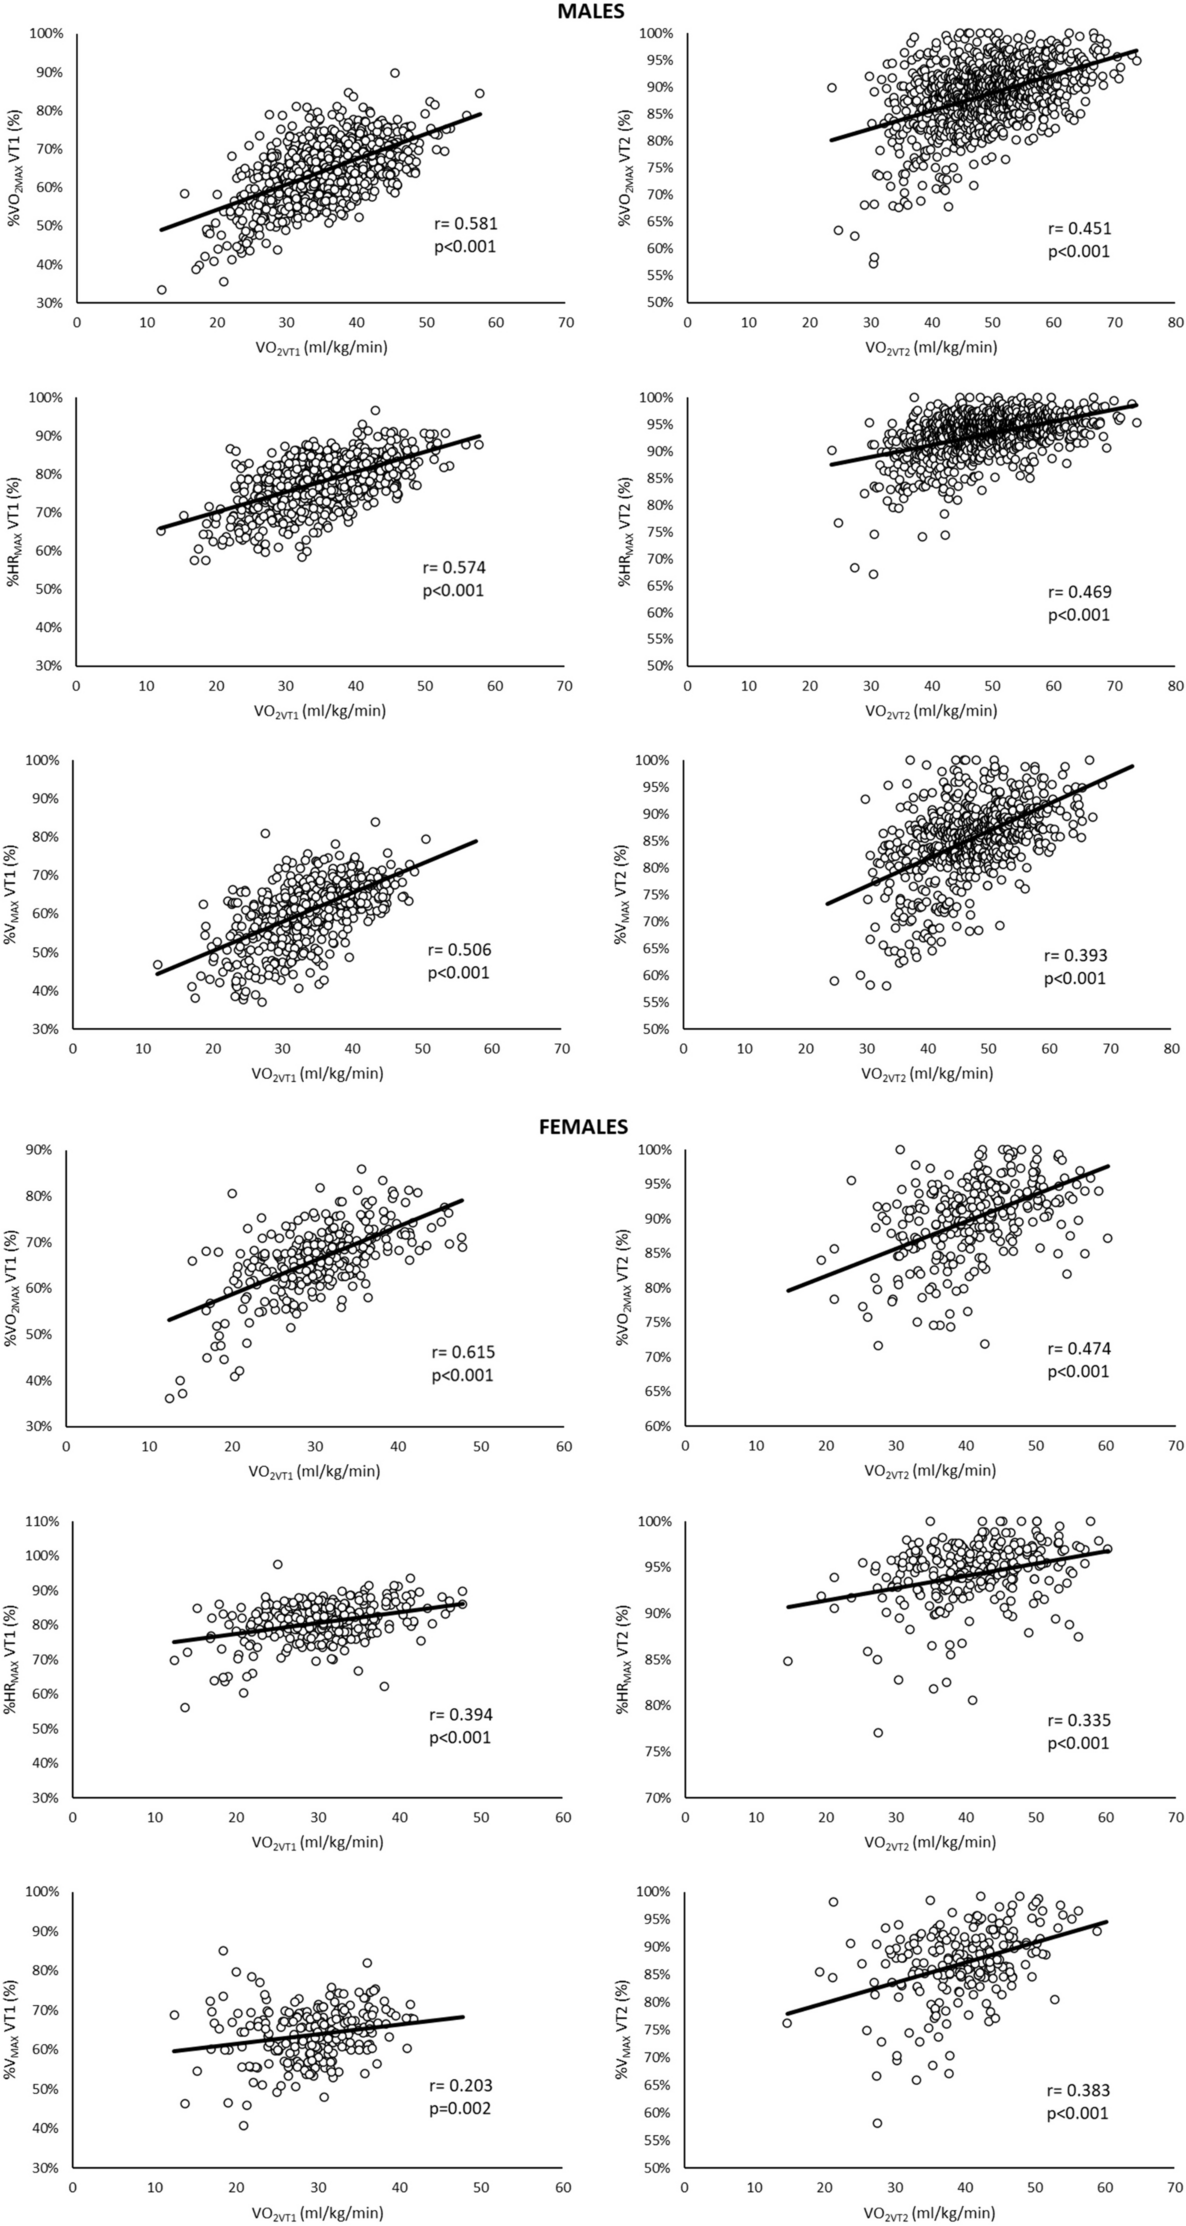
Validity of VO2peak predictions from submaximal 20mSRT
To examine the validity of predicting VO2peak using RPE reported during the submaximal 20mSRT, a linear regression analysis was performed using Microsoft Excel ver. 2308 (Microsoft Corp, Redmond, USA). RPE and the corresponding speed after 8 km/h during the 20mSRT were linearly regressed to obtain the constant and b-coefficient. The linear regression was then extrapolated to EP9 and 10 to predict peak speed. Peak speed values at EP9 and 10 were then used to estimate VO2peak using ACSM’s metabolic equation (ACSM 2007). Extrapolation end points of EP9 and 10 were used as children typically report terminal RPE values that are lower than the absolute maximal values following termination of a maximal bout of exercise (Lambrick et al. 2011). Measured VO2peak from the GXT and estimated VO2peak at both EP9 and EP10 from the first modified 20mSRT trial were analysed via a two-factor repeated measures analysis of variance (ANOVA) [Sex(2) x Test(3)] using SPSS.
Test–retest reliability of the submaximal 20mSRT
The test–retest reliability between the two submaximal 20mSRT trials were examined by calculating a two-way mixed effects intraclass correlation coefficient (ICC) based on a single measurement, on predicted peak speeds at EP9 and EP10 via SPSS. ICC estimates were used to interpret the results. Specifically, values less than 0.5 indicate poor reliability, 0.5–0.75 indicate moderate reliability, 0.75–0.9 indicate good reliability, and values greater than 0.9 indicate excellent reliability (Koo and Li 2016).
Affective responses analysisSubmaximal 20mSRTs at EP6 vs. GXT
To assess the difference in affective responses during each trial, a three-factor mixed-model ANOVA [Sex (2) × Time (2) × Trial (3)], with repeated measures on Time and Trial was conducted.
Comparison between two submaximal 20mSRT protocols
A two-factor MANOVA [Sex (2) × Protocol (2)] on descriptive physiological data was conducted to analyse the difference between the two sample groups at EP6 (current study) and EP7 (Kasai et al. 2023). To examine the difference in end-test affective responses between the two submaximal 20mSRT protocols that were stopped at EP6 (current study) and EP7 (Kasai et al. 2023), a four-factor mixed model ANOVA [Protocol (2) × Sex (2) × Trial (2) × Time], with repeated measures on Trial was conducted.
Finally, the interindividual variability in affective responses between the two submaximal 20mSRT protocols were assessed by analysing the range of negativity in FS scores reported and a frequency count of the number of individuals who reported negative affective responses.


留言 (0)