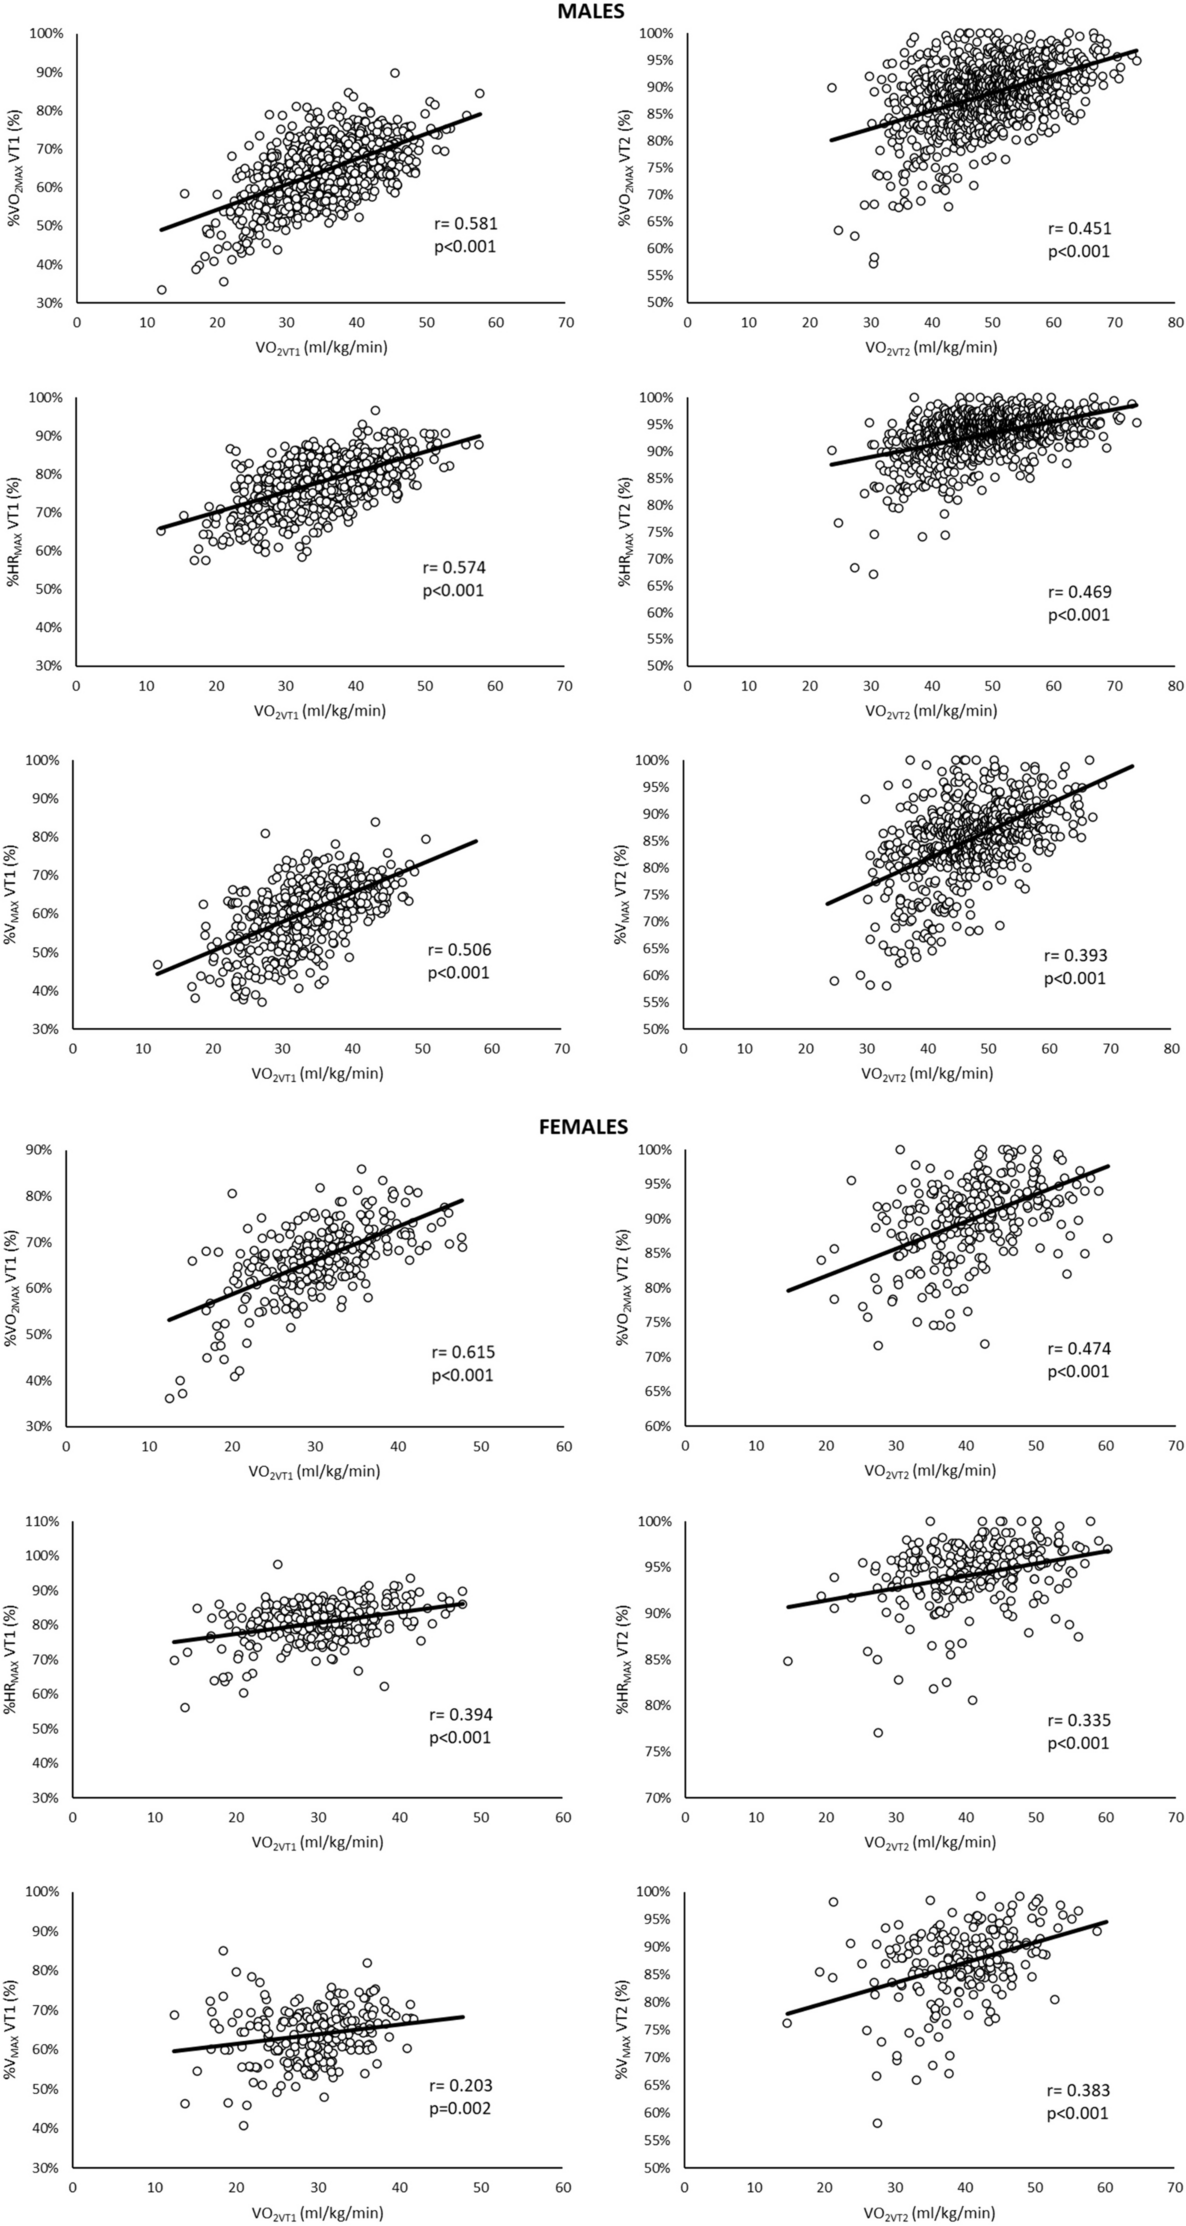
The key findings of this study revealed a very weak or no correlation between VO2max and the percentages of maximum at which thresholds occur (%VO2max VT1 and VT2, %HRmax VT1 and VT2, %Vmax VT1 and VT2). However, there was a correlation between VO2VT1 and %VO2max VT1, %HRmax VT1, and %Vmax VT1, as well as between VO2VT2 and %VO2max VT2, %HRmax VT2, and %Vmax VT2. These results indicate that the physiological determinants influencing the percentage of maximum at which VT1 and VT2 occur are more closely associated with VO2VT1 and VO2VT2, respectively, rather than with VO2max. Moreover, the percentages of VO2max, HRmax, and Vmax at which thresholds occur were higher in individuals with higher training status. This suggests that the conventional approach of establishing exercise intensity relative to maximum may not effectively standardize intensity across individuals with differing training statuses. These findings contribute to a better understanding of the factors influencing the wide variability of threshold positions and aid in determining exercise intensity based on training zones in individuals with diverse training statuses. Furthermore, the data from this study can serve as standard reference values for these variables in relation to training status, facilitating the interpretation of an individual’s fitness level. The novelty of this work lies in the classification of individuals, which is particularly relevant as detecting the effect of training status on threshold positions necessitates considering oxygen consumption the three main physiological points (VT1, VT2, and VO2max). Conversely, if only VO2max is considered, as is traditionally done, no effect of training status on threshold positions is observed. In addition, this novel classification of individuals helps establish reference values for the variables reported in this article according to training status.
In the present study, a very low correlation was found between VO2max and the percentage of maximum at which VT1 and VT2 occur. This could be attributed to the possibility that when specifically training to enhance VO2max, improvements in VO2max may outpace those in VO2VT1 or VO2VT2. In essence, VO2max could be diverging from VO2VT1 or VO2VT2, thereby reducing %VO2max VT1 and VT2. Conversely, a correlation was observed between VO2VT1 and VO2VT2 and the position of the respective thresholds relative to VO2max, HRmax, and Vmax. This finding is relevant because relying solely on VO2max fails to capture the impact of training status on other submaximal variables (e.g., %VO2max VT1 and VT2). This indicates that VO2max alone may not adequately distinguish certain critical submaximal variables, such as %VO2max VT1 and VT2. Moreover, the decision to consider VO2VT1, VO2VT2, and VO2max instead of exclusively utilizing VO2max appears highly pertinent. This is because the oxygen consumption at thresholds has been shown to hold considerable importance for both health and performance, sometimes even surpassing the significance of VO2max (Poole et al. 2021). Therefore, we opted to classify participants by combining VO2VT1, VO2VT2, and VO2max. We provide a practical tool incorporating reference standard values based on specific training statuses at the three physiological points, aiming to aid in participant classification according to training status at these key physiological points (see Figure S1).
In terms of %VO2max at the thresholds, we observed higher %VO2max VT1 and VT2 with increasing training status. This suggests that greater proportional improvements (greater responsiveness) occur in VO2VT1 or VO2VT2 compared to VO2max as training status improves. We hypothesize that this phenomenon can be attributed to the specificity of training principle, which posits that adaptations primarily occur at the specific intensity at which training is conducted. Given that endurance athletes typically adhere to a pyramidal training intensity distribution (with decreasing training volume from moderate to heavy to severe zones) (Zapico et al. 2007; Casado et al. 2022), it seems reasonable to assume that VO2VT1 or VO2VT2 experience greater enhancement compared to VO2max. An alternative explanation could be the differing impact of genetics on VO2max versus VO2VT1 or VO2VT2. There is evidence indicating a significant genetic influence on VO2max (Williams et al. 2017), although the impact on VO2VT1 or VO2VT2 remains unclear. Our findings align with a previous study that observed higher %VO2max VT1 and VT2 in well-trained compared to recreationally trained runners (Hetlelid et al. 2015). Furthermore, the present results are aligned with another study observing that %VO2max VT1 and VT2 differed between professional, U23 and junior cyclist (Alejo et al. 2022). In addition, our results are consistent with another study that noted VT1 and VT2 occurred at higher percentages of VO2max as the training season progressed (Zapico et al. 2007). Contrary, another study found a similar percentage of maximum at which LT occurred between runners of different competitive levels (Støa et al. 2020). In a study by Iannetta et al. (Iannetta et al. 2020), it was specified that the percentage of VO2max at which lactate threshold (%VO2max LT1) and maximal lactate steady state occur (%VO2max MLSS), reflections of VT1 and VT2 when measuring lactate, respectively, did not differ among individuals with different fitness levels. They based this assertion on the lack of correlation between VO2max and the position of the thresholds (%VO2max LT1 and %VO2max MLSS) found in their study (Iannetta et al. 2020). We also observed this lack of correlation between VO2max and %VO2max VT1 and VT2 in the present study. Iannetta et al. suggested that the lack of correlation may be due to the narrow range of VO2max in their study, but this does not seem to be the case because we also found this lack of correlation with a much broader range of VO2max in the present study. In addition, Iannetta et al. (Iannetta et al. 2020) perfectly noted that the lack of correlation could be because the physiological determinants of VO2max are not the same as the physiological determinants of the thresholds. We addressed this issue by evaluating the association between VO2VT1 and VO2VT2 with %VO2max VT1 and %VO2max VT2, respectively, finding a positive association. These results demonstrate that the physiological determinants of %VO2max VT1 and %VO2max VT2 are more closely related to VO2VT1 and VO2VT2, respectively, than to VO2max. Overall, individuals with a higher specific training status at VT1 and VT2 exhibit a rightward shift in the position of the respective thresholds. Hence, a higher %VO2max VT1 and %VO2max VT2 appear to be adaptations to training. Therefore, we propose them as possible indicators to assess an individual’s progress. However, we do not recommend solely evaluating an individual’s progress or making training decisions based on %VO2max VT1 or VT2, as threshold positions depend on VO2max. Thus, a higher %VO2max VT1 or VT2 could result from a lower VO2max with similar VO2VT1 or VO2VT2, respectively, and this does not necessarily indicate an improvement in training status. The changes in %VO2max VT1 or VT2 with training status observed in our data do not support the recommendations of general guidelines that establish exercise intensity based on percentages of VO2max (Haskell et al. 2007; Garber et al. 2011), since a specific percentage of VO2max could elicit different physiological responses as %VO2max VT1 or VT2 change with training. In other words, at the same percentage of VO2max, individuals with different training statuses (different %VO2max VT1 or VT2) could be in different training zones.
Regarding heart rate, we observed higher HRVT1 and HRVT2 with increasing training status, independently of age. This suggests that HR at the thresholds is sensitive to changes in training status, this interpretation should be taken with caution because this is a cross-sectional study and a longitudinal study would be necessary to confirm this. This finding is the most controversial, as previous studies have reported no significant changes in HR at the thresholds with training over a season (Lucía et al. 2000; Zapico et al. 2007, 2014). One possible explanation is that it may take more than one season to observe changes in HR at the thresholds. If this is true, a single incremental test per season would suffice to determine training zones based on HR data, while additional tests would be necessary to adjust training zones based on HR as training progresses over the years. However, the amount of time needed for training to affect HR at thresholds is currently unknown. Regarding HRmax, there were no significant differences across training statuses. This result aligns with a previous study that found similar HRmax in well-trained compared to recreationally trained runners (Hetlelid et al. 2015). Moreover, it is supported by previous studies that observed similar HRmax with training over a season (Lucía et al. 2000; Zapico et al. 2014).
Due to the higher HRVT1 and HRVT2 and the lack of difference on HRmax according to training status, %HRmax VT1 and VT2 was significantly higher as the training status increased. This points out that training only can affect HR at thresholds, but not at maximum. These results would indicate that percentage of HRmax at which VT1 and VT2 occur increase with training and could be used as an indicator of training status of the participants. This is supported by the significant correlation between VO2VT1 and VO2VT2 with %HRmax VT1 and VT2, respectively. In this case, since training status does not influence HRmax, it is possible to evaluate the evolution of a participant focusing exclusively on changes in %HRmax VT1 and VT2, in contrast to %VO2max VT1 or VT2. Nevertheless, these recommendations should be taken with cautions because the correlation between VO2VT1 and VO2VT2 with %HRmax VT1 and VT2, respectively, was moderate to low in general. As occurred with %VO2max, this finding does not support the general guidelines which stablish exercise intensity based on percentages of HRmax (Haskell et al. 2007; Garber et al. 2011). Since individuals with different training status (different %HRmax VT1 and VT2) could be at different training zones at the same percentage of HRmax.
VVT1, VVT2 and Vmax were significantly higher the higher the training status. These results are aligned with a previous study showing a higher VVT1 and VVT2 in well-trained compared to recreationally trained runners (Hetlelid et al. 2015). Furthermore, these results agree with previous studies observing an increment in power output at VT1, VT2, and maximum with training during a season (Lucía et al. 2000; Zapico et al. 2007, 2014). Thus, the velocity obtained at the different points seems to be one of the main adaptations to training and deserves special attention when evaluating the evolution of a subject. On the other hand, in case of using velocity to set intensity based on training zones it is necessary to determine velocity at thresholds frequently. This is due to the high impact of training on velocity at the different physiological points.
Finally, we observed higher %Vmax VT1 and VT2 as the training status of the participants increased. This indicates that greater proportional improvements (greater responsiveness) are observed in VVT1 or VVT2 compared to Vmax as training status increases. These results are consistent with those found for %VO2max VT1 and VT2; therefore, they could be explained by the same reasons. %Vmax VT1 and VT2 could serve as indicators of the training status of the participants due to the higher values observed with higher training statuses. This is supported by the significant correlation between VO2VT1 and VO2VT2 with %Vmax VT1 and VT2, respectively, although these recommendations should be interpreted cautiously because the correlation between VO2VT1 and VO2VT2 with %Vmax VT1 and VT2, respectively, was generally moderate to low. However, as with %VO2max VT1 and VT2, we do not recommend evaluating the progress of a participant based solely on %Vmax VT1 or VT2 because a higher value in these variables could be due to a lower Vmax with similar VVT1 or VVT2, respectively, and this does not necessarily indicate an improvement in training status. The changes in %Vmax VT1 or VT2 with training status observed in our data do not support the recommendations of general guidelines that establish exercise intensity based on percentages of maximum work rate, since a specific percentage of Vmax could elicit different physiological responses as %Vmax VT1 or VT2 change with training.
Methodological considerations
Like any study, the present one is not without considerations. One consideration is that participants underwent different incremental ramp exercise protocols depending on their fitness levels. However, various slopes of load increment during the test do not seem to affect VO2VT1, VO2VT2, or VO2max (Scheuermann and Kowalchuk 1998; Leo et al. 2017; Iannetta et al. 2019), while excessively long protocols (> ~ 26 min) may hinder reaching true VO2max due to fatigue (Midgley et al. 2008). Therefore, it is advisable to avoid an excessively low slope of load increment when assessing a subject’s evolution in VO2max. This is the primary reason why participants in the present study did not undergo the same incremental test. Similarly, different slopes of load increment do not appear to affect HRVT1, HRVT2, or HRmax (Scheuermann and Kowalchuk 1998). However, exercise protocols with steeper slopes of load increment yield higher workload values at different physiological points (Jamnick et al. 2018). Regarding reference standard values, other studies report data with larger sample sizes, but they classify individuals based on age and sex rather than training status (Loe et al. 2013; Vainshelboim et al. 2020). Although we acknowledge that our study does not provide data from such a large sample size, to the best of our knowledge, it is currently the only study available in the literature that reports reference values considering training status. Another consideration is that respiratory gas exchange was analyzed using two different analyzers. However, previous studies have already validated the analyzers used in the present study (Rietjens et al. 2001; Perez-Suarez et al. 2018). Finally, like any cross-sectional study, we cannot assert that training itself is the cause of the differences found between training statuses. However, it seems highly impractical to conduct a training program with the sample size of the present study.


留言 (0)