
記住我


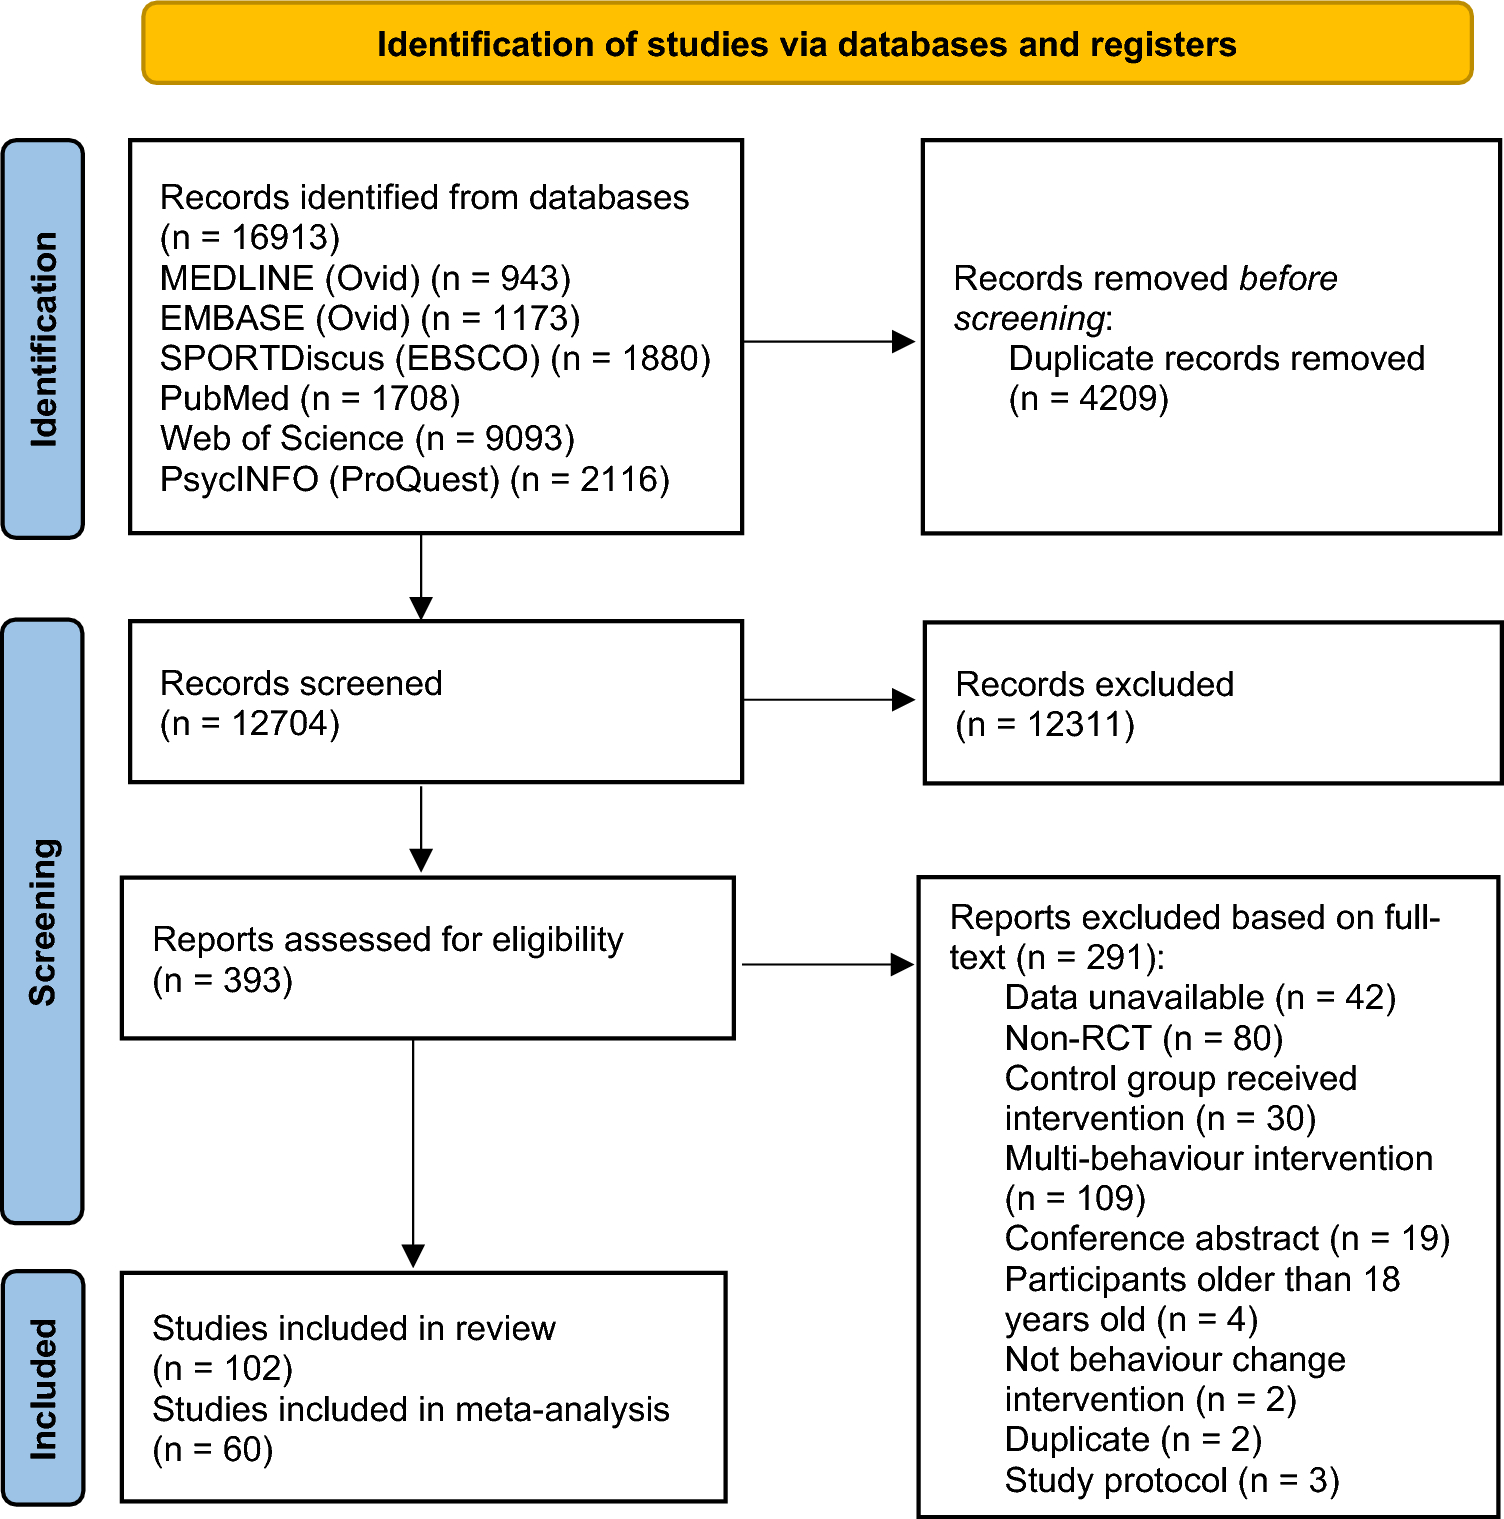
Our initial search yielded 2345 hits. After removing 111 duplicates, 2234 remained. Of these, 1638 were not exercise training trials, 240 were not RCTs, and 48 were animal studies, all of which were removed, leaving 308. We excluded 193 RCTs for various reasons (see OSM Table S3), leaving 115 studies. We found an additional 34 from reference lists of included studies, one of which was excluded as a duplicate, leaving 148 included studies with 227 intervention groups, with a total of 8673 participants: 5273 exercise participants and 3400 sedentary control participants.
3.2 Characteristics of Included StudiesAT was employed by 164 intervention groups, RT by 32 and CT by 31. Median training frequency was three weekly sessions, used in 151 intervention groups. Vigorous-intensity training was most frequently used (103), with moderate (96), high (27) and low intensity used in just three intervention groups. Program duration ranged from 3 to 52 weeks, with 12 weeks being the most common. The mean number of exercise and control participants was 23 and 15, respectively, total 38 per study. OSM Table S4 further summarizes study characteristics.
Of the 148 included studies, 91 did not provide any medication usage information; 41 studies reported participants did not use lipid-lowering medication; 14 studies reported partial use of lipid lowering medication; and 2 studies reported 100% of participants were using lipid lowering medication. The incomplete and skewed nature of these data, which were also provided at a group, not individual level, meant we were not justified in drawing conclusions about the concurrent effects of exercise training and use of lipid lowering medication.
3.3 Overall Pooled Analysis of 95% Confidence Intervals and Prediction IntervalsA combined analysis of all 211 exercise-training studies reported TC (4542 exercise/3073 controls) was lower by – 5.90 mg/dL or 0.15 mmol/L (95% CI – 8.14, – 3.65), see Fig. 2. TSA calculated a minimum information size (IS) of 3777 participants was required to support the findings.
Fig. 2
Change in total cholesterol 95% confidence (CIs) versus prediction intervals (PIs). The mean effect size is – 5.90 mg/dL with a 95% CI of – 8.15 to – 3.65 mg/dL. The true effect size in 95% of all comparable populations falls in the interval – 29.72 to 19.92 mg/dL
LDL was reduced by – 7.22 mg/dL or 0.19 mmol/L (95% CI – 9.08, – 5.35), see Fig. 3 (n = 178; exercise 4143/2724 control). TSA calculated a minimum IS of 1,558 participants was required to support the findings.
Fig. 3
Change in low-density lipoprotein cholesterol (LDL) 95% confidence (CIs) versus prediction intervals (PIs). The mean effect size is – 7.22 mg/dL with a 95% CI of – 9.09 to – 5.35 mg/dL. The true effect size in 95% of all comparable populations falls in the interval – 23.54 to 9.10 mg/dL
TGD was reduced by – 8.01 mg/dL or 0.09 mmol/L (95% CI – 10.45, – 5.58), see Fig. 4 (n = 200; exercise 4,26/control 3,81). The TSA calculated that a minimum IS of 7,69 participants was required to support the findings. This number was exceeded by only 38, meaning the requirement was only just met.
Fig. 4
Change in triglycerides 95% confidence (CIs) versus prediction intervals (PIs). The mean effect size is – 8.01 mg/dL with a 95% CI of – 10.44 to – 5.58 mg/dL. The true effect size in 95% of all comparable populations falls in the interval – 23.13 to 7.11 mg/dL
VLDL was reduced by – 3.85 mg/dL or 0.10 mmol/L (95% CI – 5.49, – 2.22), see Fig. 5 (n = 23; 413 exercise/317 control). TSA calculated a minimum IS of 554 participants was required to support the findings.
Fig. 5
Change in very low-density lipoprotein cholesterol (VLDL) 95% confidence (CIs) versus prediction intervals (PIs). The mean effect size is – 3.85 mg/dL with a 95% CI of – 5.48 to – 2.22 mg/dL. The true effect size in 95% of all comparable populations falls in the interval – 7.37 to – 0.33 mg/dL
HDL was significantly higher by 2.11 mg/dL or 0.05 mmol/L (95% CI 1.43, 2.79), see Fig. 6 (n = 216, 5,018 exercise/3,310 control). TSA calculated a minimum IS of 2,724 participants was required to support the findings.
Fig. 6
Change in high-density lipoprotein cholesterol (HDL) 95% confidence (CIs) versus prediction intervals (PIs). The mean effect size is 2.11 mg/dL with a 95% CI of 1.43–2.79 mg/dL. The true effect size in 95% of all comparable populations falls in the interval – 4.66 to 8.88 mg/dL
3.4 Law of Integrated Logarithm (LIL) AnalysesWith the exception of VLDL, which exhibited the smallest information size, the LIL supported favourable change findings for TC, HDL, LDL and TGD, using the O’Brien-Fleming technique set at 5% significance.
The weighted percentage change in lipids following exercise training ranged from 3.48% for HDL to 11.68% for VLDL. OSM Figs. S1–S5 show funnel plots for the five lipid outcome measures, containing effect sizes, 95% CIs and 95% PIs. OSM Figs. S6a–S6c show default settings for the TSA analyses. OSM Figs. S7–S16 show the O’Brien-Fleming adjustment boundary and the Law of Iterated Logarithm (LIL) penalized analyses for the TSA analysis of each of the five lipid outcomes.
Prediction intervals suggested only VLDL remained significant. Prediction intervals were (mg/dL): TC 95% PI – 28.72 to 16.92, so 37.1% of the studies showed no beneficial effect of exercise training; HDL 95% PI – 4.66 to 8.88, 34.2% of the studies showed no beneficial effect: LDL 95% PI – 23.54 to 9.10, 27.9% of the studies showed no beneficial effect; TGD 95% PI – 23.13 to 7.11, 23.5% of the studies showed no beneficial effect; VLDL 95% PI – 7.37 to – 0.33, 100% of the studies showed a beneficial effect.
3.5 Exercise TypeWhen separate analyses by exercise type were performed, AT significantly reduced TC, LDL, TGD, and VLDL and raised HDL. CT produced significant reductions in TC, LDL, TGD and VLDL and an increase was observed in HDL. RT only improved HDL (see Fig. 7).
Fig. 7
Summary of change in outcome measures with different types of exercise training. *Not significant, p > 0.05 for all resistance training except high-density lipoprotein cholesterol (HDL) analysis. As only 23 very low-density lipoprotein cholesterol (VLDL) studies were included, we did not conduct sub-analyses. TC total cholesterol, LDL low-density lipoprotein cholesterol, TGD triglycerides
3.6 Study Quality Effects and Sub-analysesThe median study quality TESTEX score was 7. Several study quality items were, in general, rarely conducted; these included: specifying randomization method used (31% of studies); allocation concealment (15%); blinding of assessors (14%); reporting adherence, adverse events and participant withdrawal rates > 15% (all < 30%); performing intention-to-treat analyses (27%); physical activity monitoring in control group (7%). A summary is provided in OSM Table S5.
3.7 Aerobic Sub-analysesTC and TGD were all favourably changed in studies with TESTEX scores < 10, but not ≥ 10. HDL, LDL and VLDL were significantly improved irrespective of TESTEX score.
3.8 Combined Sub-analysesTC, HDL and TGD were significantly improved in studies with TESTEX scores < 10, but not ≥ 10. LDL and VLDL were significantly improved irrespective of TESTEX score.
3.9 Resistance Sub-analysesHDL was only significantly increased with studies with TESTEX < 10.
3.10 Leave-One-Out Meta-analysisWe conducted leave-one-out meta-analysis for TC, HDL, LDL and TGD; due to the larger number of included studies no single study had an effect on statistical significance.
3.10.1 HeterogeneityHeterogeneity was moderate to high for the majority of analyses. Likely causes of heterogeneity were variations in study size, type, modality, session, frequency, intensity and program duration of exercise. These variables were examined using meta-regression to explain heterogeneity.
3.10.2 Meta-RegressionMeta-regression models were developed for aerobic exercise for TC, HDL and LDL. The model for TC suggested that for every extra weekly session, a reduction of – 7.68 mg/dL or – 0.20 mmol/L occurred and for every extra week of training the TC reduction was – 0.5 mg/dL or – 0.013 mmol/L. The TC model also showed that for each additional study participant an increase of 0.30 mg/dL or 0.078 mmol/L was observed, indicating a small study effect.
Each minute of session time produced a 2.11 mg/dL or 0.055 mmol/L HDL increase. Each yearly increase in participant age produced a 0.25 mg/dL or 0.27 mmol/L LDL increase, while each additional study participant raised LDL by 0.83 mg/dL or 0.022 mmol/L.
3.10.3 Publication BiasFunnel plots of the five primary outcomes can be seen in OSM Figs. S1-S5. Visual inspection showed some evidence of publication bias for TC (p = 0.77) and LDL (p = 0.55), but the Egger tests were not significant.
3.10.4 Risk of BiasRisk of bias was completed and summary figures for each of the outcomes are published online due to formatting output size (https://osf.io/dbeh9). For TC, 212 independent intervention groups were appraised. Low risk of bias was found in three, 92 showed some concerns, and the remaining 117 were found to have high risk of bias. Of the 216 intervention groups for HDL, five studies showed low risk of bias, 92 showed some concerns, and 122 contained high risk of bias. Among the 178 intervention groups for LDL, five observations showed low risk of bias, 79 some concerns, and 94 high risk of bias. For VLDL, 23 observations showed some concerns and 11 showed high risk of bias. For TGD, 200 intervention groups were examined, and five of these showed low risk of bias, 88 indicated some concerns, and the remaining 107 studies displayed high risk of bias.
3.10.5 Certainty of EvidenceThe number of studies and participants in the TC, HDL, LDL and TGD analyses was large enough to exceed the futility threshold in all cases. This adds to the certainty these lipids are improved with exercise. In contrast, the prediction intervals suggest that, aside from VLDL where 100% of studies showed a beneficial effect, ExTr does not appear to exert benefit in 37.1% of TC, 34.2% of HDL, 27.9% of LDL, and 23.5% of TGD studies. Furthermore, a high degree of heterogeneity, some evidence of publication bias, and a hint of small study effects mitigates this certainty.
留言 (0)