
記住我


Pharmaceutical analysis involves qualitative and quantitative determination of analytes and is also useful for the separation and purification of compounds from the mixture. The scientific discipline known as spectroscopy is concerned with the investigation of the relationship that exists between electromagnetic radiation and all kinds of materials. In addition to being the most effective instrument now accessible for the investigation of chemical structure, it is also utilized in the examination of a broad variety of substances [1]. Different spectroscopic [2,3,4,5,6,7], electrochemical [8,9,10], and chromatographic [11,12,13,14] methods have been developed to date for the estimation of isoniazid, but there is no method till date based on digital image colorimetry that is precise, portable, and easy to use.
UV–visible spectroscopyElectromagnetic radiation in the wavelength range of 180–400 nm is considered as the UV region, whereas 400–800 nm is the visible region. This UV–vis wavelength of light is generally absorbed by a wide range of organic molecules and causes energy transitions at the electronic level. Various transitions, such as σ to σ*, π to π*, n to σ*, and σ to π* can take place in a molecule on the absorption of radiation. Chromophore is the moiety in which these electronic transitions occur and is responsible for the color of the compound. If the molecule doesn’t have a chromophore moiety, derivatization can be done to convert it into a UV–vis active form; so that it can absorb radiation and undergo electronic transitions. These techniques include complexation, enzymatic reactions, diazotization, etc. A similar occurrence arises when sample preconcentration is employed by any separation or extraction technique [15].
In recent times, there have been significant advancements in UV–vis spectrophotometers. These advancements aim to enhance sensitivity, precision, and accuracy, while also reducing costs and analysis time. Nanodrop UV–visible spectrophotometers and microplate spectrophotometer are the best advancements found in recent times, which can utilize a very small volume of sample and also analyze large number of samples at a time, thus supporting the principles of Green Analytical Chemistry. Portable colorimeters and spectrophotometers are also available these days which can promote in situ analysis.
According to Beer–Lambert’s law, absorbance is directly proportional to concentration within a concentration range. It is expressed as,
Here, A represents absorbance or optical density, and a refers to the absorptivity or extinction coefficient. The path length b of the radiation passing through the sample is measured in centimeters. The concentration of solute in the solution c is an important factor to consider. Both b and a remain constant, indicating that a is proportional to c.
The selection of a solvent that is transparent to the wavelength selected for the study must be considered while preparing the solution. λmax is considered as a qualitative parameter for the analyte under study. Even though UV–visible spectrophotometric studies are more advantageous than other analytical methods, there are several drawbacks, such as the maintenance of the laboratory, the training of personnel, power consumption, etc. So there is a need for a simple colorimetric approach which is simple, economic, portable, and rapid without compromising its analytical performance [16].
Digital image colorimetry (DIC)DIC is an innovative colorimetric method that uses the red, green, and blue (RGB) channels of photographs of a colored analyte solution, which are taken by digital cameras, webcams, hand scanners, or smartphone cameras. The numbers are 13 and 14. Smartphones are optimal devices for capturing images in this context due to their exceptional photographic capabilities, advanced software, and convenient mobility for image processing [3]. The advent of smartphone technology has revolutionized several scientific disciplines, including chemistry, by offering groundbreaking opportunities and applications. Smartphones play a crucial role as detecting devices in the advancement of new analytical techniques. Smartphones and digital cameras are used as digital imaging systems that rely on colorimetry. However, they may also be employed in fluorescence, chemiluminescence, and electrochemical approaches. The affordability, widespread availability, and user-friendly nature of smartphones have led to their use as instruments for the advancement of innovative analytical techniques in several fields, such as environmental monitoring, food analysis, and particularly biomedical and health tracking analysis [17].
Several applications were developed for colorimetric determination of compounds using smartphones. The choice of app for the present study was Photometrix, which has an extension version of Photometrix Pro® and Photometrix UVC®. It analyzes the digital images captured by the smartphone camera and decomposes the color of the picture into different channels such as R (Red), G (Green), B (Blue), H (Hue), S (Saturation), V (Value or brightness), L (Lightness), and I (Intensity) which can be constructed as the RGB model, HSL model, HSV model, and HIS model. The application is feasible with both univariate and multivariate analysis. Each sample will record the values obtained for every channel in the image. The Photometrix app has another advantage of obtaining a calibration curve for a series of concentrations kept for study, which makes it more feasible [18].
Principles of digital image colorimetry (DIC)Key elements of digital image colorimetry systems encompass various aspects such as color spaces, tools for picture capture, illumination, applications for color quantification, and DIC applications. First, color spaces are carefully selected to meet different requirements, enhancing the precision of the analysis results. Here is a comprehensive overview of the commonly used color spaces.
Advancements in digital photography have made it more affordable and convenient to capture high-resolution images using a smartphone's digital camera. The potential for creating fast and affordable digital image correlation (DIC) on smartphones for various assessments, such as drugs, natural compounds, biomolecules, toxins, antibiotics, heavy metals, microbes, etc., is driven by the popularity of digital pictures.
Several advancements in digital image colorimetry took place because of computational capabilities and widespread usage of mobile phones. Smartphone-based studies were also applied to microfluidics and paper-based devices in several tests. These technologies are utilized for point-of-care testing in the healthcare sector and other businesses, also known as point-of-need testing. Hence, the digital image correlation (DIC) on smartphones is unambiguously scored as a 5 [19].
Photometrix proDue to more advancements in image acquisition and processing techniques in smartphones and their easy availability, several applications were developed for studying digital images. Digital images have revolutionized various applications that were once limited to specialized equipment like colorimeters, spectrophotometers, and fluorometers. Their effectiveness is well-documented. This function represents the distribution of luminous energy, in which some amount of energy is absorbed, some is transmitted, and the remaining portion is reflected. A device can capture the reflected and transmitted parts of the energy. Electronic devices may quickly acquire monochrome or color digital pictures utilizing charge-coupled device (CCD) or complementary metal oxide semiconductor (CMOS) sensors [20].
The various colors that the human eye perceives are a result of the different intensities of stimuli received by each type of cone. Despite the widespread use of RGB, alternative color models such as HSV, HSL, and HIS, which integrate hue, saturation, and value, also exist. Hue is commonly used to describe color, such as the difference between yellow and red. Saturation signifies the intensity of color [21]. The amount of light can vary, creating distinctions between different shades, like dark green and light green, or bark blue and light blue. In this context, value refers to the highest level of R, G, or B, while intensity is the average level of R, G, and B. Lightness, on the other hand, is the average level between the highest and lowest amounts of R, G, or B. In order to improve the image feature, several process techniques can be applied to obtain the image for the study [22].
This method presents a straightforward approach for analyzing color histograms on RGB and/or HSI scales. These tools have facilitated the development of an efficient, rapid, and reliable technique. The authors have introduced the utilization of a smartphone in a Bradford assay, which can determine protein concentration in biological samples. In this method, a smartphone spectrometer is employed, along with a G-Fresnel device that enables miniaturization by combining focusing and dispersion functionalities. This study suggests the creation of an application that can be used for analyzing and calibrating data from digital images taken with Android smartphones and Windows phones. The application will utilize simple linear regression and principal component analysis for univariate calibration and exploratory analysis [22].
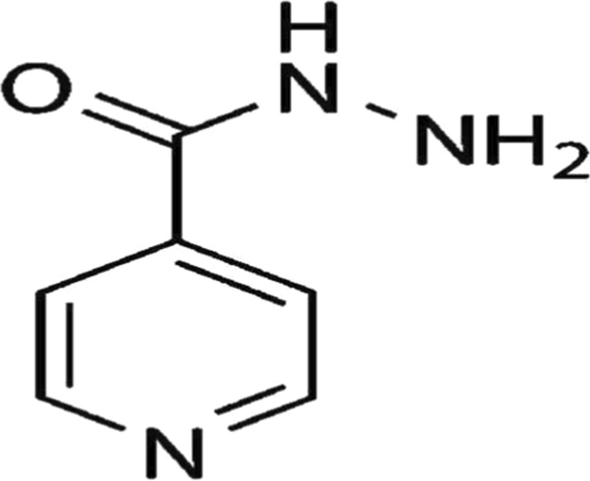
The present study was aimed to determine isoniazid in tablets by the digital image colorimetry method using the photometric Pro application and comparing it with spectrophotometer. Isoniazid is a pyridine-carbohydrazide molecule (Fig. 1) used as an antitubercular medicine. INH exhibits solubility in water, ethanol, and chloroform, whereas it is insoluble in ether or benzene. It inhibits mycolic acid synthesis, which is an integral component of the bacterial cell wall. It shows a bactericidal effect on both intracellular and extracellular Mycobacterium tuberculosis. INH selectively inhibits the enoyl reductase enzyme by forming a covalent bond with the NAD co-factor of InhA in M. tuberculosis.
Fig. 1
Chemical structure of isoniazid
留言 (0)