Study design
This study employed a prospective, single-center, cohort, and observational design. All patients admitted to the polyvalent Critical Care Department of Hospital de la Santa Creu i Sant Pau (Barcelona, Spain) with IMV over an 18-month period were screened. Patient identities were pseudonymized to ensure confidentiality. The registry was developed and implemented in accordance with the amended Declaration of Helsinki, and the study received approval from the Institutional Review Board of Hospital de Sant Pau (protocol code: IIBSP-EAD-2012-111, and Research Ethics Committee code: 55/2012). Informed consent was obtained from all patients of their next of kin. The preparation of this paper followed the STROBE recommendations.
Participants and study groups
Patients older than 18 years and invasively ventilated who were difficult to wean were included in the study. Patients were defined as difficult-to-wean when they failed an initial spontaneous breathing trial (SBT), and required up to three SBT or as long as 7 days from the first SBT to achieve extubation [17, 18]. Exclusion criteria were pregnancy, patients with pacemakers due to possible interference with the Neurally Adjusted Ventilatory Assist (NAVA) catheter, patients ventilated through a tracheostomy, and patients with do-not-resuscitate orders. We defined two groups: the “extubation failure” group, in which patients required reintubation within 48 h, and the “extubation success” group, in which reintubation within 48 h did not occur.
The primary objective of the study was to analyze the time course evolution of EAdi during the weaning phase in difficult-to-wean patients. The secondary objectives were to analyze EAdi values differences between the extubation failure and success groups and to identify a threshold at which EAdi during the SBT can be useful in order to predict which patient will fail extubation.
Study protocol
After the first SBT failure (patient meeting criteria for difficult weaning), a nasogastric probe able to record the EAdi (NAVA catheter, MAQUET, Solna, Sweden) was positioned. The catheter placement was checked for accuracy in all patients, as described [19]. NAVA catheter position and function were checked three times a day (every nursing shift) throughout the study period. Investigators were notified each time the patients were scheduled for a new SBT by the attending clinician. Continuous recording of ventilator variables (via a PCMCIA card inserted in the ventilator) was started at least one hour before the SBT. In case of SBT success and clinical decision to extubate, the recording continued for up to 48 h post-extubation, reintubation, or discharge of the patient, whichever happened first. If the SBT failed, the recording was stopped, and a new SBT was awaited. The attending clinician assessed readiness for extubation, unaware of EAdi values. Arterial blood gases (ABG) were obtained before extubation in all patients and at 2 h post-extubation.
According to the ICU protocol, all SBTs were conducted with a pressure support (PS) of 7 cmH2O and zero positive end expiratory pressure (PEEP) for a duration of 60 min. The first SBT was performed with the same success criteria as the subsequent SBTs recorded in the study. SBT success criteria were: a ratio of partial pressure of arterial oxygen to fraction of inspired oxygen (PaO2/FiO2) > 200 mmHg, respiratory rate ≤ 35 breaths per minute; efficient cough, hemodynamic stability with epinephrine or norepinephrine infusion rate not greater than 0.5 mg/h, Glasgow Coma Scale (GCS) > 8, and little or no sedation [20,21,22]. Sedation management was conducted as per our ICU clinical protocol. All patients deemed ready for extubation received no continuous sedation and RASS scale was used to ensure adequate mentation. Patients might still be under antipsychotics, anxiolytics, or analgesics if clinically necessary. In the post-extubation period, NIV was not systematically applied to all patients. Prophylactic NIV was prescribed by the attending clinician when deemed necessary and the decision to reintubate was taken by the attending physician based on his clinical judgment.
Data collection
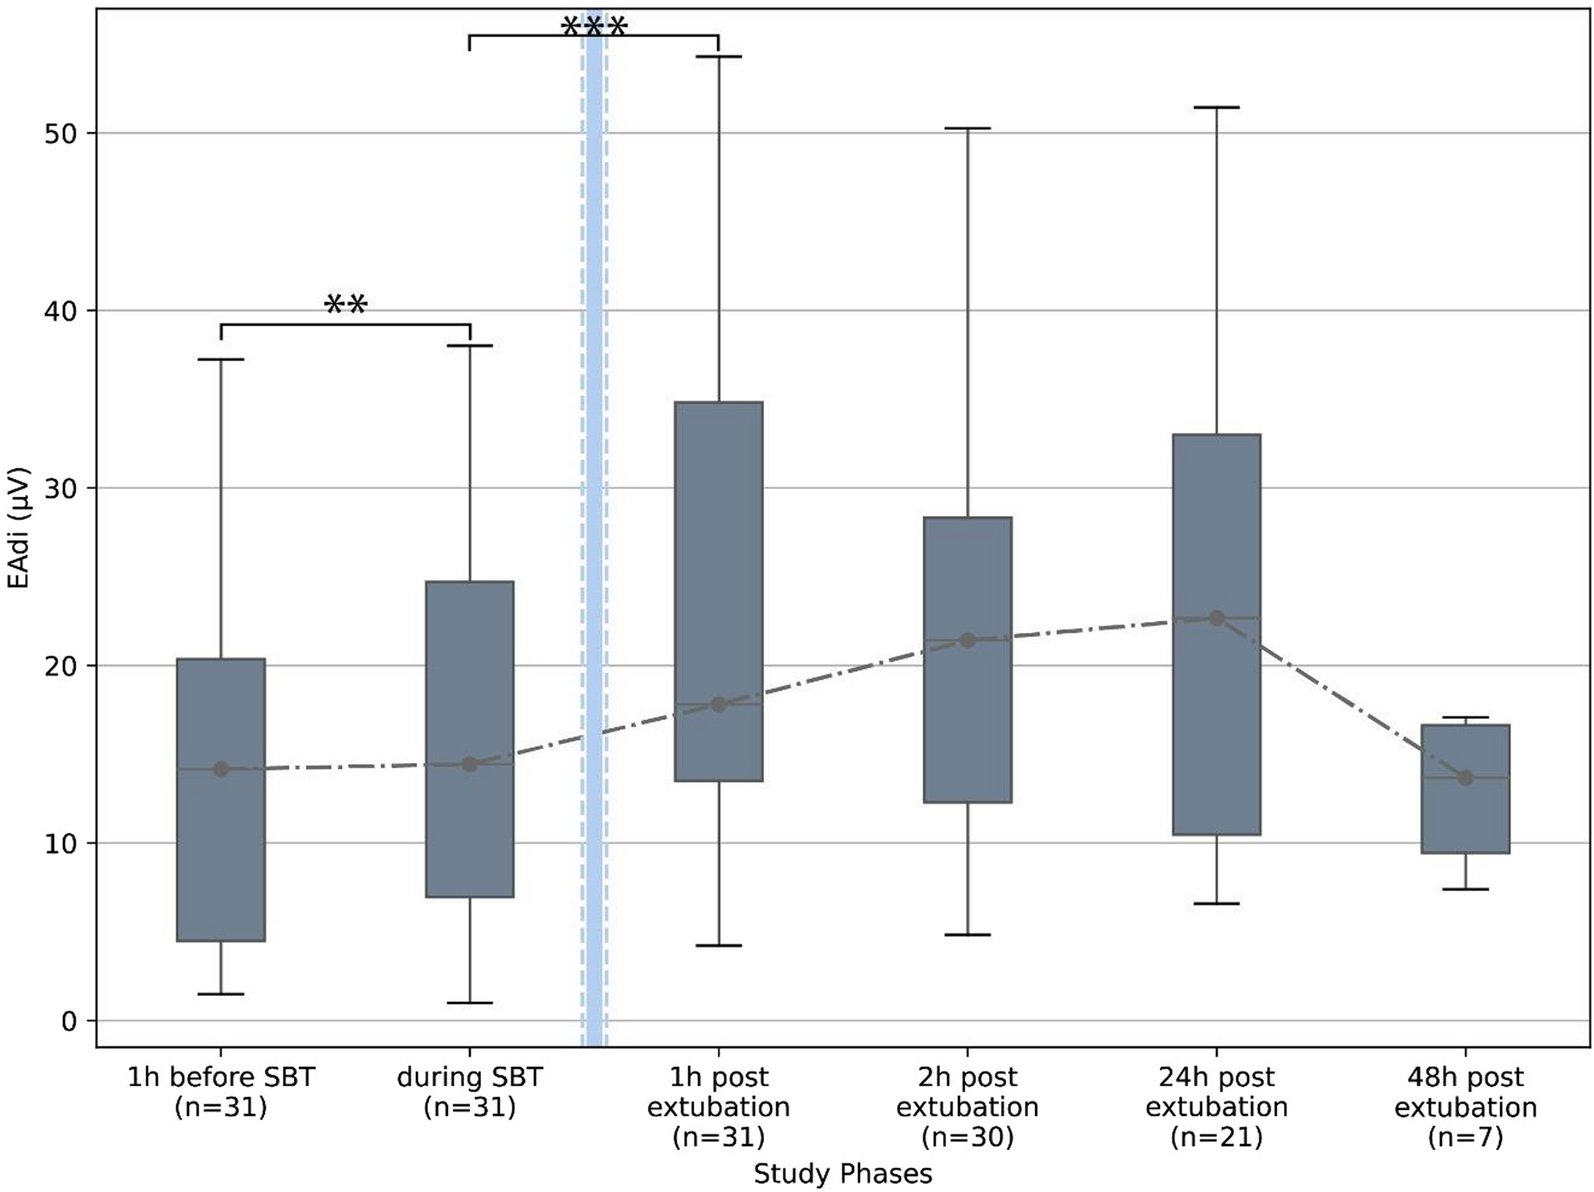
All ventilator and EAdi-derived variables were obtained every minute starting from 60 min before the final and successful SBT, during the final and successful SBT, and after extubation. Ventilator related variables included inspiratory and expiratory tidal volumes, peak airway pressure (Ppeak) and PEEP. EAdi-related variables included EAdi peak and EAdi minimum. To facilitate data analysis, the EAdi recording was divided into seven different phases: 1 h before SBT, during SBT, and 1 h, 2 h, 24 h and 48 h after extubation. The mean value for each variable was calculated for each phase. Artifacts in the EAdi signal due to tracheal suctioning, coughing, and nursing care led to the exclusion of EAdi data from the last 5 min before extubation and the first 10 min after extubation. The Vt/EAdi index before extubation was calculated as a surrogate of respiratory efficiency [23]. Hemodynamic data, peripheral oxygen saturation, respiratory rate, heart rate, and mean arterial blood pressure were recorded before starting the SBT and at the end of the SBT. For reintubated patients, the main reason leading the attending clinician to the decision to reintubate was collected a posteriori from a predefined list of extubation failure mechanisms proposed in the literature [4].
Statistical analysis
The Shapiro–Wilk test was used to assess the normality of the distribution. Continuous normally distributed variables are reported as means and standard deviations, while continuous non-normally distributed variables are reported as medians and interquartile ranges (25th–75th percentiles). Continuous variables were compared using Student t-tests or Mann–Whitney rank sum tests, depending on the normality of the distribution. Categorical variables were compared using the Chi-squared (Χ2) test or Fisher's exact test, as appropriate. Within each group (extubation failure vs. success), different time points were compared using repeated measures ANOVA or the Friedman test. A logistic regression analysis was performed to detect potential confounding factors and a ROC curve analysis was performed to characterize the univariate and multivariate models. Statistical significance was defined as a p value < 0.05. Data analysis was performed using the Statistical Package for the Social Sciences (SPSS) version 20, Chicago, IL, USA.


留言 (0)