
記住我


By merging the pharmacophores of sorafenib and quizartinib, we synthesized the novel FLT3-ITD inhibitor MA68 (Supplementary scheme 1) which binds human FLT3-ITD with a Kd of 12 ± 0 nM in vitro (Supplementary Fig. S1). Crystal structures of sorafenib with kinases (e.g., PDB ID 3WZE) and docking solutions for FLT3 (PDB ID 4RT7) show that the N-methyl amide part of MA68 is in the solvent-exposed region of FLT3-ITD. Thus, this part is a feasible position for introducing a linker recruiting E3 ubiquitin-ligases (Fig. 1A).
Fig. 1: Biological characterization of the FLT3 TPDs MA49 and MA50.
A Interaction of MA68 (green colored carbon atoms) at the ATP binding pocket of FLT3 (PDB ID 4RT7). Docking was carried out as described [54]. Hydrogen bonds are shown as orange dashed lines. The molecular surface of the binding pocket is colored according to hydrophobicity (polar regions colored magenta, hydrophobic regions colored green). The orange arrow indicates the exit vector for designing MA68-based PROTACs. B Structures of MA49 and MA50, including the FLT3 inhibitory scaffold from MA68, the VHL ligand in MA49, and the adamantly group mediating degradation-prone protein aggregation by MA50. C MOLM-13 cells were incubated with 10, 50, 100, and 200 nM MA49 or MA50 for 24 h (0, untreated control sample). Lysates of these cells were subjected to immunoblot analyses for FLT3, pY591-FLT3, and cleaved caspase-3. The protein levels of β-actin were determined to verify equal loading of samples on all tested membranes. The data are representative for the outcome of three independent experiments; cl., cleaved form, arrows point to the cleavage fragments of active caspase-3; p-, phosphorylated; kDa, molecular weight in kilodalton. D DC50 values for FLT3 degradation by MA49 and MA50 in MOLM-13 cells were determined by quantitative immunoblot using the Odyssey system. The cells were treated as stated in B) and lysates were analyzed for FLT3-ITD and β-actin. The values for FLT3 were normalized to β-actin and the DC50 values were calculated with GraphPad Prism 6. E IC50 values for apoptosis induction by MA49 and MA50 in MOLM-13 cells were determined by annexin-V and PI staining and flow cytometry. The cells were treated with 10, 100, or 1000 nM MA49 or MA50 for 72 h. IC50 values were calculated with GraphPad Prism 6. F RS4-11, MV4-11, and MOLM-13 cells were treated with 50 nM MA49 or MA50 for 24 h (+, treated; -, untreated). Lysates of these cells were subjected to immunoblot analyses for FLT3, cleaved caspase-3 (activated form upon cleavage of its autoinhibitory domain), cleaved PARP1, pY591-FLT3, pY694-STAT5, and pS473-AKT. The protein levels of vinculin and β-actin were determined to verify equal loading of samples on all tested membranes. The data are representative for the outcome of two independent experiments; cl., cleaved; p-, phosphorylated; kDa, molecular weight in kilodalton, arrows point to the cleavage fragments of active caspase-3.
We exploited MA68 to synthesize a VHL-recruiting FLT3 PROTAC using the VHL ligand 16 (Supplementary scheme 2) and a 3-polyethylenglycole linker (Supplementary scheme 3) as well as a HyT degrader using an adamantly moiety and an n-pentyl linker group (Supplementary scheme 4). These compounds, MA49 and MA50, are active in vitro using human FLT3-ITD, but 20-fold less than MA68 (MA49, Kd 195 ± 75 nM, MA50 Kd 345 ± 115 nM; Supplementary Fig. S1). Figure 1B shows chemical structures of MA49 and MA50.
To evaluate whether MA49 and MA50 deplete FLT3-ITD, we applied 10–200 nM MA49 and MA50 to human AML cells that express FLT3-ITD and FLT3 (MOLM-13 cells). The FLT3 band that appears at 130 kDa in immunoblot analyses corresponds to the oncogenic, hypoglycosylated ER-bound FLT3-ITD. The slower migrating band at 160 kDa is the plasma membrane-located FLT3-ITD, resembling FLT3 (refs. [1, 2]). Compared to untreated cells, cells incubated with 10 nM MA49 had slightly less of the FLT3 signal at 130 kDa and a significant accumulation of the FLT3 signal at 160 kDa in immunoblot analyses (Fig. 1C). FLT3 inhibitors induce maturation of FLT3-ITD to its fully glycosylated 160 kDa isoform [1]. Treatment with 50–100 nM MA49 depleted FLT3-ITD at 130 kDa and there was less FLT3-ITD at 160 kDa than in the 10 nM treatment group. Increasing the concentration of MA49 to 200 nM attenuated both effects (Fig. 1C). This antagonism is known as hook-effect titrating away E3 ubiquitin-ligases [32]. MA50 decreased FLT3-ITD dose-dependently without a hook-effect (Fig. 1C).
We calculated the half-maximal degradation concentrations of FLT3-ITD by MA49 and MA50. The DC50 values are 11.2 ± 1.4 nM for MA49 and 21 ± 1.6 nM for MA50 after 24 h (Fig. 1D). Sorafenib, quizartinib, and MA68 inhibited FLT3-ITD signaling in MOLM-13 cells but were less effective in reducing the FLT3 signal at 130 kDa (Supplementary Fig. S2).
The loss of FLT3-ITD at 130 kDa was associated with a more rapidly occurring concentration-dependent loss of phosphorylated FLT3-ITD. MA49 was more effective than MA50 in reducing phosphorylated FLT3-ITD (Fig. 1C).
The reduction and inhibition of FLT3-ITD by nanomolar concentrations of MA49 and MA50 were associated with a concentration-dependent activation of the ultimate apoptosis inducer caspase-3 (Fig. 1C) and increased cell staining by the apoptosis markers annexin-V and PI (Fig. 1E). IC50 values for apoptosis induction were 4.8 ± 3.7 nM for MA49 and 13 ± 2.1 nM for MA50 after 72 h (Fig. 1E).
To evaluate our data in additional leukemic cell systems, we included human RS4-11 cells with wild-type FLT3 and MV4-11 cells that express FLT3-ITD homozygously. As expected, FLT3 is mainly at the plasma membrane (160 kDa form) and FLT3-ITD is predominantly at the ER (130 kDa form) (Supplementary Fig. S3A) [1, 2]. In RS4-11 cells, 50 nM MA49 and MA50 did at most weakly attenuate FLT3, phosphorylated FLT3, and its downstream signaling to AKT. In MV4-11 cells, MA49 and MA50 degraded FLT3-ITD and diminished its activating phosphorylation of STAT5 and AKT to undetectable levels. This resulted in the activation of caspase-3 by limited proteolysis. Immunoblotting for the cleavage of its substrate PARP1 verified caspase-3 activity in MV4-11 but not in RS4-11 cells (Fig. 1F).
These data show that we have generated new TPDs for FLT3-ITD that induce apoptosis in AML cells expressing this oncoprotein.
Elimination of FLT3-ITD protein and its downstream signaling by MA49 and MA50 is superior to FLT3 inhibitionCompounds with an inactive stereoisomer of the VHL ligand are appropriate negative controls for VHL-based PROTACs. We synthesized such a negative control molecule for MA49 and called it MA72 (Fig. 2A). We incubated MOLM-13 and MV4-11 cells with 100 nM MA49, MA72, and MA50. MA72 inhibited the activating phosphorylation of FLT3-ITD and its downstream signaling to STAT5 and AKT and promoted the accumulation of FLT3-ITD at 160 kDa (Fig. 2B). These data verify the on-target activity of its FLT3 inhibitor part. Unlike MA49, MA72 did not reduce the FLT3 signal at 130 kDa in MOLM-13 cells and even augmented it in MV4-11 cells (Fig. 2B). These data verify that the elimination of FLT3-ITD by MA49 depends on the intact VHL ligand, i.e., the PROTAC nature of MA49.
Fig. 2: FLT3-ITD TPDs are more effective cell death inducers than corresponding sole FLT3 inhibitors.
A Structure of MA72, which is a stereoisomer of MA49 that is unable to recruit VHL. B MOLM-13 and MV4-11 cells were treated with 100 nM MA49, MA72, or MA50 for 24 h (+, treated; -, untreated). Lysates of these cells were subjected to immunoblot analyses for FLT3, cleaved caspase-3, pY591-FLT3, pY694-STAT5, and pS473-AKT. The protein levels of β-actin were determined to verify equal loading of samples on all tested membranes. The data are representative for the outcome of three independent experiments; cl., cleaved form, arrows point to the cleavage fragments of active caspase-3; p-, phosphorylated; kDa, molecular weight in kilodalton. C The panel shows original flow cytometry data. MOLM-13 cells were treated with 100 nM MA49, MA50, or MA72 for 72 h and analyzed for apoptosis by annexin-V and PI staining using flow cytometry. D Apoptosis analysis of MOLM-13 cells by annexin-V and PI staining with flow cytometry. Treatments were 10, 100, and 1000 nM MA49, MA50, and MA72 for 72 h. The data are representative for the outcome of three independent experiments; -, untreated, +, 10 nM, ++ 100 nM, +++ 1000 nM. Two-way ANOVA statistical test was used to determine statistical significance; *p < 0.05; **p < 0.01; ***p < 0.001; ****p < 0.0001.
Concerning FLT3-ITD signaling, MA49 and MA50 were more potent inhibitors of the p-FLT3-p-STAT5/p-AKT signaling cascades than MA72. These differences were most evident for p-AKT (Fig. 2B).
Next, we compared how MA49, MA50, and MA72 affected leukemic cell survival. Unlike MA72, MA49 and MA50 induced cleavage of caspase-3 markedly after 24 h in MV4-11 and MOLM-13 cells (Fig. 2B). Annexin-V/PI staining corroborated that the FLT3 degraders MA49 and MA50 were stronger apoptosis inducers than MA72 (Fig. 2C). Compared to MA49 (IC50 4.83 nM) and MA50 (IC50 12.95 nM), about 10-to-20-fold higher doses of MA72 (IC50 118.1 nM) were necessary to induce apoptosis in MOLM-13 cells after 72 h (Fig. 2D).
To corroborate that MA49 triggers a VHL-based loss of FLT3-ITD, we carried out a genetic loss-of-function experiment. We depleted VHL in MV4-11 cells by siRNAs and treated the cells with MA49 and MA72. We found that the MA49-mediated degradation of FLT3-ITD was rescued when VHL was eliminated. During these experiments, we additionally noted that VHL was consumed in MV4-11 cells upon treatment with MA49 (Supplementary Fig. S3B).
These data show that MA49 is a VHL-based FLT3 PROTAC. The loss of FLT3-ITD signaling appears responsible for the superior pro-apoptotic effects of MA49 and MA50 when compared to MA72.
MA49 and MA50 selectively kills cultured cells with FLT3-ITDTo extend these observations, we analyzed the impact of MA49 and MA50 on the survival of leukemic cell lines dependent on their FLT3 status. Both compounds killed MV4-11 and MOLM-13 cells, but spared RS4-11 cells (Fig. 3A, B). These results are consistent with data shown in Figs. 1C–F, 2B–D.
Fig. 3: MA49 and MA50 are specifically toxic for AML cells carrying FLT3-ITD.
A MV4-11, MOLM-13, and RS4-11 cells were treated with 10, 100, or 1000 nM MA49 for 24 h and analyzed for apoptosis by annexin-V and PI staining using flow cytometry. The data are representative for the outcome of two independent experiments; +, 10 nM, ++ 100 nM, +++ 1000 nM. B MV4-11, MOLM-13, and RS4-11 cells were treated with 10 or 100 nM MA50 for 24 h and analyzed for apoptosis by annexin-V and PI staining using flow cytometry. The data are representative for the outcome of two independent experiments; +, 10 nM, ++ 100 nM. C MV4-11, HMC1.2 (carrying c-KIT with the activating mutations G560V and D816V), and RPE1 cells were treated with 50 nM MA49 or MA50 for 72 h and analyzed for apoptosis by annexin-V and PI staining using flow cytometry. The data are representative for the outcome of two independent experiments. D Apoptosis analysis of PBMC subpopulations after treatment with 20 or 50 nM of MA49 or MA50 for 24 h; PBMC, peripheral blood mononuclear cells; PMN, polymorphonuclear leukocytes; NK cells, natural killer cells; -, untreated, +, 20 nM, ++ 50 nM. The data are representative for the outcome of four independent experiments. Two-way ANOVA statistical test was used to determine statistical significance; ns, not significant; *p < 0.05; **p < 0.01; ***p < 0.001; ****p < 0.0001.
To evaluate the specificity of MA49 and MA50 further, we used human mast cells (HMC1.2) and human retinal pigment epithelial cells (RPE1; immortalized by telomerase). HMC1.2 cells grow dependent on activated c-KIT. MA49 and MA50 did not affect the survival and proliferation of such cells, confirming that these TPDs selectively affect leukemic cells with FLT3-ITD (Fig. 3C, Supplementary Fig. S3C). Immunoblotting showed that MA49 and MA50 did not affect total and phosphorylated c-KIT (Supplementary Fig. S3D).
To determine the impact of MA49 and MA50 on normal blood cells, we applied them to human peripheral blood mononuclear cells (PBMC) from healthy donors. Considering that PBMCs comprise several immune cell types, [33] we analyzed polymorphonuclear leukocytes (PMNs), monocytes, B cells, T cells, dendritic cells, and natural killer (NK) cells. MA49 and MA50 did not induce apoptosis in these cell populations after 24 h (Fig. 3D) and 48 h (Supplementary Fig. S3E).
These findings illustrate that MA49 and MA50 are isoform-specific FLT3-ITD degraders that specifically kill leukemic cells with mutant FLT3.
MA49 and MA50 downregulate molecular chaperones and ER stress proteinsThe cellular heat shock response (HSR) is activated upon cellular stress to maintain protein homeostasis. A main sensor of the HSR, the molecular chaperone heat shock protein 90 kDa (HSP90) is frequently overexpressed in AML and stabilizes the ER-located FLT3-ITD [34, 35]. We hypothesized that MA49 and MA50 modulated the HSR. To test this, we treated MV4-11 and MOLM-13 cells with MA49 or MA50 for 24 h and analyzed the expression of molecular chaperones. MA49 and MA50 downregulated HSP70, HSP27, HSP110, BIP, and HSP90 (Fig. 4A). MA72 had a weak effect in MOLM-13 cells (Supplementary Fig. S4A) or no effect in MV4-11 cells (Supplementary Fig. S4B) on these HSPs.
Fig. 4: MA49 and MA50 regulate heat shock- and ER-stress-related proteins in AML cells with FLT3-ITD.
A MOLM-13 cells were treated with 50 nM MA49 or MA50 for 24 h and analyzed by immunoblot for the expression of FLT3, HSP110, HSP90, HSP70, HSP27, BiP, pY591-FLT3, pY694-STAT5, and pS473-AKT. The protein levels of β-actin were determined to verify the equal loading of samples. The data are representative for the outcome of three independent experiments. B, C Immunoblot shows the expression of PERK, IRE1α, BiP, CHOP, pT982-PERK, BIM, and ATF6α (activated form upon cleavage in Golgi during ER stress) after treatment with 0.5 µg/ml tunicamycin or 50 nM MA49 or MA50 for 24 h in (B) MV4-11 or (C) MOLM-13 cells. The protein levels of β-actin or vinculin were determined to verify equal loading of samples. The data are representative for the outcome of two independent experiments; +, treated; -, untreated; p-, phosphorylated; kDa, molecular weight in kilodalton. D The GEPIA2 database was analyzed for a correlation between overall survival of AML patients and the levels of HSPs and ER stress proteins. We found significant associations of HSP110 (encoded by the HSPH1 gene) and HSP90 (encoded by the HSP90 gene) expression levels in leukemia cells and patient survival. The analysis included 54 patients in total, with 50% in the high and 50% in the low expressing groups (p = 0.089–0.086). E This database contains data showing an association of FLT3 gene expression and mRNA transcripts encoding HSP110, HSP90, and BIM (p = 0.0039–0.0063). Positive R values indicate positive coregulation of gene expression; negative R values indicate negative coregulation of gene expression; TPM, transcripts per million reads. The graphs show the Pearson correlation coefficients. Such correlation coefficients describe linear correlations between two sets of data. GEPIA2 uses the non-log scale for calculation and use the log-scale axis for visualization. F MOLM-13 cells were treated with 10 μg/ml cycloheximide +/− 50 nM MA49 for 1–5 h. Lysates were analyzed by immunoblot for the expression of FLT3, BIM, pY591-FLT3, pY694-STAT5, and pS473-AKT. The protein levels of β-actin or vinculin were determined to verify equal loading of samples; +, treated; -, untreated; p-, phosphorylated; kDa, molecular weight in kilodalton.
We next assessed if the reduction of the ER-bound FLT3-ITD triggered an ER stress response. We investigated the pro-apoptotic ER stress response markers PKR-like endoplasmic reticulum kinase (PERK), inositol requiring enzyme 1α/β (IRE1α), activating transcription factor 6 (ATF6), the C/EBP homologous protein transcription factor (CHOP), the pro-apoptotic BH3-only protein BIM, and the ER-localized molecular chaperone immunoglobulin heavy chain binding protein (BiP). This ER-localized HSP70 paralogue acts as primary ER stress sensor [36, 37]. We neither detected increased levels or phosphorylation of the ER stress sensors PERK and IRE1α in MV4-11 (Fig. 4B) and MOLM-13 cells (Fig. 4C), nor upregulation of the major ER stress target CHOP. However, MA49 and MA50 induced cleavage of ATF6 to its active 50 kDa fragment, which regulates cellular ER stress responses [38]. The cleavage of ATF6 was induced comparably by FLT3-ITD degraders and the ER-stress inducer tunicamycin. Tunicamycin induced BiP, but MA49 and MA50 reduced BiP in MV4-11 (Fig. 4B) and MOLM-13 cells (Fig. 4C). In both cell types, tunicamycin, MA49, and MA50 induced BIM (Fig. 4B, C).
We asked if the levels of these chaperones and ER proteins are associated with AML patient survival and whether there is a link between FLT3 and BIM. Analyzing RNA-sequencing data for 54 AML patients in the GEPIA2 database, we noted that high mRNA expression levels of HSP110 and HSP90 are associated with a significantly reduced overall survival of AML patients (Fig. 4D; p < 0.1). Using this database, we further found that FLT3 expression is positively linked to HSP90 and HSP110 expression and negatively correlated with the expression of BCL2L11 (encoding BIM) (Fig. 4E; p < 0.01, Supplementary Fig. S4C). Similar Pearson (Fig. 4E) and Spearman correlation coefficient values (Supplementary Fig. S4C) indicate linear relationships between FLT3 and HSP90/HSP110/BCL2L11.
These results illustrate that MA49 and MA50 reduce molecular chaperones, modulate ER stress pathways, and augment pro-apoptotic BIM levels.
MA49 and MA50 induce FLT3-ITD degradation dependent on BIM and HSP90 activityBIM is a key apoptosis initiator in FLT3-ITD-positive cells that are treated with FLT3 inhibitors [39]. These reports and our observation that MA49 and MA50, but not MA72, upregulated BIM in MV4-11 and MOLM-13 cells (Fig. 4B, C; Supplementary Fig. S4A, B) made us speculate that BIM plays a role in MA49- and MA50-mediated apoptosis. We analyzed whether BIM accumulation was a cause of its transcriptional induction or protein stabilization. We treated MOLM-13 cells with the de novo protein synthesis inhibitor cycloheximide for 1–5 h and MA49. Cycloheximide did not affect the induction of BIM by MA49 (Fig. 4F). This result suggests that MA49 stabilizes BIM on a post-translational level rather than by transcriptional upregulation.
To study the role of BIM in MA49- and MA50-mediated apoptosis functionally, we knocked down BIM by transfecting siRNAs targeting the mRNA encoding BIM (siBCL2L11) into MV4-11 cells. This knockdown (KD) was confirmed by decreased expression of the three major BIM isoforms BIM-EL, BIM-L, and BIM-S (Fig. 5A). The MA49- and MA50-mediated downregulation of HSPs (Fig. 4A) was rescued upon KD of BIM (Fig. 5A). Additionally, MA49 and MA50 failed to degrade FLT3-ITD in cells with BIM KD (Fig. 5A, B). This was linked to an attenuated inhibition of p-FLT3-ITD and p-STAT5 by MA49 and MA50. Consistently, MA49 and MA50 less efficiently induced caspase-3 cleavage in BIM KD cells compared to control siRNA-transfected cells (Fig. 5A). MA49 and MA50 stabilized BIM-EL. This was associated with its slower migration (Fig. 5A). This indicates its reduced phosphorylation, a posttranslational modification that destabilizes BIM [40].
Fig. 5: BIM regulates MA49- and MA50-mediated FLT3-ITD degradation and heat shock protein levels.
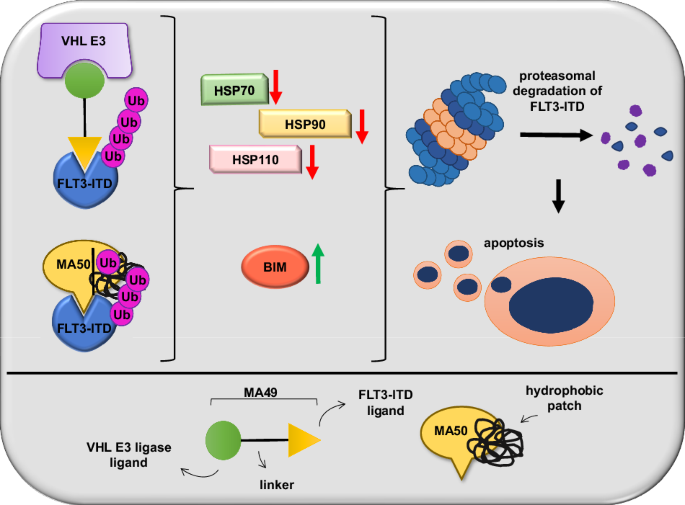
A MV4-11 cells were transfected with siRNA against the BCL2L11 mRNA to knock down the BIM protein. Cells without and with BIM knockdown were treated with 50 nM MA49 or MA50 for 24 h and analyzed by immunoblot for FLT3, BIM, pY591-FLT3, pY694-STAT5, cleaved (cl.) caspase-3, HSP110, HSP90, and HSP27. The protein levels of vinculin and β-actin were determined to verify the equal loading of samples. The data are representative for the outcome of four independent experiments; +, treated; -, untreated; cl., cleaved; p-, phosphorylated; kDa, molecular weight in kilodalton; siCtrl, siRNA control; siBCL2L11, siRNA targeting BIM, arrows point to the cleavage fragments of active caspase-3. B Quantification of FLT3 expression from A; siCtrl, siRNA control; siBCL2L11, BIM knockdown. One-way ANOVA statistical test was used to determine statistical significance; *p < 0.05; **p < 0.01; ***p < 0.001; ****p < 0.0001. C MV4-11 cells transfected with siRNA against siBCL2L11 +/− 1 h 250 nM Onalespib pre-treatment were treated with 50 nM MA49 or MA50 for 24 h and analyzed by immunoblot for FLT3, BIM, pY591-FLT3, and HSP90 expression; siCtrl, siRNA control; siBCL2L11, BIM knockdown; kDa, molecular weight in kilodalton. The protein levels of α-tubulin and β-actin were determined to verify the equal loading of samples. The data are representative for the outcome of two independent experiments; +, treated; -, untreated; cl., cleaved; p-, phosphorylated; kDa, molecular weight in kilodalton; siCtrl, siRNA control; siBCL2L11, siRNA targeting BIM. D Model showing the pharmacological mechanisms of the TPDs described in this manuscript and the associated molecular mechanisms in the upper panel; the lower panel serves as legend.
The persistence of FLT3-ITD in AML cells with BIM KD and the failure of the TPDs to kill them (Fig. 5A) might be driven by HSP90 that stabilizes FLT3-ITD [35]. To evaluate this hypothesis, we applied the clinically tested HSP90 inhibitor onalespib to BIM KD MV4-11 cells and treated them with MA49 or MA50 (Fig. 5C). Onalespib restored MA49/MA50-mediated FLT3-ITD degradation and the inhibition of its phosphorylation.
These results suggest a regulatory role of BIM and HSP90 in FLT3-ITD degradation and the inhibition of its downstream signaling through MA49 and MA50. Figure 5D depicts these insights as model.
MA49 kills FLT3 mutant AML blasts and cells in vitro and in vivo without an impact on hematopoietic stem/progenitor cellsThe data above demonstrate that MA49 has superior activity against leukemia cells with FLT3-ITD. To evaluate the translational relevance of MA49, we assessed how MA49, MA68, sorafenib, MA72, and the clinically used chemotherapeutic cytarabine affected primary AML patient samples with FLT3 or FLT3-ITD. Of these agents, MA49 had the best anti-proliferative effect on FLT3-ITD-positive AML patient samples. Moreover, the EC50 values of MA49 in samples with mutant FLT3 were far below the concentrations required to eliminate AML cells with FLT3 (Fig. 6A, B).
Fig. 6: MA49 kills FLT3 mutant AML blasts and cells in vitro and in vivo without an impact on hematopoietic stem cells.
A, B Serial dilutions of 50 µM top dose of MA49 versus MA72, MA68, sorafenib, and cytarabine were applied to primary ex-vivo samples from leukemia patients with wild-type FLT3 or FLT3-ITD for 72 h. Cell survival is provided as %-values compared to untreated control cells (100% survival) in the MTS-assay. B EC50 values for the data shown in (A) were determined. C Cell viability analysis of murine bone marrow stem cells. Bone marrow was collected from the hind legs of previously killed C57BL/6 mice. The cells were treated with the indicated concentrations of MA49, MA68, or a high concentration of 10% DMSO as a positive control for cytotoxicity for 24 h; Ctrl, untreated. One-way ANOVA statistical test was used to determine statistical significance; ns not significant; *p < 0.05; **p < 0.01; ***p < 0.001; ****p < 0.0001; n = 3, male and female. D Bone marrow cells were freshly isolated from C57BL/6 mice and cultured for 7 days in medium containing the inhibitors at 50–100 nM and supplementation with either GM-CSF to induce the differentiation of myeloid progenitor cells to BMDCs or M-CSF to induce the differentiation to BMDMs. After one week, we assessed the total cell number, viability and frequencies of CD11c+ (pan dendritic cell marker) or F4/80+ (macrophage marker) cells, the expression of their activation marker CD86, cell viability (negative for FVD), and the total cell numbers; -, untreated, +, 50 nM, ++ 100 nM; n = 3, male and female. E Waterfall plots demonstrating changes in tumor volume [%] for each individual zebrafish larvae engrafted with AML cells, from baseline (day 1 = start of the treatment) until day 3 after MV4-11 cell injection. Zebrafish larvae xenografts were treated with DMSO used as a solvent (n = 17 larvae; left) or 200 nM MA49 (n = 18 larvae; right) for 48 h; each bar reflects one individual xenograft. Numbers indicate the percentage of early larvae with progressive disease (PD), stable disease (SD) and partial response (PR) in each treatment group on day three.
Since MA49 is not toxic to PBMCs and their individual cell populations (Fig. 3D, Supplementary Fig. S3E), we were encouraged to determine its potential impact on primary bone marrow stem and progenitor cells. We isolated them from murine bone marrow and analyzed lineage-negative SCA-1/c-KIT-double positive cells for their viability. These hematopoietic cells correspond to CD34-positive human hematopoietic stem cells. As control, we used MA68. Compared to the positive control for cytotoxicity (10% DMSO), MA49 and MA68 did not compromise the viability of lineage-negative SCA-1/c-KIT-double positive cells. Notably, this was more evident for MA49 (Fig. 6C), indicating that it is tolerated better by hematopoietic stem and progenitor cells.
We then investigated if MA49 and MA68 affected the myelomonocytic differentiation of bone marrow-derived hematopoietic progenitors to bone marrow-derived dendritic cells (BMDCs) or bone marrow-derived macrophages (BMDMs). We assessed the total cell number, viability and frequencies of CD11c+ (pan-dendritic cell marker) or F4/80+ (macrophage marker) cells and the expression of their activation marker CD86. MA49 and MA68 did not affect the differentiation, activation, viability, and proliferation of BMDCs. This was also the case for BMDMs which received MA49. Unlike this FLT3 PROTAC, its cognate inhibitor MA68 impaired the differentiation, viability, and particularly the proliferation of macrophages significantly (Fig. 6D).
To demonstrate efficacy of MA49 in vivo, we used Danio rerio larvae in which we injected MV4-11 cells. Upon establishment of leukemia cell masses, the larvae were incubated with MA49 or its solvent for 48 h (Fig. 6E, Supplementary Fig. S5). Embryos were imaged before and after treatment. Embryos with at least 20% increase and 30% decrease in tumor volume were classified to have progressive disease (PD) or partial response (PR), respectively. Larvae that did not classify as PD or PR were considered to have stable disease (SD). In the control group, 41.2% of larvae had SD and 47% had PD. The response rate of xenografts upon treatment with MA49 was augmented to 72.2% SD and PD was decreased nearly threefold to 16.7% (Fig. 6E, Supplementary Fig. S5).
These data show that MA49 halts the proliferation of AML cells with FLT3-ITD, but not of normal hematopoietic cells.
留言 (0)