
記住我


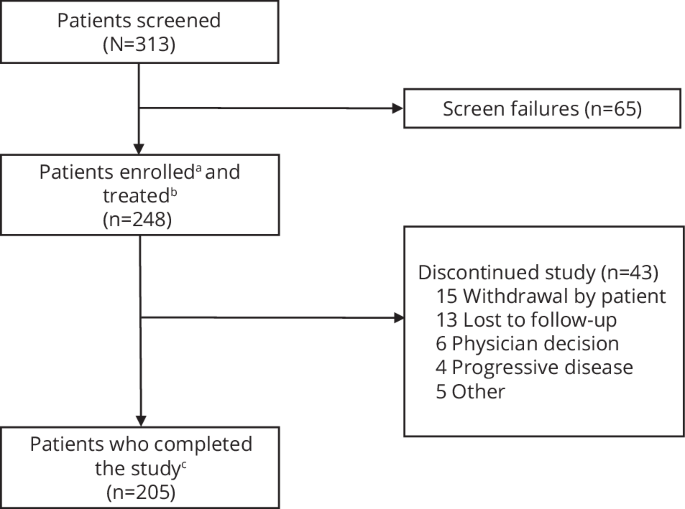
Forty-nine patients were included in this analysis with the full demographics shown in Table 1, and the analysis workflow shown in the consort diagram (supplementary Fig. 1). Briefly, this was a heavily pre-treated cohort (median prior lines of TKI was 4 [2-5]), with the majority having received prior ponatinib (n = 29 (59%)), of whom 9 (18%) had been resistant. Most (n = 35, 71%) had achieved CCyR or better to at least one line of prior therapy, and the reason for discontinuation of the last therapy was intolerance in 32 (65%) and resistance in 17 (35%).
Table 1 Cohort demographics (n = 49).A significant proportion (n = 21, 43%) had a history of at least one known BSNV, and 11 (22%) had a history of a T315I-BSNV (Supplementary Tables 1 and 2). The median maximum tolerated dose of asciminib in patients with a history of a T315I-BSNV was 400 mg [80–400] daily and 80 mg [20–400] daily for those without a T315I-BSNV history (P < 0.001).
Comorbidities were common, with 60% of patients having a history of at least one cardiovascular condition defined by the presence of hypertension, peripheral vascular disease (PVD), ischaemic heart disease (IHD), atrial fibrillation (AF), stroke or transient ischaemic attack (TIA). Hypertension was the most frequent, seen in 18 (37%) patients, with PVD and IHD in 9 (18%) patients each, AF in 8 (16%) and stroke or TIA in 4 (8%). Diabetes was present in 4 (8%) patients, and chronic kidney disease in 9 (18%).
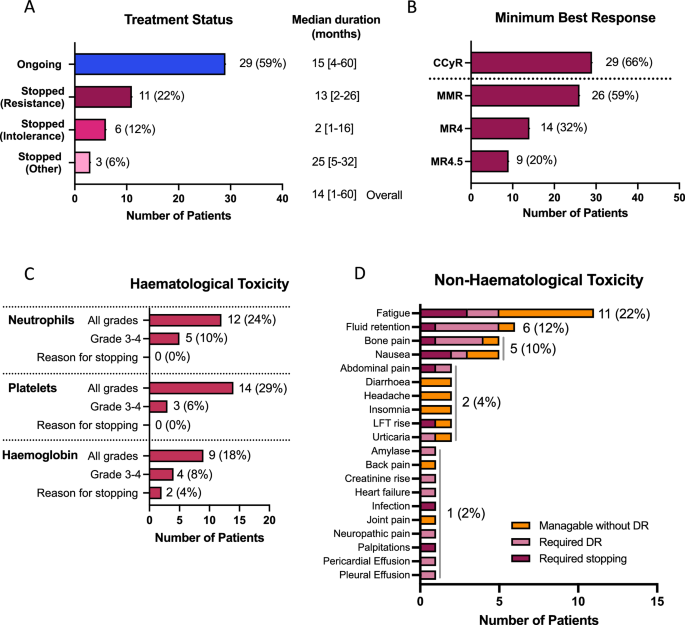
The median duration of asciminib treatment for the entire cohort was 14 [1–60] months. At the time of data reporting, 29 (59%) patients remained on treatment with asciminib (Fig. 1A), with median duration of 15 [4–60] months, while 11 (22%) had stopped for resistance with a median duration of treatment of 13 [2–26] months, and 6 (12%) for intolerance with a much shorter median duration of 2 [1 to 16] months before stopping. Three (6%) stopped for other reasons; one each for treatment-free remission attempt, poor compliance and attempting pregnancy with a median duration of treatment of 25 [5–32] months.
Fig. 1: Clinical outcome and toxicity data.
A Treatment status at time of data collection, B best response achieved on asciminib, C haematological toxicity and D non-haematological toxicity. CCyR: complete cytogenetic response (BCR::ABL1 IS level ≤ 1%), MMR, major molecular response (BCR::ABL1 IS level ≤ 0.1%), MR4, BCR::ABL1 IS level ≤ 0.01% IS, MR4.5, BCR::ABL1 IS level ≤ 0.0032% IS, LFT: liver function tests, DR: dose reduction, IS: international scale.
ToxicityAll 49 patients were evaluated for toxicity. Haematological toxicity of any grade was seen in 19 (39%) patients, with grade 3–4 in 9 (18%). Thrombocytopenia was most common (all grades, 14 (29%), grade 3–4 in 3 (6%) (Fig. 1C)). Neutropenia and anaemia were seen in 12 (24%) and 9 (18%), respectively, with grade 3–4 in 5 (10%) and 4 (8%), respectively. Haematological toxicity was the reason for treatment discontinuation in 2 patients, both for grade 3 anaemia.
Twenty-five (51%) patients experienced non-haematological toxicities. Whilst these were mild and tolerable without dose modification in 9 (18%) patients, 11 (22%) required dose reductions and 5 (10%) stopped treatment because of non-haematological toxicity. The commonest toxicities were fatigue (11, 22%), fluid retention (6, 12%), bone pain (5, 10%), and nausea (5, 10%) (Fig. 1D). In those stopping asciminib because of toxicity, often multiple toxicities were present concomitantly. Pericardial and pleural effusions were seen in 1 patient each, and successfully managed with dose reductions.
One patient suffered a myocardial infarction after 4 months of treatment, one a TIA after 24 months, and one a recurrence of a deep venous thrombosis (DVT). In all three patients a causal association was not clear because other risk factors co-existed.
No significant differences were seen in the frequency of toxicities (haematological or non-haematological) between those treated with standard (40 mg twice daily) or escalated doses (>40 mg twice daily), with haematological toxicity rates of 41% vs. 30%, respectively (P = 0.523) and non-haematological 49% vs. 60%, (P = 0.524), respectively.
ResponseForty-four patients were considered eligible for response assessment after excluding 4 patients who stopped early for toxicity, before meaningful response assessment (median duration of treatment prior to stopping 1 [<1–2] month(s)), and 1 for poor compliance.
With a median duration of treatment of 14 [2–60] months in the response cohort, 29 (66%) patients had achieved or maintained a CCyR or better, with most patients (n = 26, 59%) achieving MMR or better (Fig. 1B). While most patients (n = 32, 73%) were not in CCyR prior to starting treatment with asciminib, all of those who were (n = 12, 27%) maintained or deepened their response on asciminib (supplemental Fig. 2).
Factors associated with higher rates of CCyR were intolerance rather than resistance to the last-line of therapy (86% vs. 31%, P < 0.001), and attainment of CCyR to any prior-line of therapy (84% vs. 17%, P < 0.001) (Table 2). Of those patients who had received prior ponatinib treatment, higher rates of CCyR were also seen in those who stopped for intolerance rather than resistance (71% vs. 25%, P = 0.032). There were no statistically significant differences in the rates of CCyR between those with or without a history of a T315I-BSNV (56% vs. 69%, P = 0.463), however it is important to note that all those with a T315I-BSNV tolerated escalated dose schedules. A history of a non-T315I BSNV was associated with a significantly lower rate of CCyR (42% vs. 75%, P = 0.038).
Table 2 Factors associated with achievement of complete cytogenetic response (CCyR) (restricted to 44 patients eligible for response assessment).BSNV screening by NGSBaseline samples were screened for BSNV by NGS in 34 patients, with paired samples at the time of stopping in 10 (8 stopped for resistance, 2 stopped for intolerance), and in samples during ongoing treatment in 16 (Fig. 2, Supplementary Fig. 1). All patients with BSNV screening by NGS were deemed eligible for response assessment.
Fig. 2: Impact of BCR::ABL1 single nucleotide variants (BSNVs) detected in baseline samples on response to asciminib treatment.
A impact of detectable T315I-BSNV in baseline sample on best response achieved, B impact of detectable non-T315I-BSNV in baseline sample on best response achieved, C details of BSNV detected in baseline samples with dose, treatment status, and best response information. BSNV, BCR::ABL1 single nucleotide variants, NGS: next generation sequencing, mg: milligrams, CHR: complete haematological response, CCyR: complete cytogenetic response (BCR::ABL1 IS level ≤ 1%), MMR: major molecular response (BCR::ABL1 IS level ≤ 0.1%), BD: bis in die (twice a day).
Baseline BSNV and response to asciminibNineteen BSNVs were detected in baseline samples of 11 (32%) patients prior to asciminib initiation. These were T315I alone in 4 patients, non-T315I-BSNV alone in 4, and combined T315I and non-T315I in 3. Five (45%) of 11 patients with baseline BSNV continued on treatment at the time of assessment compared to 17 (74%) of 23 patients without BSNV (P = 0.130). The reasons for stopping in those with a BSNV were resistance in 5 (45%) and intolerance associated with a poor response (BCR::ABL1 IS level of 14% at 5 months of treatment) in one (9%), compared to resistance in 3 (13%), intolerance in 1 (4%), TFR and attempted pregnancy in DMR in 1 (4%) each, in those without BSNV.
Only 4 of 11 (36%) patients with a baseline BSNV achieved CCyR compared to 19 of 23 (83%) without (P = 0.007), with median follow-ups of 16 [4–60] months and 15 [4–44] months, respectively. This difference was most striking in those with non-T315I-BSNV. While there was no statistically significant difference in CCyR rates between those with or without a detectable T315I-BSNV in the baseline sample (43% vs. 74%, p0.116, median duration of treatment 9 [5–60] vs. 16 [4–44] months), only 1 of 7 (14%) patients with a detectable non-T315I-BSNV achieved CCyR, compared to 22 of 27 (81%) without (P = 0.001, Fig. 2A–C, median durations of treatment 9 [4–26] months vs. 16 [4–60] months).
BSNV presence at time of cessationThirteen BSNVs were detected in 7 patients at the time of stopping (Fig. 3A, B), 6 of whom stopped treatment for resistance, and one for intolerance with an associated poor response (BCR::ABL1 IS level of 14% at 5 months of treatment). In 4 patients the BSNVs were present at baseline, of which two had no significant change in the VAF during treatment: a single F359V (VAF 100% baseline and stopping) and a compound T315I (VAF 100% baseline and stopping) with H396R (minor clone, VAF 2% at baseline and stopping). In one patient, expansion of a compound clone (T315I/M351T) was seen, (80% at baseline and 97% at cessation), and one patient had loss of a small subclone with persistence of a larger clone carrying only 1 BSNV (F486S, VAF 100% and E255V, VAF 12% at initiation, and F486S, VAF 100% only at stopping). Three patients had emergent BSNV that were not present in the baseline samples. One patient showed the re-emergence of a historically noted E459K-BSNV that was undetectable at initiation, but 100% VAF at the time of loss of response and treatment cessation. One patient who had achieved MMR, but subsequently lost response, showed the emergence of two BSNVs (c.949 T > C p.F317L, VAF 45% and c.951 C > A p.F317L, VAF 51%), both of which resulted in the same amino acid substitution (F317L) but in independent clones (Supplementary Fig. 3), with VAFs totalling 96%, in combination with a low-level V299L (VAF 4%), which had been present in the baseline sample (baseline VAF 2%). The remaining patient showed the emergence of a low-level BSNV (V338A, VAF 4%) in association with high VAF compound BSNV G250E/F486S (VAFs 100% at baseline and stopping), most likely a subclone carrying 3 BSNVs, associated with loss of haematological response and transformation to blast phase.
Fig. 3: Detection of BCR::ABL1 single nucleotide variants (BSNVs) in final (stopping) and most recent (ongoing) samples.
A schematic of stopping samples analysed, B details of BSNV in baseline sample, asciminib dose, treatment status, best response, BSNV detected in the sample at the time of stopping, BSNV denoted in red are new in the stopping samples, those in blue are no longer detectable in the stopping sample, C schematic of ongoing treatment samples analysed, D details of BSNV in baseline sample, asciminib dose, treatment status, best response, BSNV detected in the most recent sample while on treatment, BSNV denoted in orange are new in the treatment samples, those in blue in the baseline sample are no longer detectable in the treatment sample, those in purple have expanded on treatment. BSNV, BCR::ABL1 single nucleotide variant, CHR: complete haematological response, CCyR: complete cytogenetic response (BCR::ABL1 IS level ≤ 1%), MMR: major molecular response (BCR::ABL1 IS level ≤ 0.1%), BD: bis in die, twice a day, OD: once daily, IS, international scale. #stopped treatment for intolerance associated with poor response, *total F317L amino acid substitution from both c.949 T > C (45%) and c.951 C > A (51%).
BSNV during ongoing treatmentBSNVs screening was possible in 16 out of 22 patients who continue on treatment (6 had insufficient BCR::ABL1 copy numbers for NGS). Of these 16, 3 had achieved haematological response only, 3 CCyR and 10 MMR or deeper. Nine BSNV were detected in 7 patients (Fig. 3C,D). Of these, one patient had the emergence of a novel BSNV (I502F), not present in the baseline sample or historical records. It represented the dominant clone (VAF 82%), and was seen in the context of standard asciminib dosing, achieving a best response to the treatment of CCyR.
In one patient receiving high dose asciminib because of a history of a T315I-BSNV, an F359I-BSNV, which was present at initiation along with other BSNVs (T315I, VAF 8%, G250E, VAF 13%, Y235H, VAF 21% and E459K, VAF 9%) emerged as the sole mutation in a dominant clone (VAF 53% at asciminib initiation and subsequently 99%, Fig. 3D). Three BSNVs (M244V, VAF 19%, P465L, VAF 19% and A337T, VAF 2%) were emergent in a patient achieving haematological response only. In one patient receiving high dose asciminib because of a history of a T315I-BSNV there was loss of the low-level T315I-BSNV, and an emergent Q252H BSNV at low-level (VAF 3%).
Interestingly, three patients had detectable T315I mutations, with VAFs consistent with their presence in the dominant clone in most recent sample on treatment. All three were seen in patients with a known history of T315I mutations, two of whom were tolerating maximal dose asciminib (200 mg BD), one achieving MMR and one MR4, while the remaining patient had achieved MMR on 120 mg BD (dose reduced for toxicity). While the T315I mutation had been detectable in the baseline sample in 2, it was undetectable in one patient suggesting subsequent clonal selection of a very low-level T315I-harbouring clone.
BSNV dynamics over timeFour patients with BSNV were selected for additional NGS-BSNV screening at timepoints before, during and after asciminib treatment to better understand the clonal dynamics. The first patient (ASC-01, Fig. 4A) had received 4 prior TKIs, most recently ponatinib which had achieved MMR, but was stopped for intolerance. He had a known history of an E459K-BSNV detected by Sanger sequencing during a prior-line of therapy, however the BSNV screen by NGS at initiation of asciminib was negative. While there was an initial decline in the BCR::ABL1 IS level from 17.7% to 2% upon treatment with asciminib 40 mg twice daily, this was not sustained. Loss of response with a rising BCR::ABL1 IS level, followed by loss of haematological response was associated with clonal expansion of the E459K-harbouring clone with a VAF of 21%, then 100%, indicative of clonal selection of the E459K-BSNV-harbouring population. Retrospective sample sequencing showed that this pattern of clonal selection for the E459K-BSNV population was not seen during prior ponatinib treatment (Supplementary Fig. 4A).
Fig. 4: BCR::ABL1 single nucleotide variant dynamics over time.
A patient ASC-01, BCR::ABL1 IS level (blue) and E459K-BSNV VAF (purple) over time, starting before (white background), then during treatment with asciminib (pink background), until asciminib cessation, B patient ASC-41, BCR::ABL1 IS level (blue), and G250E- (lavender), Y253H- (black), T315I- (orange), F359I- (green), E459K- (maroon) BSNV VAF over time, before (white background) and during (pink background) asciminib treatment C patient ASC-04, BCR::ABL1 IS level results (blue) and I502F-BSNV VAF (teal) before (white background) and during (pink background) asciminib treatment, D patient ASC-23, BCR::ABL1 IS level (blue) and T315I-BSNV VAF (orange) before (white background) and during (pink background) asciminib treatment. BCR::ABL1 IS level (left y-axis), BSNV expressed as variant allele frequency (right y-axis) over time (months, x-axis), BSNV, BCR::ABL1 single nucleotide variant, VAF, variant allele frequency, BD, bis in die, twice a day, IS, international scale.
The second patient (ASC-41, Fig. 4B) had received 5 prior TKIs and had most recently stopped ponatinib for primary resistance. Given a known history of multiple BSNVs, including a T315I (M244V, G250E, Y253H, T315I, M351Y, F359I, H396R, S438C and E459K), the patient received asciminib 200 mg twice daily. Prior to initiation of asciminib, BSNV analysis showed the presence of G250E (VAF 13%), Y253H (VAF 21%), T315I (VAF 3%), F359I (VAF 53%) and E459K (VAF 9%)-BSNVs, without evidence of the historically noted M244V, M351Y, H396R or S438C. While no significant reduction was seen in the BCR::ABL IS level, there was a change in the landscape of BSNV-containing clones with the emergence of a dominant clone carrying an isolated F359I-BSNV. The additional BSNVs, including the E459K, were no longer detectable, which may indicate that the clonal selection of E459K harbouring cells seen in patient ASC-01 on asciminib 40 mg BD may be overcome with intensified dosing.
The third patient (ASC-04, Fig. 4C) had received 4 prior TKIs, most recently bosutinib which was stopped for intolerance, and had previously achieved an MMR on dasatinib and nilotinib subsequently stopped for intolerance. They had no history of BSNV despite multiple screens by Sanger sequencing. Following initiation of asciminib the patient had a steady decline in their BCR::ABL1 IS level from 13.5% IS to a nadir of 0.119% IS, but never achieved MMR. During treatment with asciminib 40 mg twice daily, an emergent clone with an I502F-BSNV became dominant, with a progressive rise in VAF to 82%, then 89% and finally 100% on subsequent samples despite maintained CCyR. Interestingly upon treatment pause (during an episode of heart failure subsequently deemed unrelated to asciminib) there was a rapid rise in BCR::ABL1 IS level, with a fall in the VAF of I502F-BSNV to below the level of detection, indicating relative outgrowth of I502F harbouring cells by the non-mutated BCR::ABL1 population. Collectively this suggests that asciminib exerts selective pressure on the I502F harbouring cells, conferring a degree of resistance, but nevertheless sufficient sensitivity to maintain a CCyR.
The fourth patient (ASC-23, Fig. 4D) had shown primary resistance to imatinib with an emergent T315I-BSNV detected by Sanger sequencing. Despite achieving CCyR on ponatinib, they developed intolerable toxicity, and changed to asciminib 200 mg BD. On asciminib, they continued to deepen their BCR::ABL1 response, achieving MR4. Interestingly, the T315I mutation, that was below the level of detection by NGS at asciminib initiation, re-emerged with a rising VAF to 27%, then 100% during treatment, demonstrating the selective pressure exerted on T315I-harbouring cells by asciminib. Intriguingly, retrospective BSNV screening during the period of treatment with ponatinib does not show any evidence of clonal selection for T315I harbouring cells in that context (supplemental Fig. 4B).
留言 (0)