Facility and ethics statements
All experiments involving live SARS-CoV-2 were conducted in a biosafety level 3 facility maintained under negative pressure at the Wuhan Institute of Virology (WIV), Chinese Academy of Sciences (CAS) (approval No. NBL3-202320). All animal experiments were carried out in strict accordance with the institutional guidelines and approved by the Institutional Animal Care and Use Committee of WIV, CAS (approval No. WIVA42202206).
Cell culture and cell manipulation
A549-ACE2 cells (generated in house), Huh7 cells (Resource Center of WIV, CAS), Vero E6 cells (CRL-1586; ATCC) and HEK293T human embryonic kidney cells (CRL-11268; ATCC) were cultured in Dulbecco’s modified Eagle’s medium (DMEM) (C11995500BT, Thermo Fisher Scientific, Wilmington, DE, USA) containing 10% fetal bovine serum (Gibco) at 37 °C in the presence of 5% CO2. Cells were transfected with plasmids using lipofectamine 2000 reagent (cat. no. 11668-019; Invitrogen, Carlsbad, CA, USA) following the instructions suggested by the manufacturer. For experiments involving cell treatments, Huh7 cells were first treated with YS-49 (E0785), demethyl-coclaurine (S3294) (both from Selleck) or wortmannin (S1952; Beyotime Biotechnology) for 24 h, and then infected with SARS-CoV-2 and maintained for another 72 h.
Virus strains and Infection
SARS-CoV-2 (IVCAS 6.7512) and Omicron BA.5 (IVCAS 6.8981) were obtained from the Virus Resource Center of WIV, CAS. The viruses were propagated in Vero E6 cells and were titrated by plaque assay according to a standard procedure. In brief, Vero E6 cells were inoculated into a 24-well plate at 1 × 10⁵ cells/well. After 24 h, the cells were infected a 10-fold diluted viral stock solution in 200 µL of DMEM at 37 °C for 1 h. After removal of the inoculant, the cells were cultured in DMEM containing 0.9% methylcellulose at 37 °C for 4 days. Plaques were monitored and counted. Different susceptibility of cell lines to SARS-CoV-2, therefore, we tested different viral multiplication of infection (MOI) gradients and ultimately determined the optimal MOI for each cell line. Finally, we used MOI = 0.05 in Vero-E6 cells and MOI = 1 in A549-ACE2 and Huh7 cells for the following experiments.
Nanopore direct RNA sequencing and data analysis
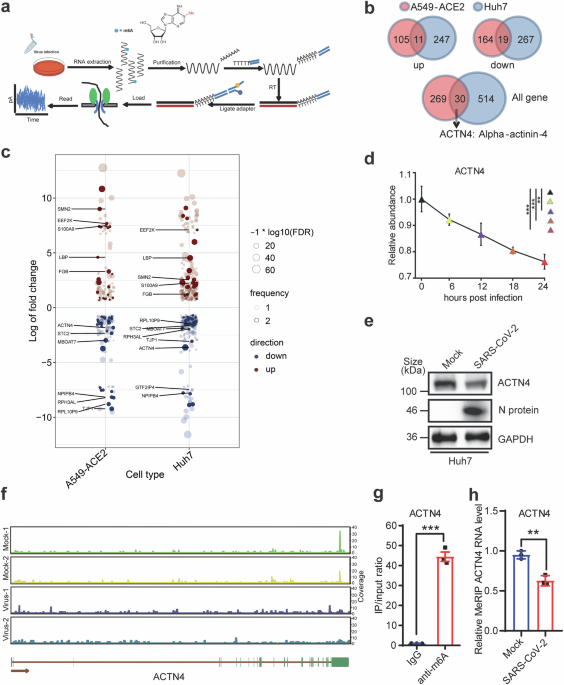
Total RNA was extracted from cells infected with SARS-CoV-2 at 48 h utilizing TRIzol Reagent (Invitrogen, Cat. No. 15596026), then purified using an Oligo(dT) kit (Thermo Fisher Scientific). Two micrograms of the purified RNA were employed for library preparation, adhering to the Oxford Nanopore direct RNA sequencing protocol (SQK-RNA002). The prepared libraries were loaded onto a FLO-MIN106D flow cell and sequenced using a MinION device (Oxford Nanopore Technologies). Data analysis was conducted at BENAGEN, setting a Q-value of 7 as the threshold for read screening. Guppy software version 3.4.5 (Oxford Nanopore Technologies) was utilized for base-calling. The multi_to_single_fast5 tool from the ont_fast5_api (version 3.1.6, available at https://github.com/nanoporetech/ont_fast5_api) was used to convert multi-FAST5 files to single-read files. The reads from Oxford Nanopore Technologies were aligned to the Homo sapiens cDNA reference genome (Ensembl release-102) using Minimap2 (version 2.24) with the options -ax splice -uf -N 32 -k 14 -t 20. Samtools (version 1.12) was then used to generate files in BAM format. Transcript abundance from the ONT reads was quantified using Salmon (version 1.4.0), based on the BAM files produced by Minimap2. Differential gene expression analysis was performed using edgeR, and the results were visualized with ggplot2 (version 3.4.2). The false discovery rate (FDR) cutoff for identifying differentially expressed genes was set at 0.05, and the absolute log fold change (logFC) threshold was set to greater than 2. Enrichment analysis of these differentially expressed genes was conducted using the R package clusterProfiler (version 4.0.5), with the parameters for GO enrichment analysis set to pAdjustMethod = “fdr”, pvalueCutoff = 0.05, and qvalueCutoff = 0.2. Identification of m6A sites was performed based on the de novo model of Tombo, followed by the MINES process for assigning m6A modulation status. Visualization of methylation sites was achieved using R (version 4.0.5) and ggplot2.
MeRIP-seq and data analysis
Briefly, total RNAs were extracted from Huh7 cells with/without SARS-CoV-2 infection. After the RNA integrity and concentration were confirmed, 50 μg RNAs were enriched by VAHTS mRNA Capture Beads (VAHTS, cat. NO. N401-01/02). After treating with 20 mM ZnCl2 following 95 °C for 10 min, 10% RNA fragments was saved as “Input”, while the rest was proceeded to m6A immunoprecipitation (IP) using anti-m6A Abs (Synaptic Systems, 202203). The stranded RNA sequencing library was constructed using the KC-DigitalTM Stranded mRNA Library Prep Kit for Illumina® (Catalog NO. DR08502, Wuhan Seqhealth Co., Ltd. China) according to manufacturer’s instructions, following with enrichment, quantification and finally sequencing on DNBSEQ-T7 sequencer (MGI Tech Co., Ltd. China) with PE150 model. Raw sequencing data were processed and analyzed as previously described, The m6A site analysis was performed using de-duplicated consensus sequences, which were mapped to the reference genome (https://www.ncbi.nlm.nih.gov/gene/81) using STAR software (version 2.5.3a) with default parameters.64
Variation of m6A modifications on ACTN4 mRNA was presented after normalizing the m6A coverage from IP with the m6A coverage from Input.
Plasmids
The plasmids pFlag-WTAP, pFlag-ACTN4, pHA-WTAP, pHA-nsp12, pHA-nsp7, and pHA-nsp8 were constructed by inserting the coding sequences of the indicated genes into the pXJ40-Flag and pXJ40-HA vectors. The truncated mutants pFlag-ACTN4Δ1, pFlag-ACTN4Δ2, pFlag-ACTN4Δ3, pHA-nsp12-N, and pHA-nsp12-C were constructed using the same vectors. The sequences of the short hairpin (sh)RNAs targeting specific genes used in this study were as follows: shWTAP-1: 5′- GTTATGGCAAGAGATGAGTTA-3′, shWTAP-2: 5′- ATGGCAAGAGATGAGTTAATT-3′, shACTN4-1: 5′-GCCACACTATCGGACATCAAA-3′, shACTN4-2: 5′- CATCGCTTCCTTCAAGGTCTT-3′, shACTN4-3: 5′- CCTCTCTTTCTCAGTCTTGTA-3’. The shRNAs were individually cloned into the pLKO.1-TRC vector (Addgene, 10878) and packaged into lentiviruses as described previously.24 Stable knockdown cell lines were selected with 5 mg/mL puromycin.
Western blotting and Reverse transcription quantitative PCR (RT-qPCR)
Western blotting analyses were performed as described previously.24 Briefly, cells were lysed by lysis buffer, centrifuged at 13,000 × g at 4 °C for 10 min, and the supernatant was removed. The proteins were separated using 10% sodium dodecyl sulfate-polyacrylamide gel, then transferred onto nitrocellulose membrane. The following antibodies (Abs) were used: anti-GAPDH (Cat. No. PA1-987), anti-METTL3 (15073-1-AP), anti-METTL14 (MA5-24706), anti-WTAP (PA5-52704), anti-ALKBH5 (16837-1-AP), anti-ACTN4 (19096-1-AP) purchased from Proteintech, anti-Flag (F1804, Sigma-Aldrich), anti-HA (#5017S, Cell Signaling Technology), and anti-SARS-CoV-2 nsp12 (A20233), anti-SARS-CoV-2 nsp7 (A20201), anti-SARS-CoV-2 nsp8 (A20202l), and anti-SARS-CoV-2 N protein (A20021) obtained from ABclonal. Luminescent signals were measured using the ChemiDoc MP imaging system (Bio-Rad, Hercules, CA, USA).
Total RNAs were isolated from cells using TRIzol Reagent (Invitrogen) and reverse transcribed using a HiScript First-Strand cDNA Synthesis Kit (Vazyme Biotech, Nanjing, China) according to manufacturer’s instructions. qPCR was run using SYBR Green (Yeasen Biotech, Shanghai, China) on a CFX Connect real-time system (Bio-Rad Laboratories). The primers used for qPCR were as follows: ACTN4 forward: 5′-GCAGCATGGGCGACTACAT-3′, reverse: 5′-TTGAGCCCGTCTCGGAAGT-3′, SARS-CoV-2 nucleoprotein (N) protein forward: 5′-GGGGAACTTCTCCTGCTAGAAT-3′, reverse: 5′-CAGACATTTTGCTCTCAAGCTG-3′, SARS-CoV-2 spike (S) glycoprotein forward: 5′-ACTTACTCCTACTTGGCGTGTT-3′, reverse: 5′-CTAGCGCATATACCTGCACCAA-3′, and GAPDH forward: 5′-GAAGGTGAAGGTCGGAGTC-3′, reverse: 5′-GAAGATGGTGATGGGATTTC-3′.
Indirect immunofluorescence assay
Huh7 cells were infected with SARS-CoV-2 and harvested at 48 hpi. Cells were fixed overnight in 4% paraformaldehyde at 4 °C, washed three times with phosphate-buffered saline (PBS), incubated with 0.5% Triton X-100 at room temperature for 10 min, and blocked in 3% bovine serum albumin (BSA) at room temperature for 1 h. The cells were probed with indicated primary antibodies (1:100) at 4 °C overnight, then washed three times with PBS, and then incubated with indicated secondary antibodies at room temperature for 1 h. Nuclei were stained with Hoechst 33258 (1:1000). The cells were observed under a PerkinElmer VoX confocal microscope.
Formaldehyde-crosslinked RIP assay
Huh7 cells were cross-linked with 1% methanol-free formaldehyde at 37 °C for 10 min, then quenched with 0.125 M glycine. After three washes with ice-cold PBS, the cells were collected and resuspended in RIP buffer (150 mM KCl, 25 Mm Tris-HCl pH 7.4, 5 mM EDTA, 0.5 mM dithiothreitol (DTT), 0.5% NP40, 100 U/mL RNase inhibitor, 100 µM phenylmethylsulfonyl fluoride, and 1 µg/mL proteinase inhibitors. The cell lysates were centrifugated at 13,000 × g at 4 °C for 10 min, and the supernatants were incubated with anti-Flag Abs or mouse IgG (control) at 4 °C overnight. After incubating the mixture with the protein-G agarose beads at 4 °C for 2 h, washing the beads three times with wash buffer (300 mM KCl, 25 mM Tris-HCl pH 7.4, 5 mM EDTA, 0.5 mM DTT, 0.5% NP40, 100 U/mL RNase inhibitor, 100 µM phenylmethylsulfonyl fluoride, and 1 µg/mL proteinase inhibitors), followed by washing the beads three times with RIP buffer. After proteinase K digestion, RNA was extracted using TRIzol and used in the following RT-qPCR assay.
Methylated RIP qPCR (MeRIP-qPCR)
Briefly, total RNA was incubated with anti-m6A Abs (Synaptic Systems, Goettingen, Germany) or IgG in RIP buffer (150 mM NaCl, 0.1% NP-40, 10 mM Tris-HCl, pH 7.4) at 4 °C for 2 h. The mixture was incubated with anti-rabbit Ab-bound magnetic beads (S1432S; NEB, Ipswich, MA, USA) at 4 °C for 2 h. Then, washed the beads six times with RIP buffer and incubated with elution buffer (5 mM Tris-HCl, pH 7.5, 1 mM EDTA, pH 8.0, 0.05% SDS, and 4.2 µl of 20 mg/mL proteinase K) at 50 °C for 1.5 h. The eluted RNAs were purified using phenol/chloroform, precipitated with 75% ethanol, and subjected to RT-qPCR.
Measurement of mRNA stability
Huh7 cells with WTAP knockdown or overexpression were treated with actinomycin D (4 μg/mL) for the indicated times. RNA was extracted and analyzed by RT-qPCR. RNA turnover rates and half-lives were measured and compared as previously reported.65 The half-lives of remaining RNAs were obtained by linear regression fitting of relative RNA remaining (ln) as a function of time using the following equation: t1/2 = ln (2)/slope.
Ribosome loading assay
Ribosome loading onto ACTN4 transcripts was quantified as previously described.66 Briefly, Huh7 cells with WTAP overexpression or knockdown were treated with 100 mg/mL cycloheximide at 37 °C for 10 min, washed three times with PBS, and lysed with ribosome lysis buffer (10 mM Tris-HCl pH 7.4, 5 mM MgCl2, 100 mM KCl, 1% Triton X-100, Protease inhibitor, 2 mM DTT, 100 mg/mL cycloheximide, and RNase inhibitor). After centrifugation at 5000 × g at 4 °C for 10 min, 10% supernatant was taken as an input sample, and the remainder was loaded on top of a 10–50% sucrose gradient and centrifuged at 30,000 × g at 4 °C for 3 h. After removing the top lysis layer, and RNA was extracted from the ribosomal pellet layer using TRIzol. ACTN4 and GAPDH levels were measured using RT-qPCR, and GAPDH was set as the control.
Co-IP assay
Huh7 cells were washed three times with PBS after collected and lysed with lysis buffer (50 mM Tris-HCl pH 7.5, 1 mM EGTA, 1 mM EDTA, 1% Triton X-100, 150 mM NaCl, 2 mM DTT) supplemented with protease inhibitors on ice. After centrifugation at 13,000 × g for 10 min, 5% supernatant was taken as input, and the remainder was incubated with indicated Abs overnight at 4 °C. After incubating the mixture with Protein G agarose at 4 °C for 2 h, the beads were washed with washing buffer and then with IP buffer three times each. Finally, the co-IP and input samples were denatured and subjected to western blotting.
CCK-8 cell viability assay
Huh7 cells were inoculated into 96-well plates at 20,000 cells/well, then treated with the indicated concentrations of wortmannin, YS-49, or demethyl-coclaurine for 24 h. Cell viability was tested using a CCK-8 Kit (A311; Vazyme) according manufacturer’s protocols. The data were plotted via GraphPad Prism 8.
Mouse experiments, hematoxylin and eosin staining, and immunohistochemistry
Eight-week-old, male transgenic K18-hACE2 mice (C57BL/6JGpt-H11em1cin(K18-hACE2)/Gpt (Strain NO. T037657)) were randomly divided into groups with at least five animals in each group. The anti-viral effects of YS-49 and demethyl-coclaurine were investigated using weight monitoring, virus detection (RT-qPCR, focus-forming assay, immunostaining analysis), histopathology, and survival analysis. Mice were inoculated with 1 × 10⁵ pfu SARS-CoV-2 BA.5 strains nasally, and the mice were intragastrically administrated daily at a drug dose of 50 mg/kg according to the body weight. Genomic RNA of secreted viruses was isolated from tissue samples using the QlAamp Viral RNA Mini Kit (52906; Qiagen) as suggested by the manufacturer, and quantified by RT-qPCR using a Taqman probe targeting the SARS-CoV-2 N gene (same forward and reverse primers as mentioned above, fluorescence probe: 5′-FAM-TTGCTGCTGCTTGACAGATT-TAMRA-3′). The data were plotted using GraphPad Prism 8.
Hematoxylin and eosin staining and immunohistochemical analysis were performed at Wuhan Bioqiandu Technology. Briefly, mouse lung and brain sections were fixed in 4% paraformaldehyde, embedded in paraffin, sectioned, and stained with hematoxylin and eosin. For immunohistochemistry, slides were blocked in 3% bovine serum albumin for 30 min and incubated with a primary Abs against SARS-CoV-2 N protein (#26369; Cell Signaling Technology) in blocking buffer at 4 °C overnight. After washing with PBS three times, the slides were incubated with cy3-conjugated secondary Abs at room temperature for 50 min, and nuclei were counterstained with DAPI. Images were acquired using Pannoramic DESK, P-MIDI, and P250 (3D HISTECH).
Statistical analysis
Data are presented as means ± standard error of the means (SEMs) or standard deviations (SDs) (n = 3). All experiments were repeated at least three times. RT-qPCR data were statistically analyzed using a two-tailed unpaired t-test and one-way ANOVA in GraphPad Prism Software (version 5). P ≤ 0.05 was considered statistically significant.


留言 (0)