
記住我


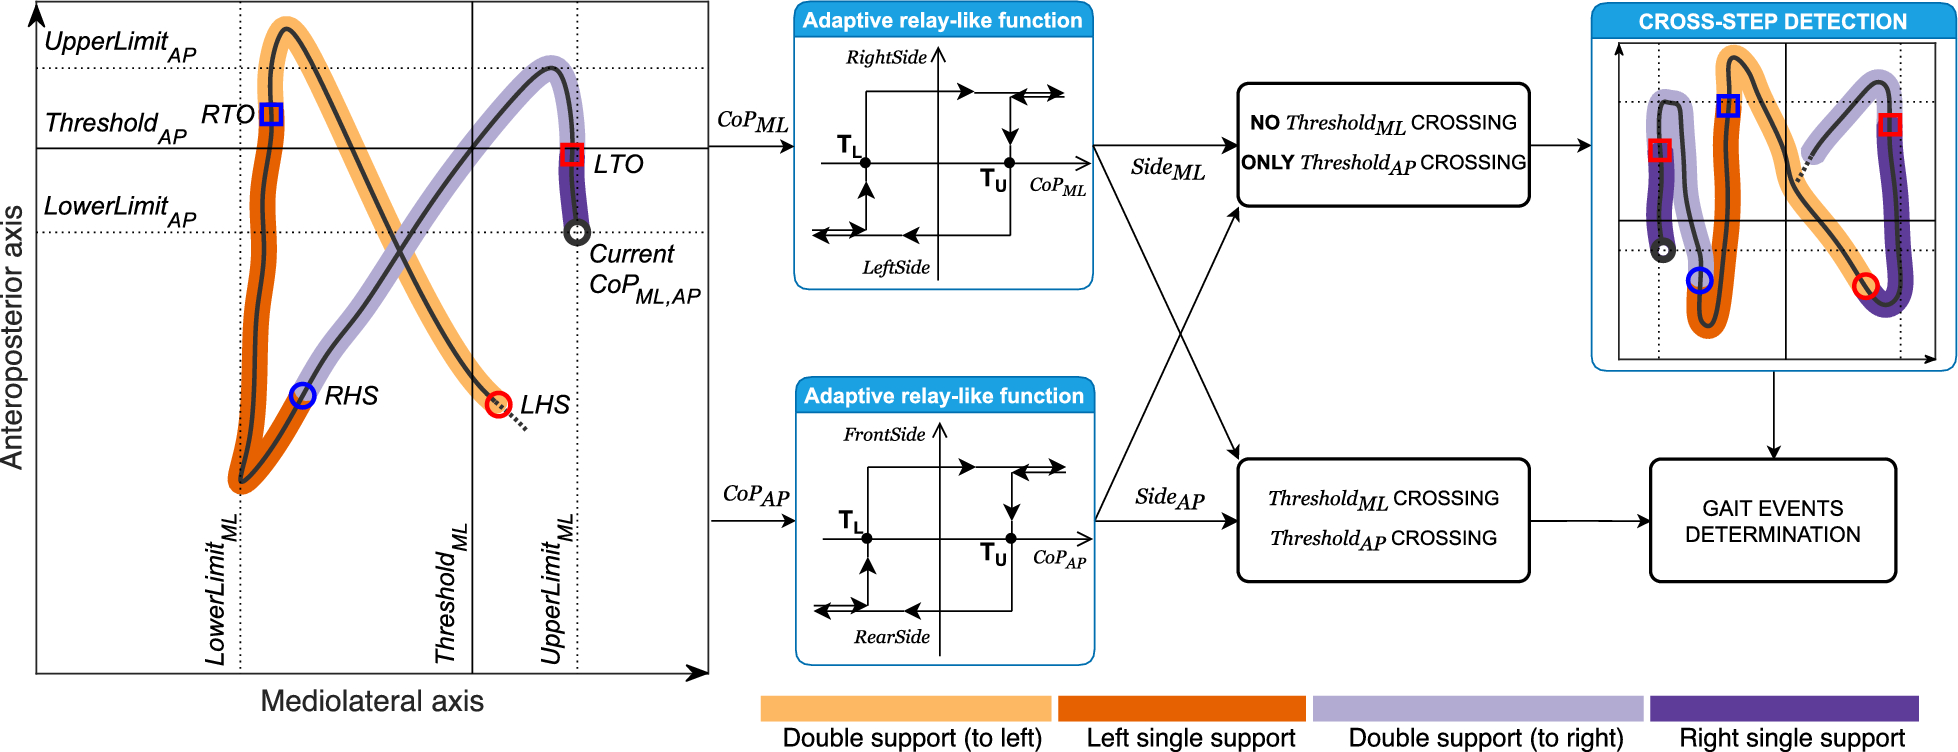


The operational overview of the algorithm is shown in Fig. 1. The algorithm that was designed to detect gait events in real-time relies exclusively on the CoP signal and comprises two main components: adaptive relay-like functions and logic for determining gait events. Two adaptive relay-like functions, one for CoPML and the other for CoPAP axis, monitor the limits of the CoP signal during each gait phase (LeftSingleSupport, DoubleSupportToRight, RightSingleSupport and DoubleSupportToLeft) and ensure the CoP signal pushes the limits, denoted as UpperLimitML,AP and LowerLimitML,AP, in anteroposterior (AP) and mediolateral (ML) direction. Thereafter, relay-like functions dynamically adjust the upper TU and lower TL thresholds for either the ML or AP axis, according to the rules outlined in equations (1) and (2). The parameter RatioML,AP defines the position of thresholds TU and TL between UpperLimitML,AP and LowerLimitML,AP. Both thresholds TU and TL are also limited between minimal Tmin and maximal value Tmax as shown in equation (3), to ensure they are neither too close nor too far from the UpperLimitML,AP or LowerLimitML,AP boundaries. By utilizing equation (4), the threshold ThresholdML,AP then selects the appropriate threshold (TU or TL) based on the ongoing function state. In the ML direction, the algorithm indicates if the CoP is on the left or right “wing” of the butterfly shape (RightSide or LeftSide). In the AP direction, it indicates whether the CoP is positioned at the front or back of the butterfly shape (FrontSide or RearSide).
Fig. 1.
The algorithm for real-time gait event and cross-step detection operates by employing a thresholding technique applied to the Center of Pressure (CoP) signal
$$_=_-_ \left(_ -_\right)$$
(1)
$$_=_+_ \left(_ -_\right)$$
(2)
$$_=\left\_& if& _\le _\\ _& if& _<_< _\\ _& if& _\ge _\end\right.$$
(3)
$$_=\left\_& if& RightSide\ or\ FrontSide\\ _& if& LeftSide\ or\ RearSide\end\right.$$
(4)
Upon the CoP crossing either ThresholdML or ThresholdAP, the adaptive relay-like functions switch sides and provide output to identify potential operational sides: SideML (RightSide or LeftSide) and SideAP (FrontSide or RearSide). An example of adaptive relay-like function is shown in Fig. 2. The logic component of the algorithm then monitors the crossings of the thresholds and provide gait events at the corresponding instances of threshold crossings. Essentially, if both the CoPML and CoPAP cross their respective thresholds (ThresholdML and ThresholdAP) during the same gait phase, the algorithm recognizes it as a normal gait and outputs the occurrence of the corresponding gait event (LHS, RTO, RHS or LTO), allowing for asymmetric CoP patterns resembling a “butterfly” shape. However, if CoP crosses the threshold in AP axis twice consecutively, without any threshold crossing in the ML axis, the algorithm identifies it as a cross-step event. In such cases, the gait events are determined based on the crossings of the ThresholdAP. The algorithm terminates the cross-step state when the CoPML crosses ThresholdML again. The parameters of the algorithm were configured as follows: RatioML and RatioAP were both assigned a value of 0.2. For the AP direction, Tmin and Tmax were both set to 0.04 m, while for the ML direction, Tmin and Tmax were set to 0.05 m and \(\infty\) m (infinity), respectively. The algorithm parameters were chosen based on our prior experience from previous experiments where the algorithm was utilized, acquired through the iterative experimentation and refinement to ensure optimal performance of the algorithm. These parameters were consistent across all simulations conducted on CoP datasets in the present study.
Fig. 2.
Adaptive relay-like function used in the algorithm, where the threshold adapts based on the upper and lower limits of the CoP. The function alters its state (sides) whenever CoP crosses the threshold, which is seen at the switch points
ParticipantsThis study utilized data from our previous measurements, involving a total of forty-four participants [3, 18, 28, 30]. These participants represent three groups: thirteen stroke survivors (2 females, 5 with left-sided hemiparesis in subacute phase, age range 20–67 years, mean 48 ± 8.7; height 178 ± 8 cm; body mass 79 ± 11 kg), ten subjects with transtibial amputation (2 females, 5 with left-sided amputation, age range 28–63 years, mean 50 ± 10; height 176 ± 11 cm; body mass 87 ± 18 kg) and twenty-one healthy adults (3 females, age range 21-61 years, mean 36 ± 11; height 179 ± 6 cm; body mass 77 ± 9 kg) without any known neurological, muscular or orthopaedic problems. The inclusion criteria for the stroke survivors and subjects with transtibial amputation required them to be independent in ambulation (with a functional ambulation category FAC of at least 5 on a scale from 1 to 6 [31]), capable to walk independently or under supervision without the use of walking aids, and able to follow instructions. There were no specific inclusion criteria for healthy adults. The study received approval from The National Medical Ethics Committee of the Republic of Slovenia and all participants provided written informed consent.
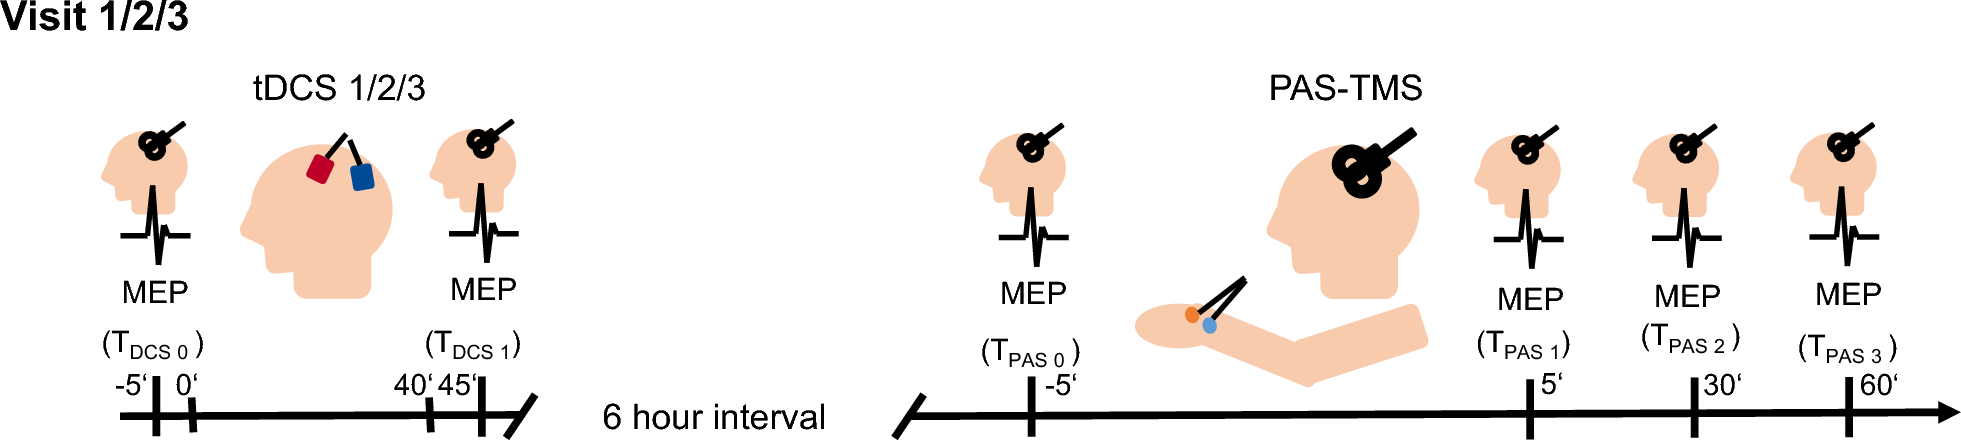
Procedures and measurementsThe CoP data was obtained during our previous studies, which assessed dynamic balancing responses using a Balance Assessment Robot for Treadmill Walking (BART). BART utilizes a custom-designed, wide instrumented treadmill and an actuated pelvic link with a pelvis brace. In these studies, participants experienced perturbing force impulses applied to the pelvis while walking on the instrumented treadmill [3, 18, 28, 30]. Each participant started gait balance assessment with an introductory session in order to familiarize with treadmill walking as well as with the perturbation amplitudes that were normalized to 5%, 10% or 15% of the participant’s body weight. To establish their natural gait pattern (native gait), each participant walked for 2–3 minutes without any perturbations (unperturbed walking), followed by an approximately 7–10 minutes assessment during which force impulses were randomly applied to either the left or right side of the pelvis every 8 seconds on average. The variation in trial lengths for gathering native and perturbed gait data was due to differences in the protocols used in our previous studies, where varying walking speeds, as well as differing types and amounts of perturbations, were applied. The experimental protocol is shown in Fig. 3. The perturbing force impulses, directed mediolaterally, provoked reactive balance responses that often led to cross-stepping behaviour following the onset of the perturbation. CoP signals were obtained through four precise force transducers (K3D120, ME Systeme GmbH) placed underneath the treadmill and equipped with measuring amplifiers (measuring amplifiers GSV-1A4, ME Systeme GmbH). The perturbing force impulses were triggered when the participant entered left or right stance phase (i.e. at left or right HS). Our database consisted of three datasets, each associated with a different walking speed: (1) sessions with healthy participants walking at speeds of 0.4 m/s, 0.6 m/s, and 0.8 m/s consecutively; (2) sessions with stroke participants walking at a speed of 0.4 m/s; and (3) sessions with subjects with transtibial amputation walking at a speed of 0.5 m/s.
Fig. 3.
Experimental protocol consists of introductory session followed by unperturbed walking to capture participants' native gait and perturbed walking to induce cross-step reactions
Data processing and evaluationThe algorithm script was written and evaluated in the post hoc simulated real-time processing operation using Matlab R2021a (The MathWorks, Inc.). CoP signals from both the native gait and perturbed gait of each participant were sampled at a frequency of 200 Hz. Subsequently, CoP signals from both walking conditions were processed using the algorithm simulation. The simulation outputs consisted of the identification of gait events including left and right HS, left and right TO and cross-step events. The native gait contained approximately 20 to 60 gait cycles, depending on duration of the unperturbed walking and walking speed. During perturbed gait we specifically focused on collecting cross-step performances, which encompassed eight consecutive gait events starting from the HS event. Moreover, the CoPAP signal was subjected to offline manual analysis to precisely determine the locations of each gait event. Detecting gait events from the CoP pattern offline is straightforward when the CoP forms a butterfly shape. However, during cross-step movements, the butterfly shape is lost in the CoPML signal while retained in the CoPAP signal, maintaining its saw-shaped appearance from unperturbed gait. In such cases, gait events remain identifiable when analyzed offline. Specifically, the peaks of the CoPAP signal were identified, with positive peaks indicating TO events (aligned with the walking direction), while negative peaks represented HS [20]. This approach served as the gold standard in the validation experiment process, similar to the methodology employed in [7]. Conversely, if the CoP is disrupted by undefined oscillations due to unconventional alternative stepping such as foot pivoting, cross-uncrossing, rear foot crossing as described in [27], such alternative stepping responses (not recognized as cross-steps) were excluded from the analysis. Consequently, we calculated the absolute mean errors (AME, in ms) to assess the algorithm's temporal accuracy in detecting gait events by subtracting offline identified gait event times from the counterparts obtained from the algorithm's output (error is positive for a delayed algorithm’s estimation). Histograms were generated to illustrate the AME of the gait events for each walking speed and participant group individually, with the average and standard deviation of the calculated AME provided. The primary outcome of this study was the algorithm’s success rate (%) of detecting cross-step events. The success rate (%) for each participant was defined as the ratio between successfully recognized cross-steps and the total number of cross-steps performed at each walking speed. In the case of the natural gait, the success rate (%) was determined based on both successfully and unsuccessfully detected gait events.
Statistical analysisA repeated measures analysis of variance (ANOVA) was employed to assess the potential relationship between the success rate of cross-step detection by the algorithm and various walking speeds. This analysis incorporated data from a group of 12 healthy participants, examining walking speeds of 0.4 m/s, 0.6 m/s, and 0.8 m/s. To investigate the impact of pathology on the algorithm's cross-step detection success rate, a one-way ANOVA was utilized. Specifically, the analysis compared the cross-step detection success rates of the algorithm for three groups: a healthy group walking at 0.4 m/s, a stroke group walking at 0.4 m/s, and an amputee group walking at 0.5 m/s. The statistical significance level was set at 5%.
留言 (0)